…or so proclaims my venerable data-crunching guy at the REreport. All the data is available and updated monthly under my “Market Trends” tab, organized by MLS District, or city-wide, annual or monthly, single family or condo — it’s all available here.
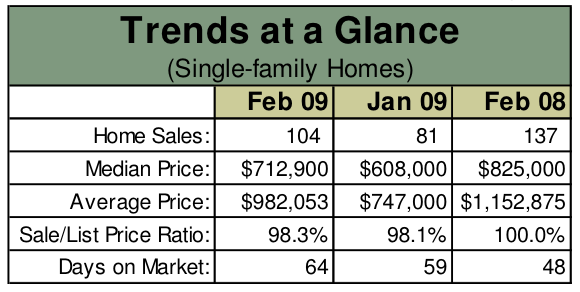
This chart, from the lead-in page, shows unit sales and median prices for both homes and condos are up from Jan 09, but down year over year.
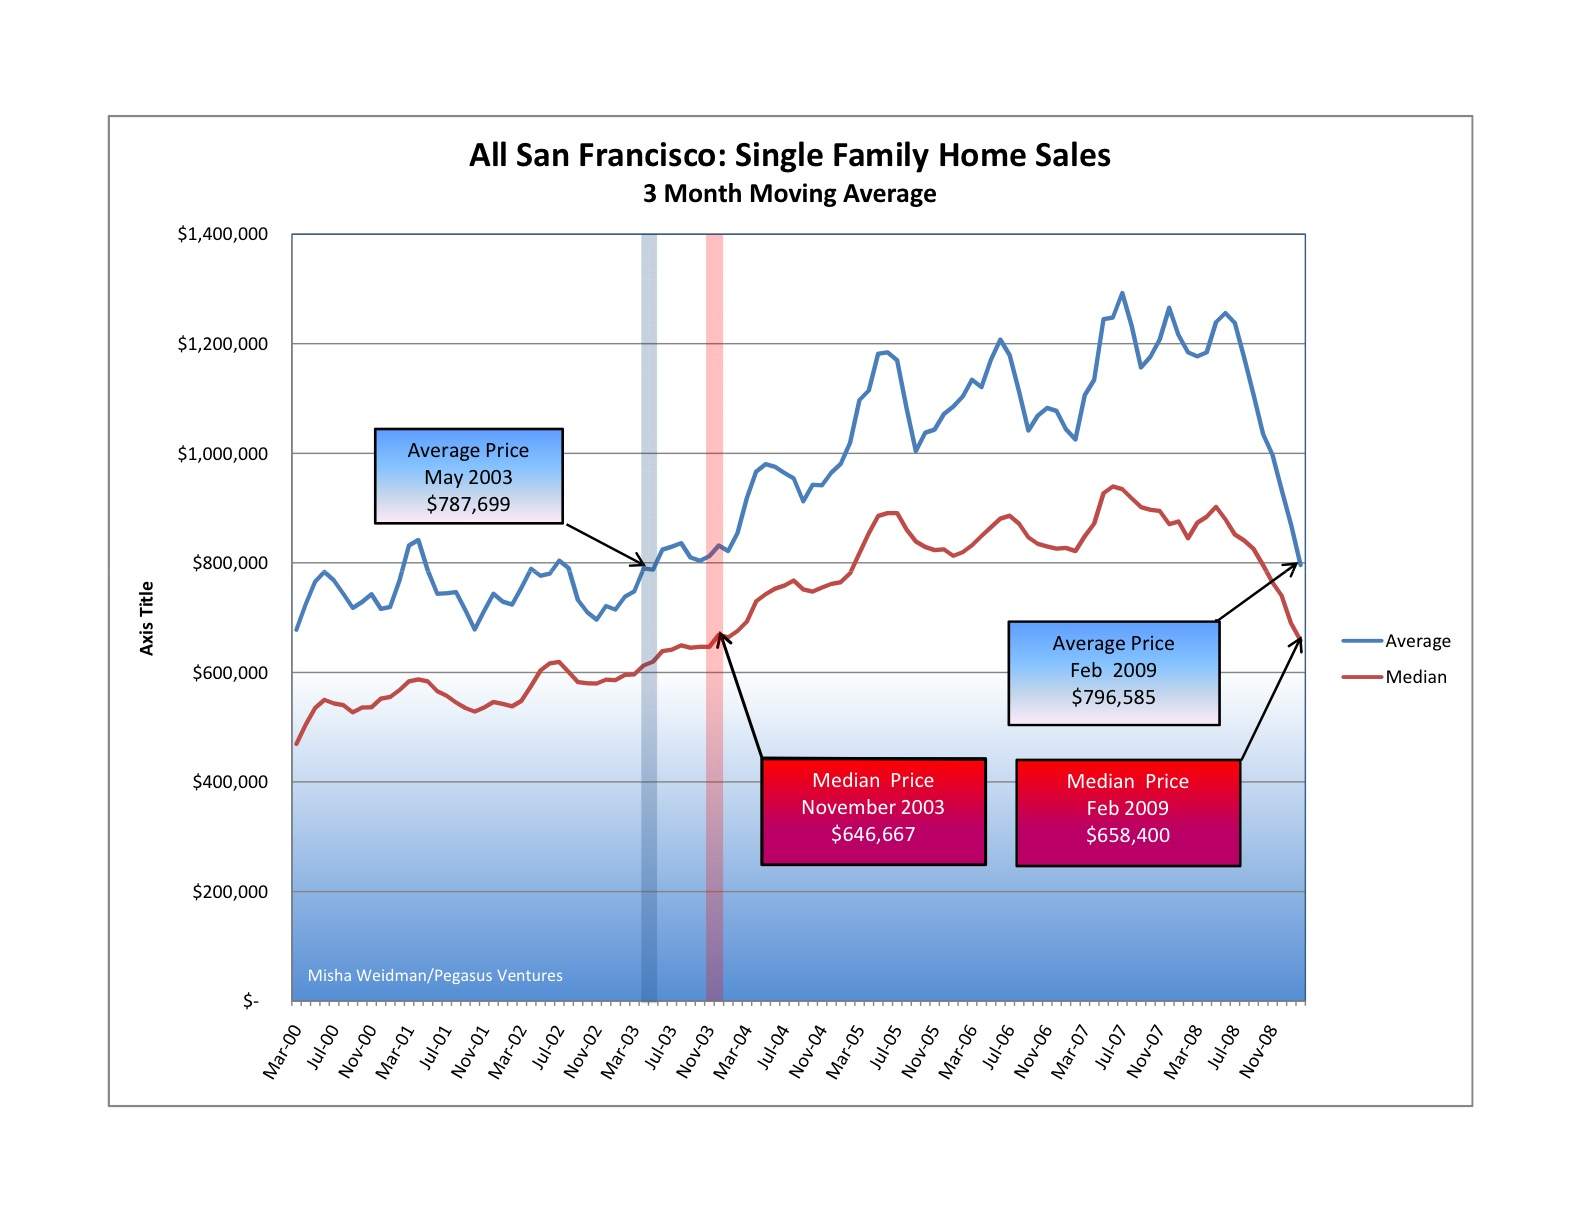
But not so fast. Much as I’d love to believe we’ve hit bottom, it’s hard to know whether this is anything more than the usual seasonal uptick in sales now that we’re coming out of the winter doldrums. Here’s the chart for single family homes sales. See those incredibly regular troughs right around Jan/Feb each year? I’d say it’s way to early to declare a bottom.
Ever wonder how much that would cost you in San Francisco? Ever think it might make sense to buy your own little piece of heaven and build the house of your dreams on it rather than pay through the nose for an old Victorian lady wearing a lot of make-up and suffering from 100 year-old plumbing?
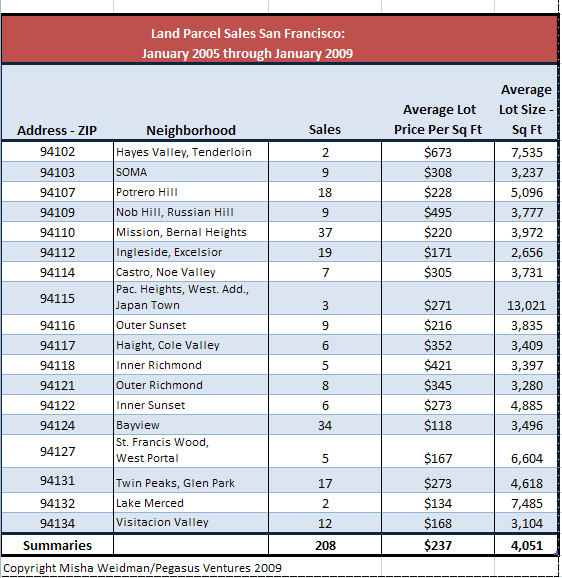
First off, you may spend a lot of time looking. Since 2005, there have only been 216 undeveloped land sales in San Francisco. I’ve tabulated the results by ZIP code for the 208 for which there was sufficient information to calculate the price per square foot.
With so few data points available, one should be careful drawing conclusions. For example, $673 per square foot for land in Hayes Valley and/or the tenderloin? I don’t think so. With only two data points for that zip, who knows why?
Still, the numbers make an overall kind of sense. Zip 94109 (Nob Hill, Russian Hill) is at the top end at $495 per foot; zip 94124 (Bayview) is at the bottom. Most of the zips line up more or less where you’d expect them to.
A quick recent case study: a 1900 foot “view lot” on Diamond St in Noe Valley, heading up towards Diamond Heights sold in June 08 for $1,052,000 — a cool $100,000 over the asking price. That’s $550 bucks a foot. That price included approved construction plans and permits for a 3100 square foot 4BR/4BA home, complete with elevator. Construction costs can obviously vary widely, but my insurance broker quotes an insurance industry “replacement cost” range of $300 to $500 per square foot for San Francisco/Marin. That includes architectural fees, etc.
Take the low end of that range and you get a construction cost on that house of $930,000. So you’re in for $2 million before you spend a dime for financing charges, delays, cost over-runs, law-suits from disgruntled neighbors, seeing your shrink, costs of divorce, etc.
This confirms my view that the only people who can really make money developing residential property in San Francisco are the ones who can do big multi-unit projects and contractors who don’t have to pay retail to build or fix something. The market’s too efficient to leave any fat for people just looking to build and spin. Same thing’s true for the mythical “fixer-upper.”
On the other hand, if you’re still one of the happy few who don’t feel beaten down by the daily economic news, perhaps you should go ahead and build that dream-house. There’s always slim pickings for 3,000 square foot homes in San Francisco, let alone ones equipped with an elevator. And if you do find one, you’ll be paying north of $2 million anyway.
Just be sure to budget extra for the shrink and the divorce attorney.
Saturday’s NY Times proclaims “A Gloomy Outlook for Home Sales’ Big Season.” The headliner, by the way, was “Job Losses Hint at Vast Remaking of U.S. Economy.” Is it really any wonder we have difficulty sleeping a’ nights?
Here are some of the cheery highlights:
One out of every seven apartments and houses in the US are vacant, a level not seen since the 1960’s. That’s about 19 million units
Less than a third of those are actually for rent or for sale, meaning that many more could yet come onto the market.
New contracts for previously owned homes fell at their fastest pace for two years.
Some areas that have fallen fastest, like inland California, are seeing improved sales.
Urban areas that have withstood the recession reasonably well, like San Francisco and New York, are “frozen.”
We pass Elk Grove on our way up to Tahoe. Beautiful spot east of Sacramento. You can buy a 3 BR house there for $193,000. The same house sold for $336,000 four years ago. The mortgage is a $100 less than it costs to rent a 2BR apartment. It’s hard not to think of that as positive. That is, unless you were the one who lost $143,000 in equity.
They’re predicting the housing market will get “worse” before it gets better. Why “worse”? Because a lot of people are going to feel — and be — a hell of a lot poorer than they used to. And the people for whom an increase in housing affordability might make a difference are the ones who are getting hammered the worst.
Here’s a chart showing future’s contracts on home prices. It shows prices deteriorating further this year, followed by a long, flat recovery starting some time in 2010.
Sorry, folks, but it’s that bad — or good, depending on your perspective.
I tracked average and median prices going back to 2000 for the ten combined MLS districts that comprise the San Francisco Multiple Listing Service — the big database that realtors use to list properties and record sales information . (The MLS District Map is here, on my Market Trends page.) Here are the results (click to make the chart bigger):
Pretty scary stuff, especially when you look at the suislide (a new word is born?) that started in June of last year and shows no signs of slowing down.
Before you head for the windows, or call your realtor (me!) to start looking for a house to buy, consider this: as I’ve said before, there’s nothing so local as real estate. It really does matter what neighborhood you’re talking about. This chart, while it does illustrate something meaningful about the overall SF market, doesn’t tell you anything about values in any particular neighborhood. It lumps together data from neighborhoods as diverse as Hunter’s Point and Visitacion Valley in District 10, which has been slammed for well over a year now, with neighborhoods like Noe Valley in District 5 and St. Francis Wood in District 4, both of which seem to be holding up pretty well. Go to my Market Trends page to see the charts for individual districts. I’ll be creating charts for individual neighborhoods within districts for future blogs.
And if it’s any consolation, SF real estate is holding up a heck of a lot better than the stock market, don’t-cha-know. Today the S&P 500 closed at 682.55. The last time it closed under 683 was on May 17, 1996.


