SF’s Condo Market since COVID: Location Matters – Except When it Doesn’t


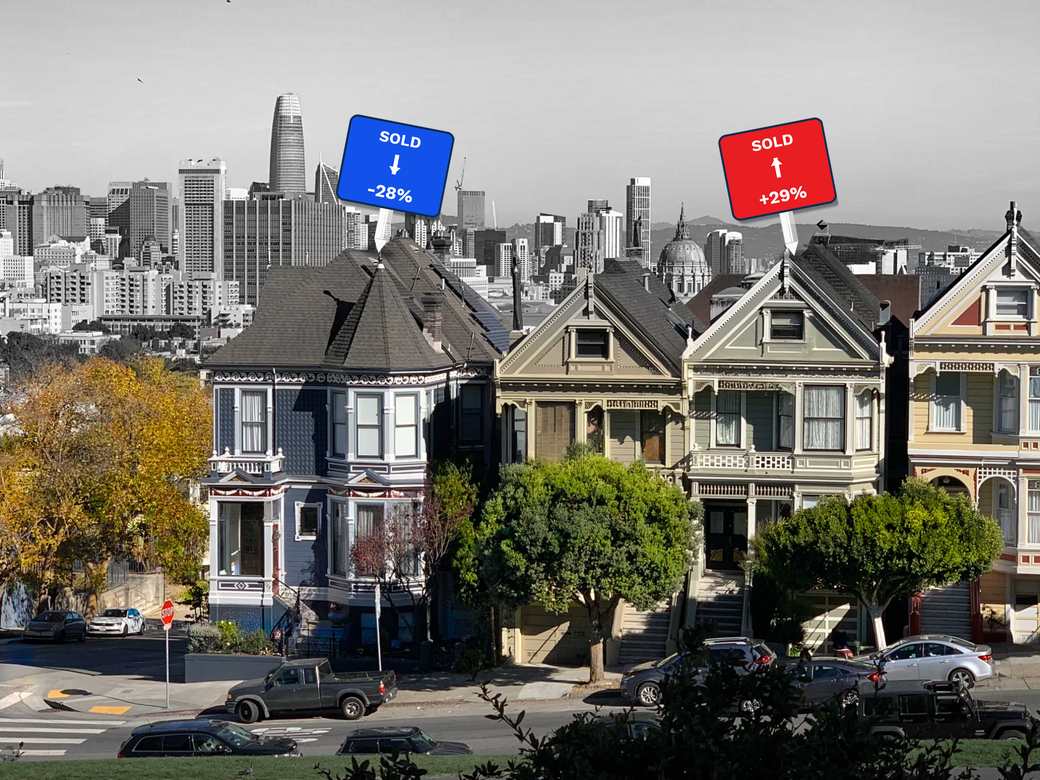
San Francisco Houses with different price signs
Original Photo taken and edited by Misha Weidman. For Sale signs added with ai.

Your correspondent has been hard at work wrestling with a database with nearly 40,000 sales going back to pre-pandemic January 2019. Full disclosure:  Claude has been my constant side-kick to analyze and deep-dive the data in ways I would never have been able to do before.  Conclusions and writing remain my own.

As promised in my last newsletter,  here’s a heatmap — actually two — comparing price changes in the condo market between the 6-month period right before the COVID pandemic lockdown in March 2020, and the 6-month period ending in mid-July 2026.  (Note these are best viewed on your computer screen, not a mobile device; click on the “full screen button” for the best experience.)

Why these two periods?  Because I wanted to see to what extent the city’s condo market has recovered from the  exodus that followed the COVID pandemic.  It’s well documented that the exodus hit the condominium market hard and the Downtown/SoMa area particularly hard. And there’s been lots of talk of “recovery.”  I’ll get to more recent trends in my next post but I wanted to start with a longer-term, city-wide view.  And for that, I thought a heatmap might provide a good visual guide to where we are in relation to where we were pre-COVID.

The first chart above compares median sales price for the two periods; the second compares median sales price per square foot.  At a glance, the Sales Price Heatmap simply reveals much more color variation, with a mix of up (red) and down (blue) subdistricts.  This is especially so in the Downtown/SoMa area that’s outlined in navy blue. Continue reading “SF’s Condo Market since COVID: Location Matters – Except When it Doesn’t”
Winners and Losers: A Heat Map of San Francisco’s Neighborhoods

I’m back!  (More on this later….)

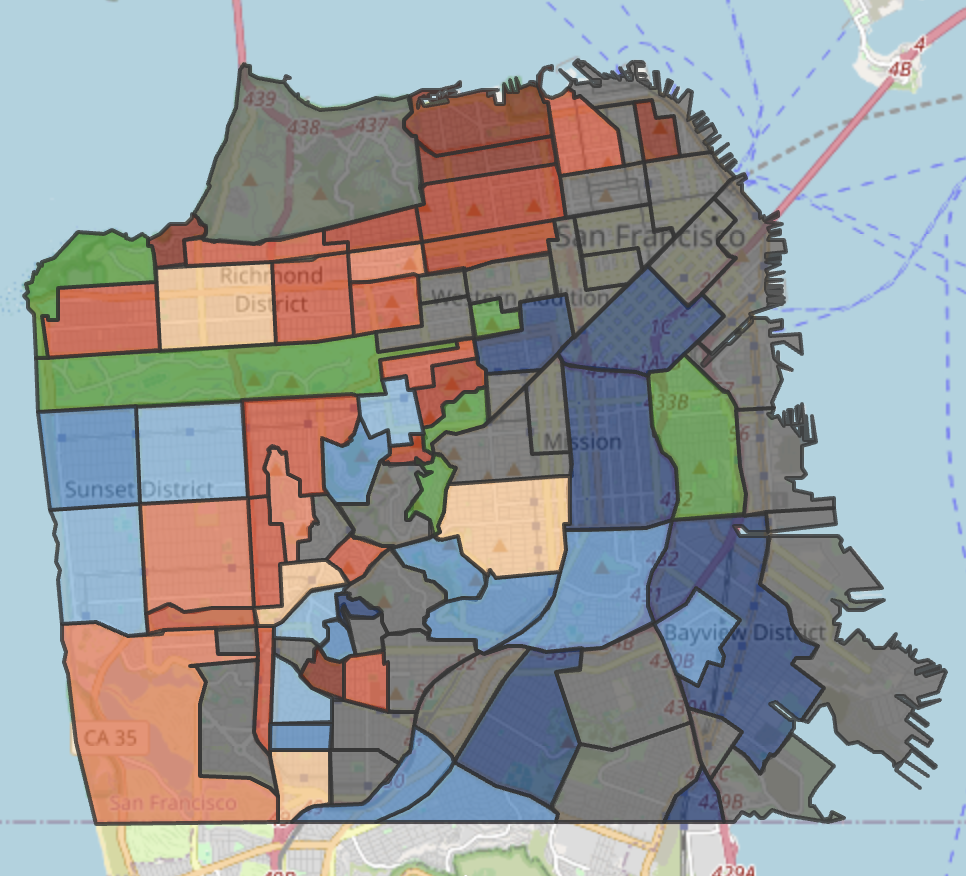
I’m so excited to present this heat map of San Francisco neighborhoods, which I believe may be the first of its kind.  I’ve been thinking about this idea for a while:  thank you Claude, and a shout-out to my son, too, who helped me bring the coding part of this project to fruition.

Be sure to click on the “fullscreen” button on the map below to expand it. We will get into the qualifications shortly, Continue reading “Winners and Losers: A Heat Map of San Francisco’s Neighborhoods”

SF Real Estate Heats Up as the Weather Cools Down

Generated with Claude.ai using a photo taken by Misha Weidman
Image Generated with Claude.ai

In my last post, I wrote that San Francisco’s residential market, fueled by the booming economics of local AI companies, was bucking the trend of most Bay Area counties by showing clear signs of strength while other counties stayed flat or faltered.  Recent data suggests that this trend could be accelerating.

In Contract, Pendings, Sales Volume All Up

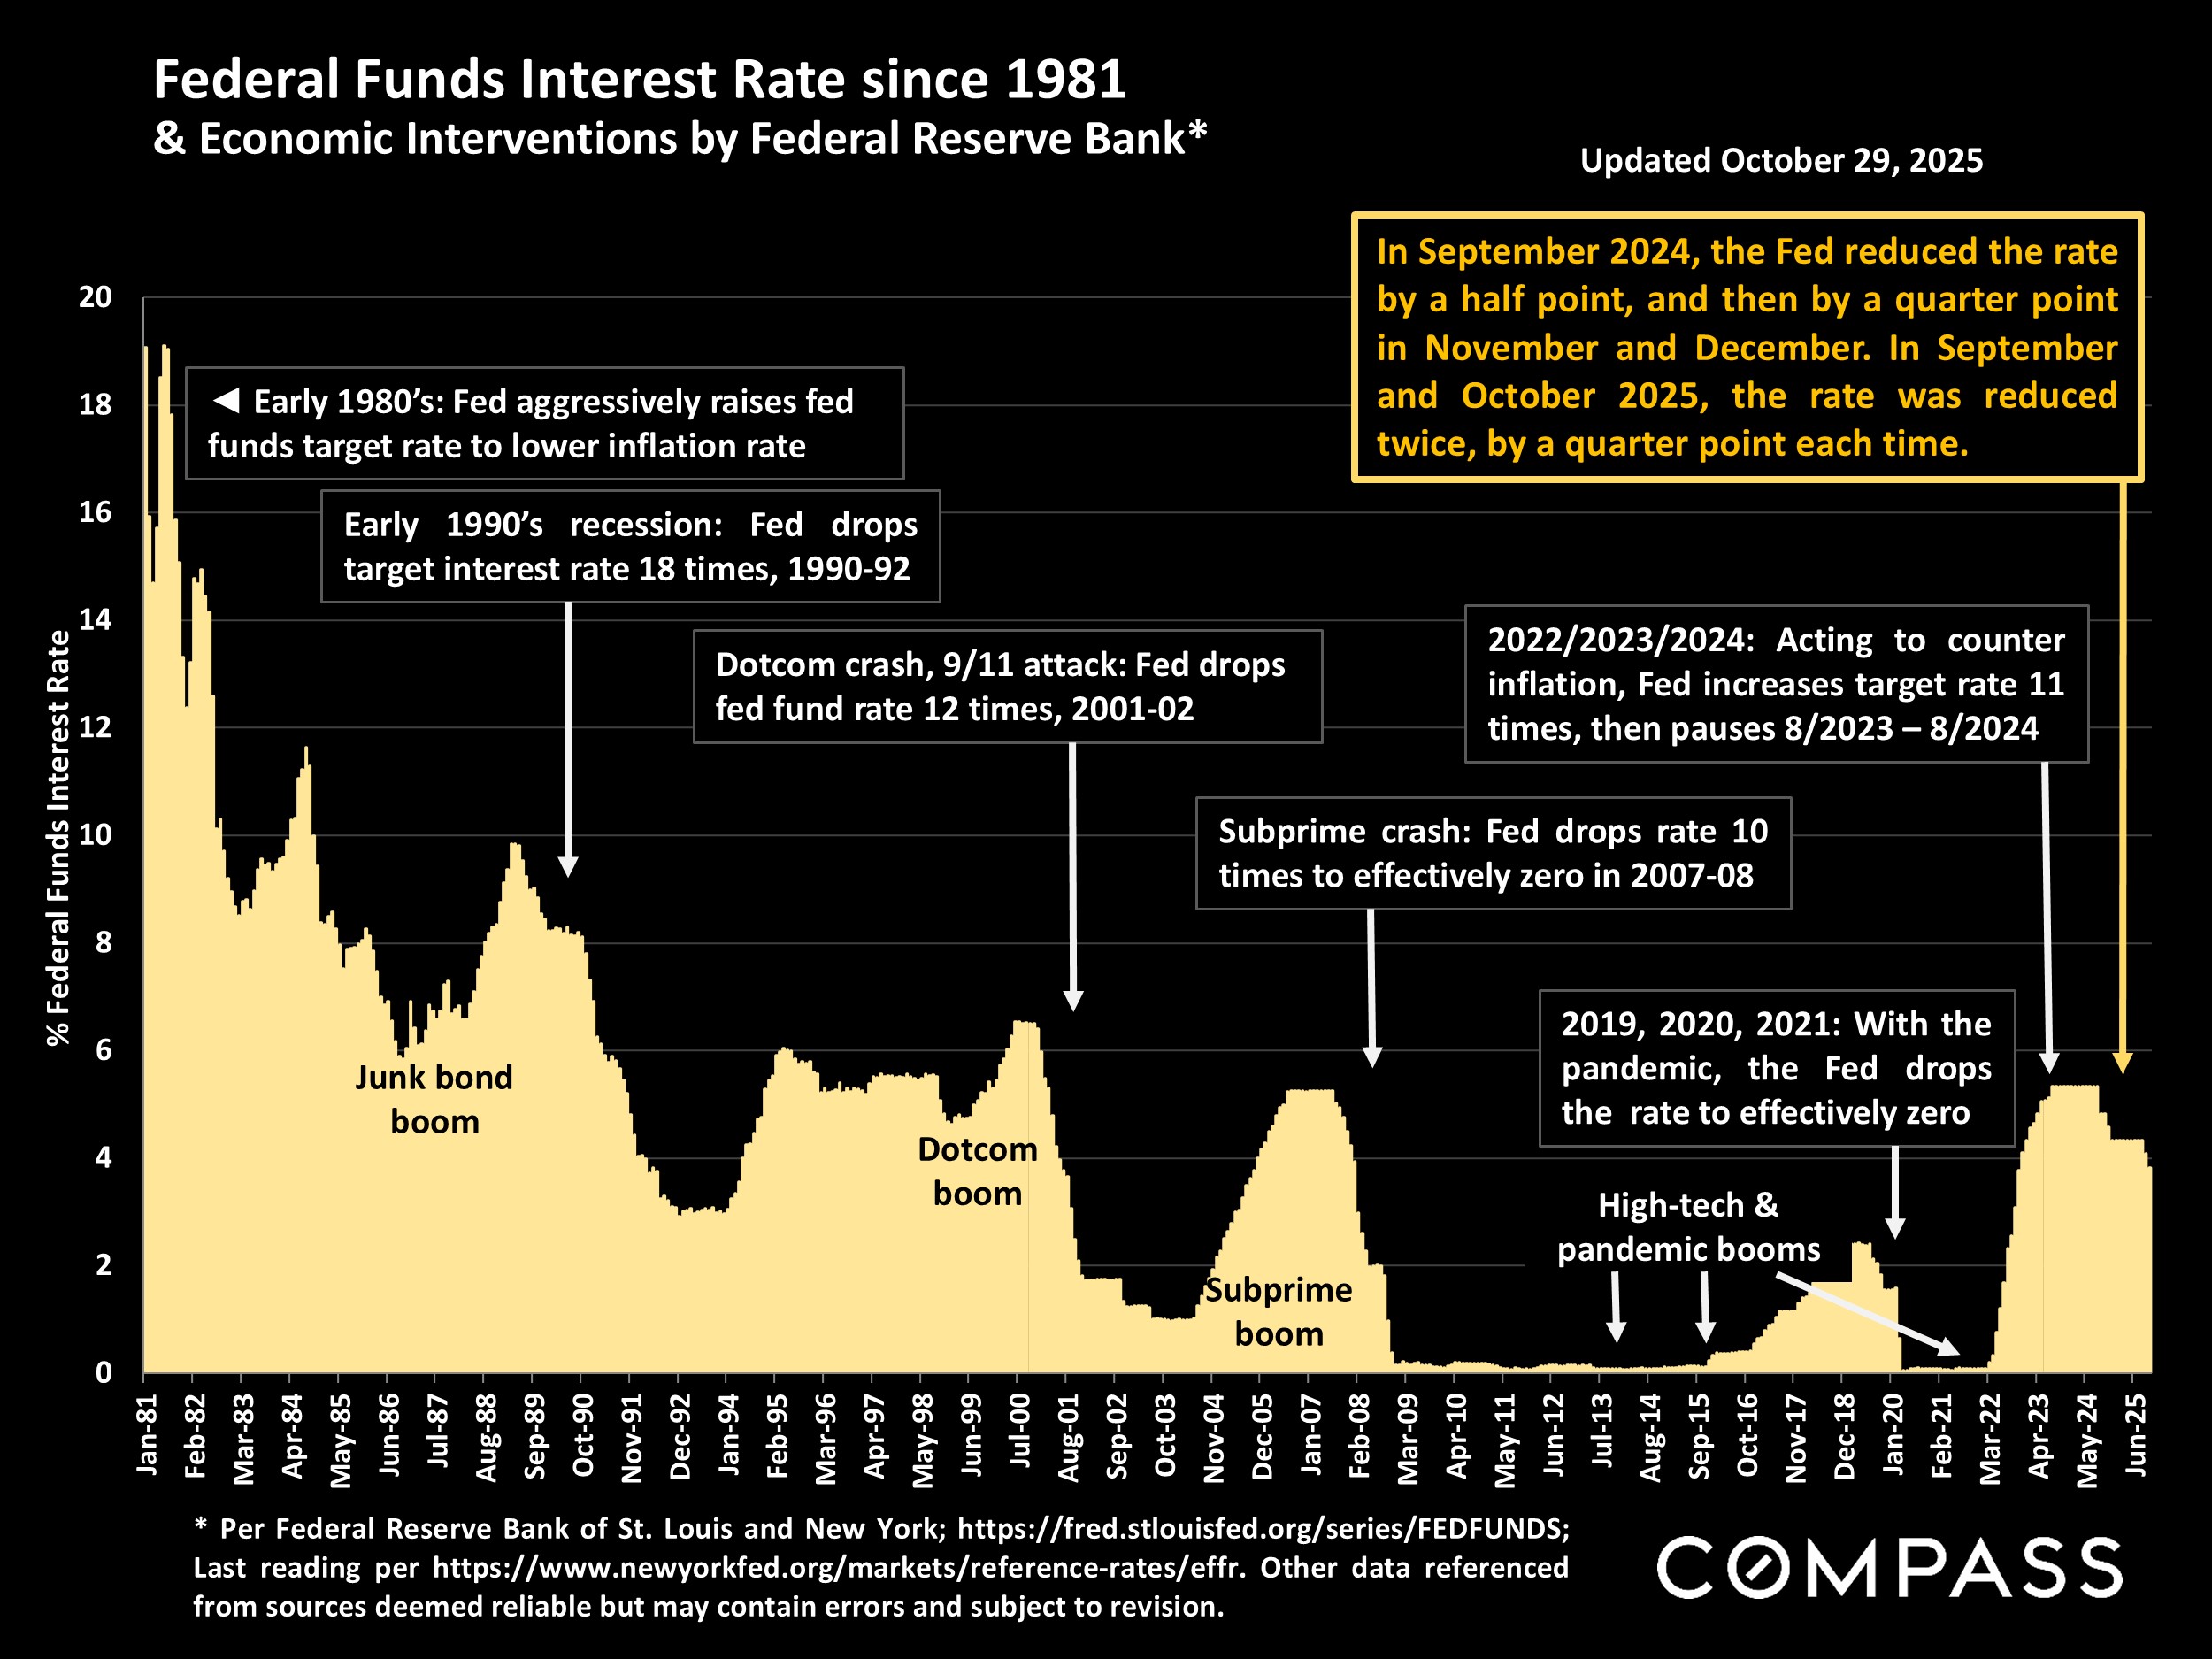
First, let’s recall that the music stopped in Spring, 2022, when the Fed started aggressively raising the Fed funds rate to cool economic activity and accelerating inflation after having kept interest rates near zero during the Covid Pandemic.

Fed funds rate since 1981
Fed Funds Rate

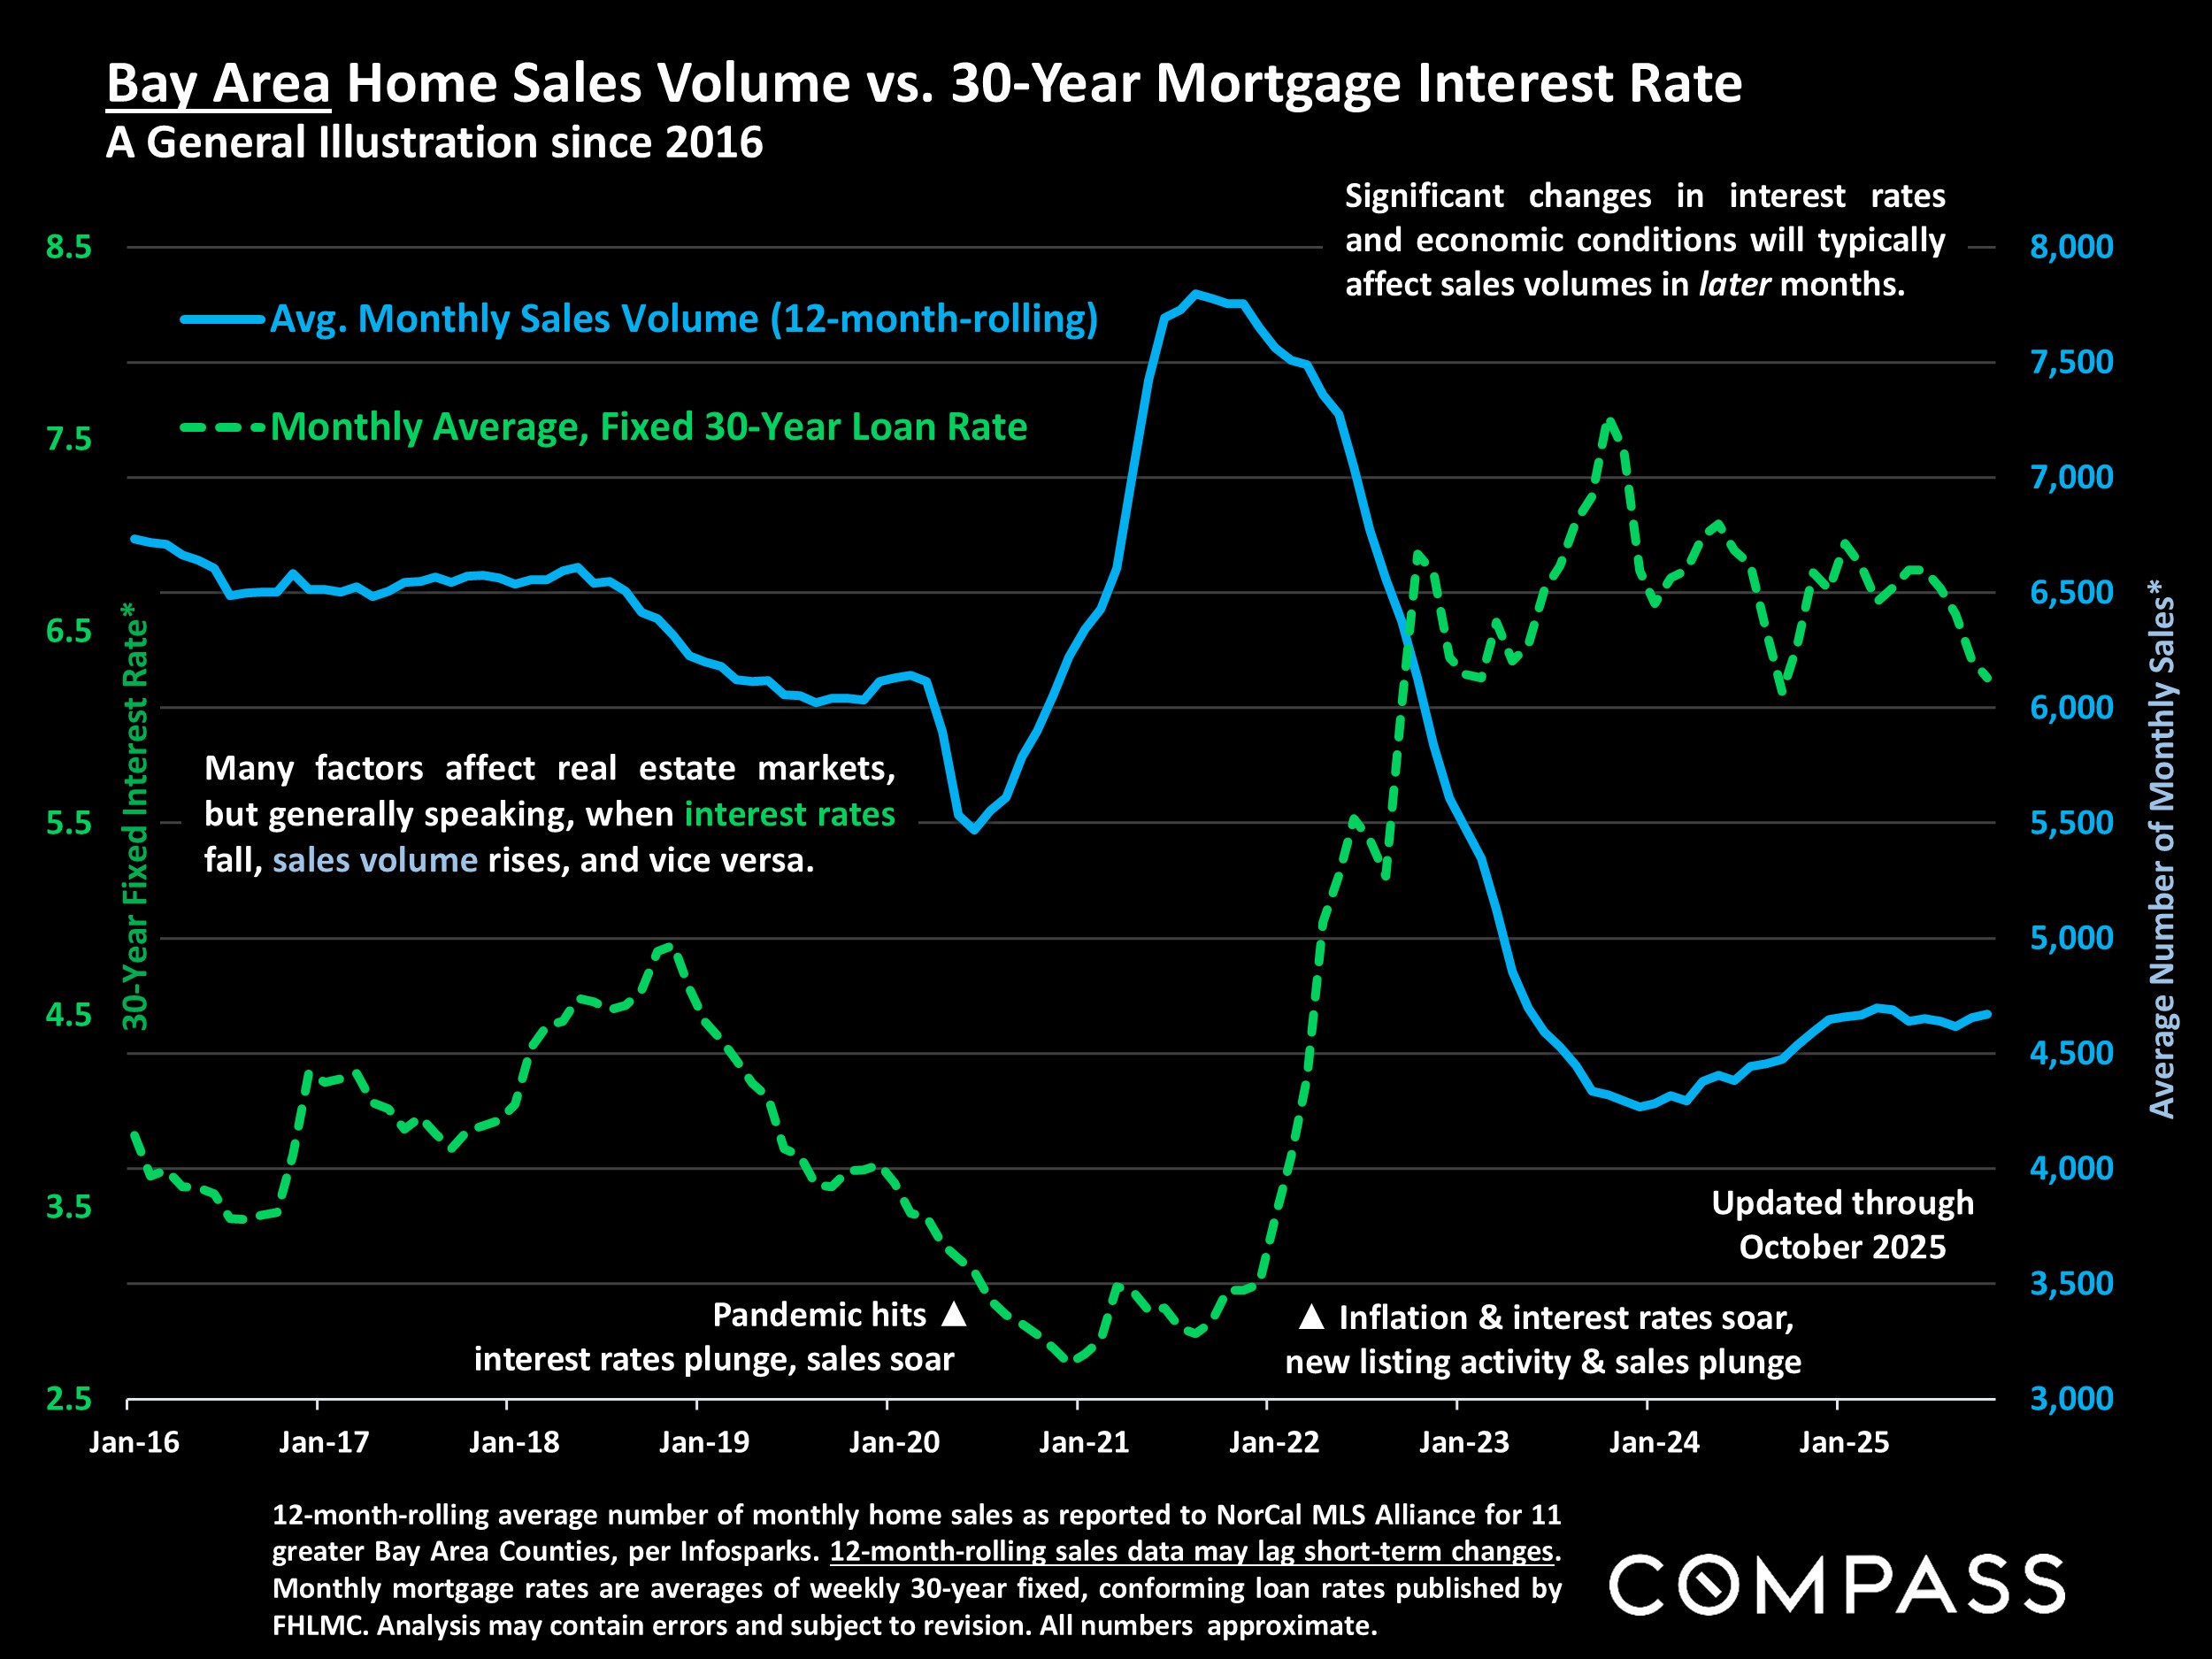
The resulting rise in mortgage rates correlates precisely with a massive slowdown in the Bay Area residential market  as we entered 2022 (chart below).

Mortgage Rates vs Bay Area Home Sales
Bay Area Sales volume vs Mortgage Rates

With that background in mind, many of our statistics are now at or approaching levels they had reached before that 2022 slowdown.  Continue reading “SF Real Estate Heats Up as the Weather Cools Down”

The San Francisco Residential Real Estate Update: An Ai Generated Glimmer of Hope?


AI generated imaged
An AI Generated Glimmer of Hope

Back in May 2018, when pundits everywhere delighted in sounding the death-knell for SF’s residential market due to a host of local challenges including lack of affordability and rampant homelessness, I suggested they might be a bit premature. In the summer of 2020, months into the Covid pandemic, Zillow published data suggesting that SF was again on the skids.  Again, I suggested that “this too shall pass.”  Condo and home prices proceeded to hit record highs until 2022 when higher interest rates brought the real estate party to a stop, leaving a hangover from which much of the Bay Area — indeed the country as a whole — has yet to recover.

Interest rates are still high, albeit with indications that they may be coming down “any day now.”  Add in such challenges as the economic uncertainty engendered by Trump’s tariff wars; an enduring change in the remote/on-site work model; and a persistent narrative of SF’s “doom loop” decline, and it’s fair to ask whether SF can once again pull off a Houdini-like escape. Continue reading “The San Francisco Residential Real Estate Update: An Ai Generated Glimmer of Hope?”