Winners and Losers: A Heat Map of San Francisco’s Neighborhoods

I’m back!  (More on this later….)

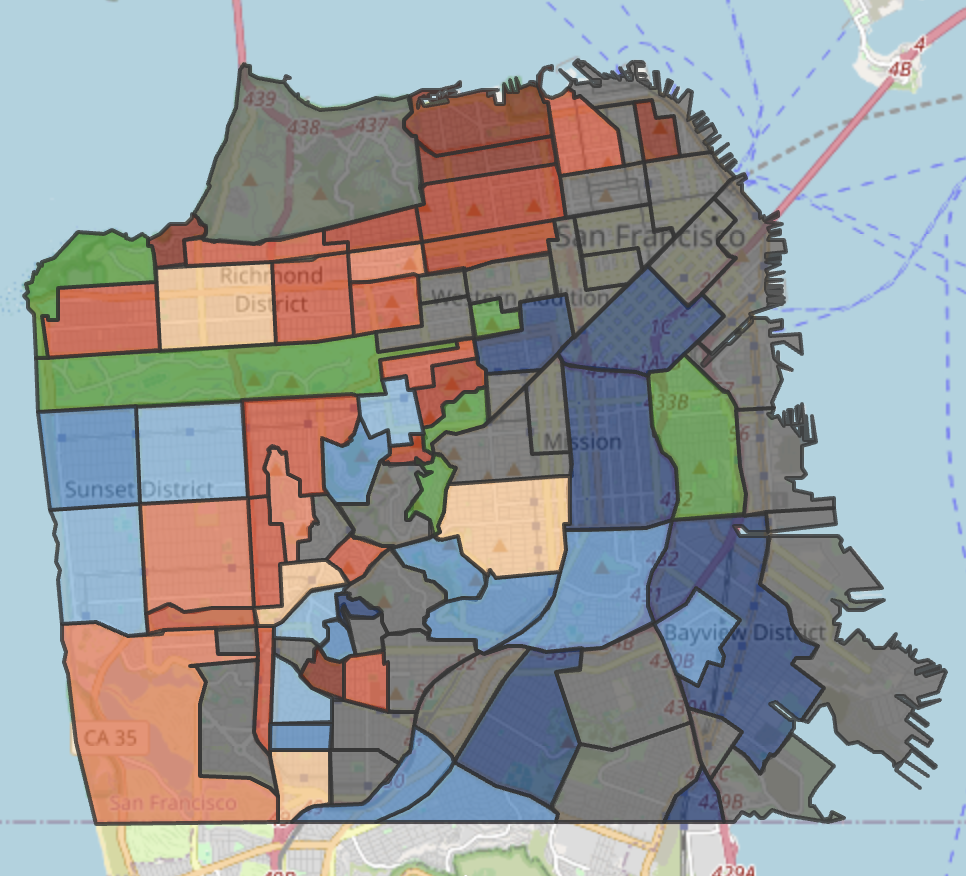
I’m so excited to present this heat map of San Francisco neighborhoods, which I believe may be the first of its kind.  I’ve been thinking about this idea for a while:  thank you Claude, and a shout-out to my son, too, who helped me bring the coding part of this project to fruition.

Be sure to click on the “fullscreen” button on the map below to expand it. We will get into the qualifications shortly, Continue reading “Winners and Losers: A Heat Map of San Francisco’s Neighborhoods”

SF Real Estate Heats Up as the Weather Cools Down

Generated with Claude.ai using a photo taken by Misha Weidman
Image Generated with Claude.ai

In my last post, I wrote that San Francisco’s residential market, fueled by the booming economics of local AI companies, was bucking the trend of most Bay Area counties by showing clear signs of strength while other counties stayed flat or faltered.  Recent data suggests that this trend could be accelerating.

In Contract, Pendings, Sales Volume All Up

First, let’s recall that the music stopped in Spring, 2022, when the Fed started aggressively raising the Fed funds rate to cool economic activity and accelerating inflation after having kept interest rates near zero during the Covid Pandemic.

Fed funds rate since 1981
Fed Funds Rate

The resulting rise in mortgage rates correlates precisely with a massive slowdown in the Bay Area residential market  as we entered 2022 (chart below).

Mortgage Rates vs Bay Area Home Sales
Bay Area Sales volume vs Mortgage Rates

With that background in mind, many of our statistics are now at or approaching levels they had reached before that 2022 slowdown.  Continue reading “SF Real Estate Heats Up as the Weather Cools Down”