SF’s Condo Market since COVID: Location Matters – Except When it Doesn’t


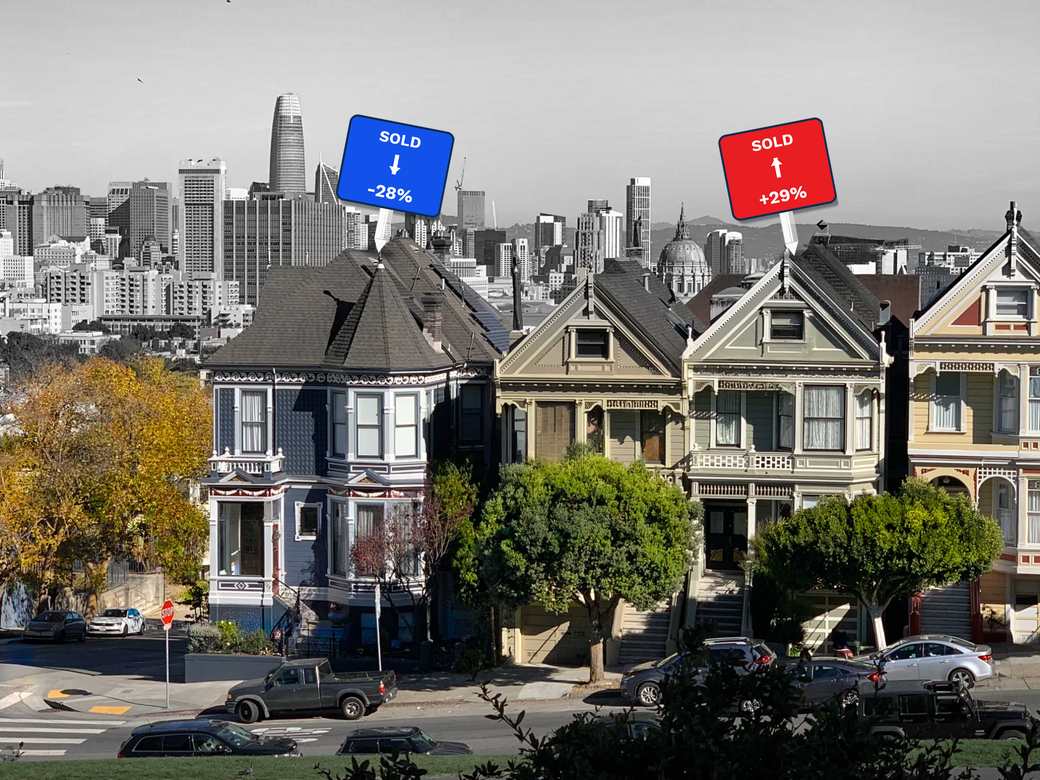
San Francisco Houses with different price signs
Original Photo taken and edited by Misha Weidman. For Sale signs added with ai.

Your correspondent has been hard at work wrestling with a database with nearly 40,000 sales going back to pre-pandemic January 2019. Full disclosure:  Claude has been my constant side-kick to analyze and deep-dive the data in ways I would never have been able to do before.  Conclusions and writing remain my own.

As promised in my last newsletter,  here’s a heatmap — actually two — comparing price changes in the condo market between the 6-month period right before the COVID pandemic lockdown in March 2020, and the 6-month period ending in mid-July 2026.  (Note these are best viewed on your computer screen, not a mobile device; click on the “full screen button” for the best experience.)

Why these two periods?  Because I wanted to see to what extent the city’s condo market has recovered from the  exodus that followed the COVID pandemic.  It’s well documented that the exodus hit the condominium market hard and the Downtown/SoMa area particularly hard. And there’s been lots of talk of “recovery.”  I’ll get to more recent trends in my next post but I wanted to start with a longer-term, city-wide view.  And for that, I thought a heatmap might provide a good visual guide to where we are in relation to where we were pre-COVID.

The first chart above compares median sales price for the two periods; the second compares median sales price per square foot.  At a glance, the Sales Price Heatmap simply reveals much more color variation, with a mix of up (red) and down (blue) subdistricts.  This is especially so in the Downtown/SoMa area that’s outlined in navy blue. Continue reading “SF’s Condo Market since COVID: Location Matters – Except When it Doesn’t”
SF Real Estate Heats Up as the Weather Cools Down

Generated with Claude.ai using a photo taken by Misha Weidman
Image Generated with Claude.ai

In my last post, I wrote that San Francisco’s residential market, fueled by the booming economics of local AI companies, was bucking the trend of most Bay Area counties by showing clear signs of strength while other counties stayed flat or faltered.  Recent data suggests that this trend could be accelerating.

In Contract, Pendings, Sales Volume All Up

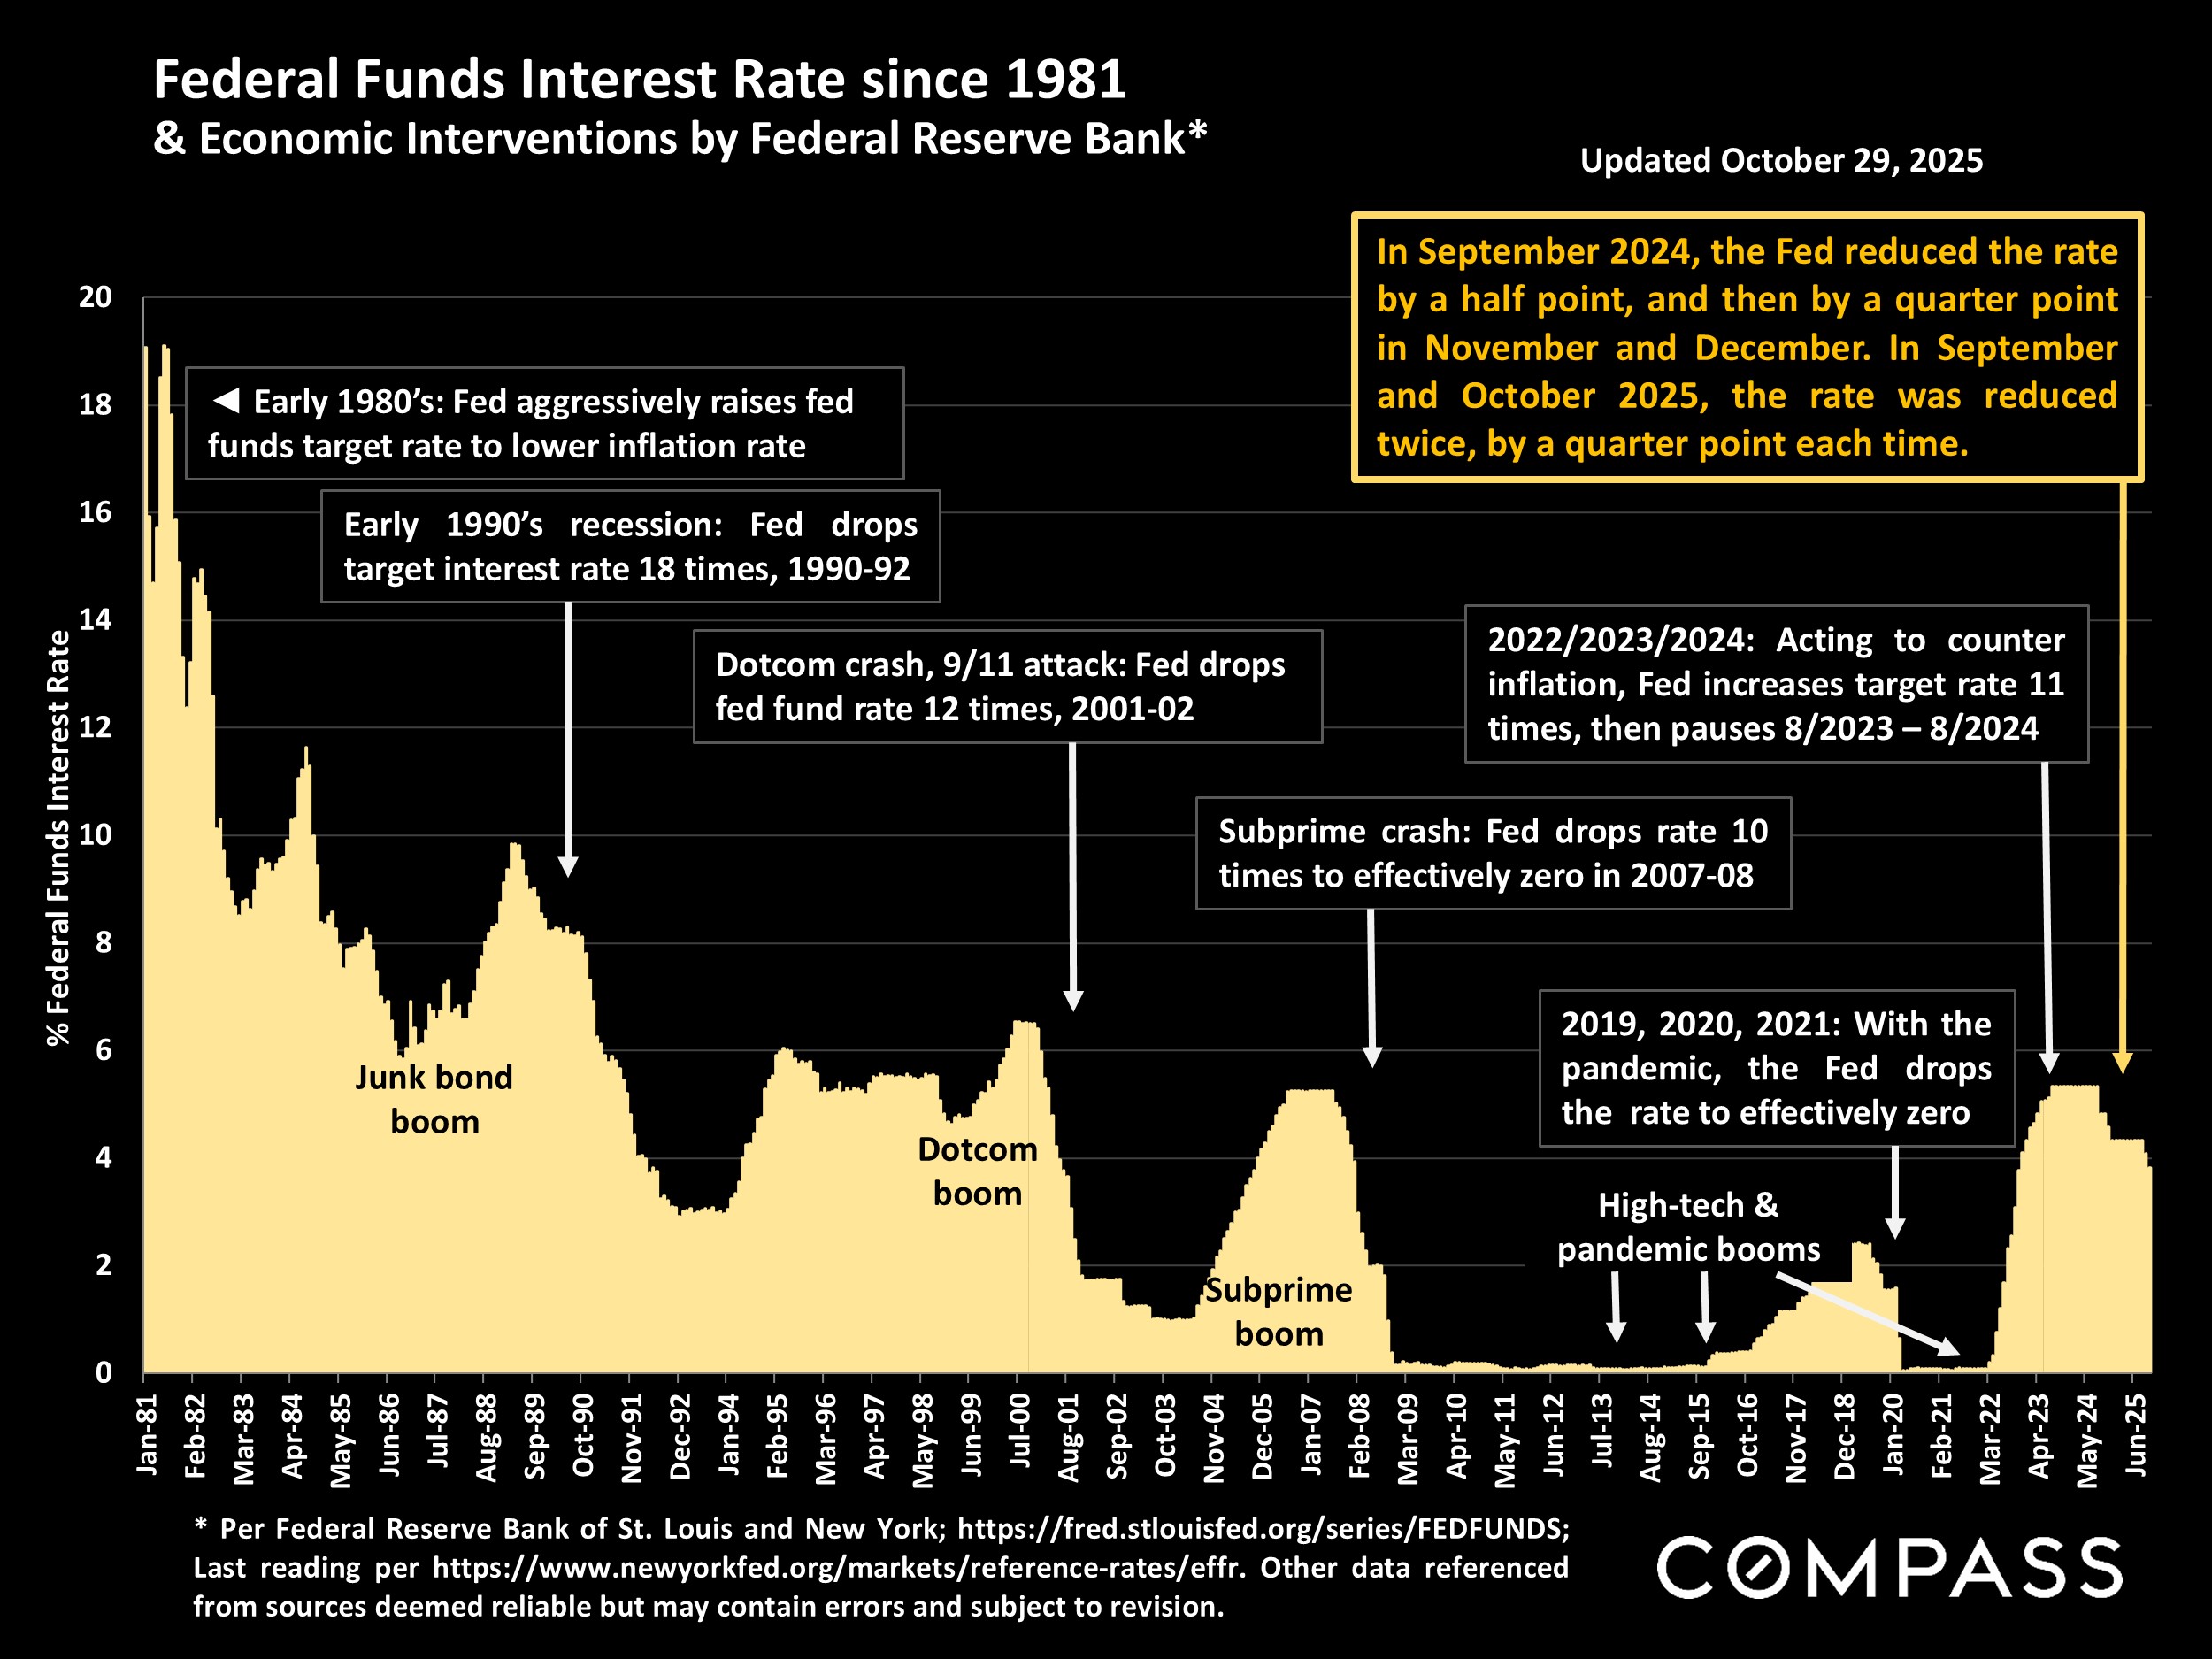
First, let’s recall that the music stopped in Spring, 2022, when the Fed started aggressively raising the Fed funds rate to cool economic activity and accelerating inflation after having kept interest rates near zero during the Covid Pandemic.

Fed funds rate since 1981
Fed Funds Rate

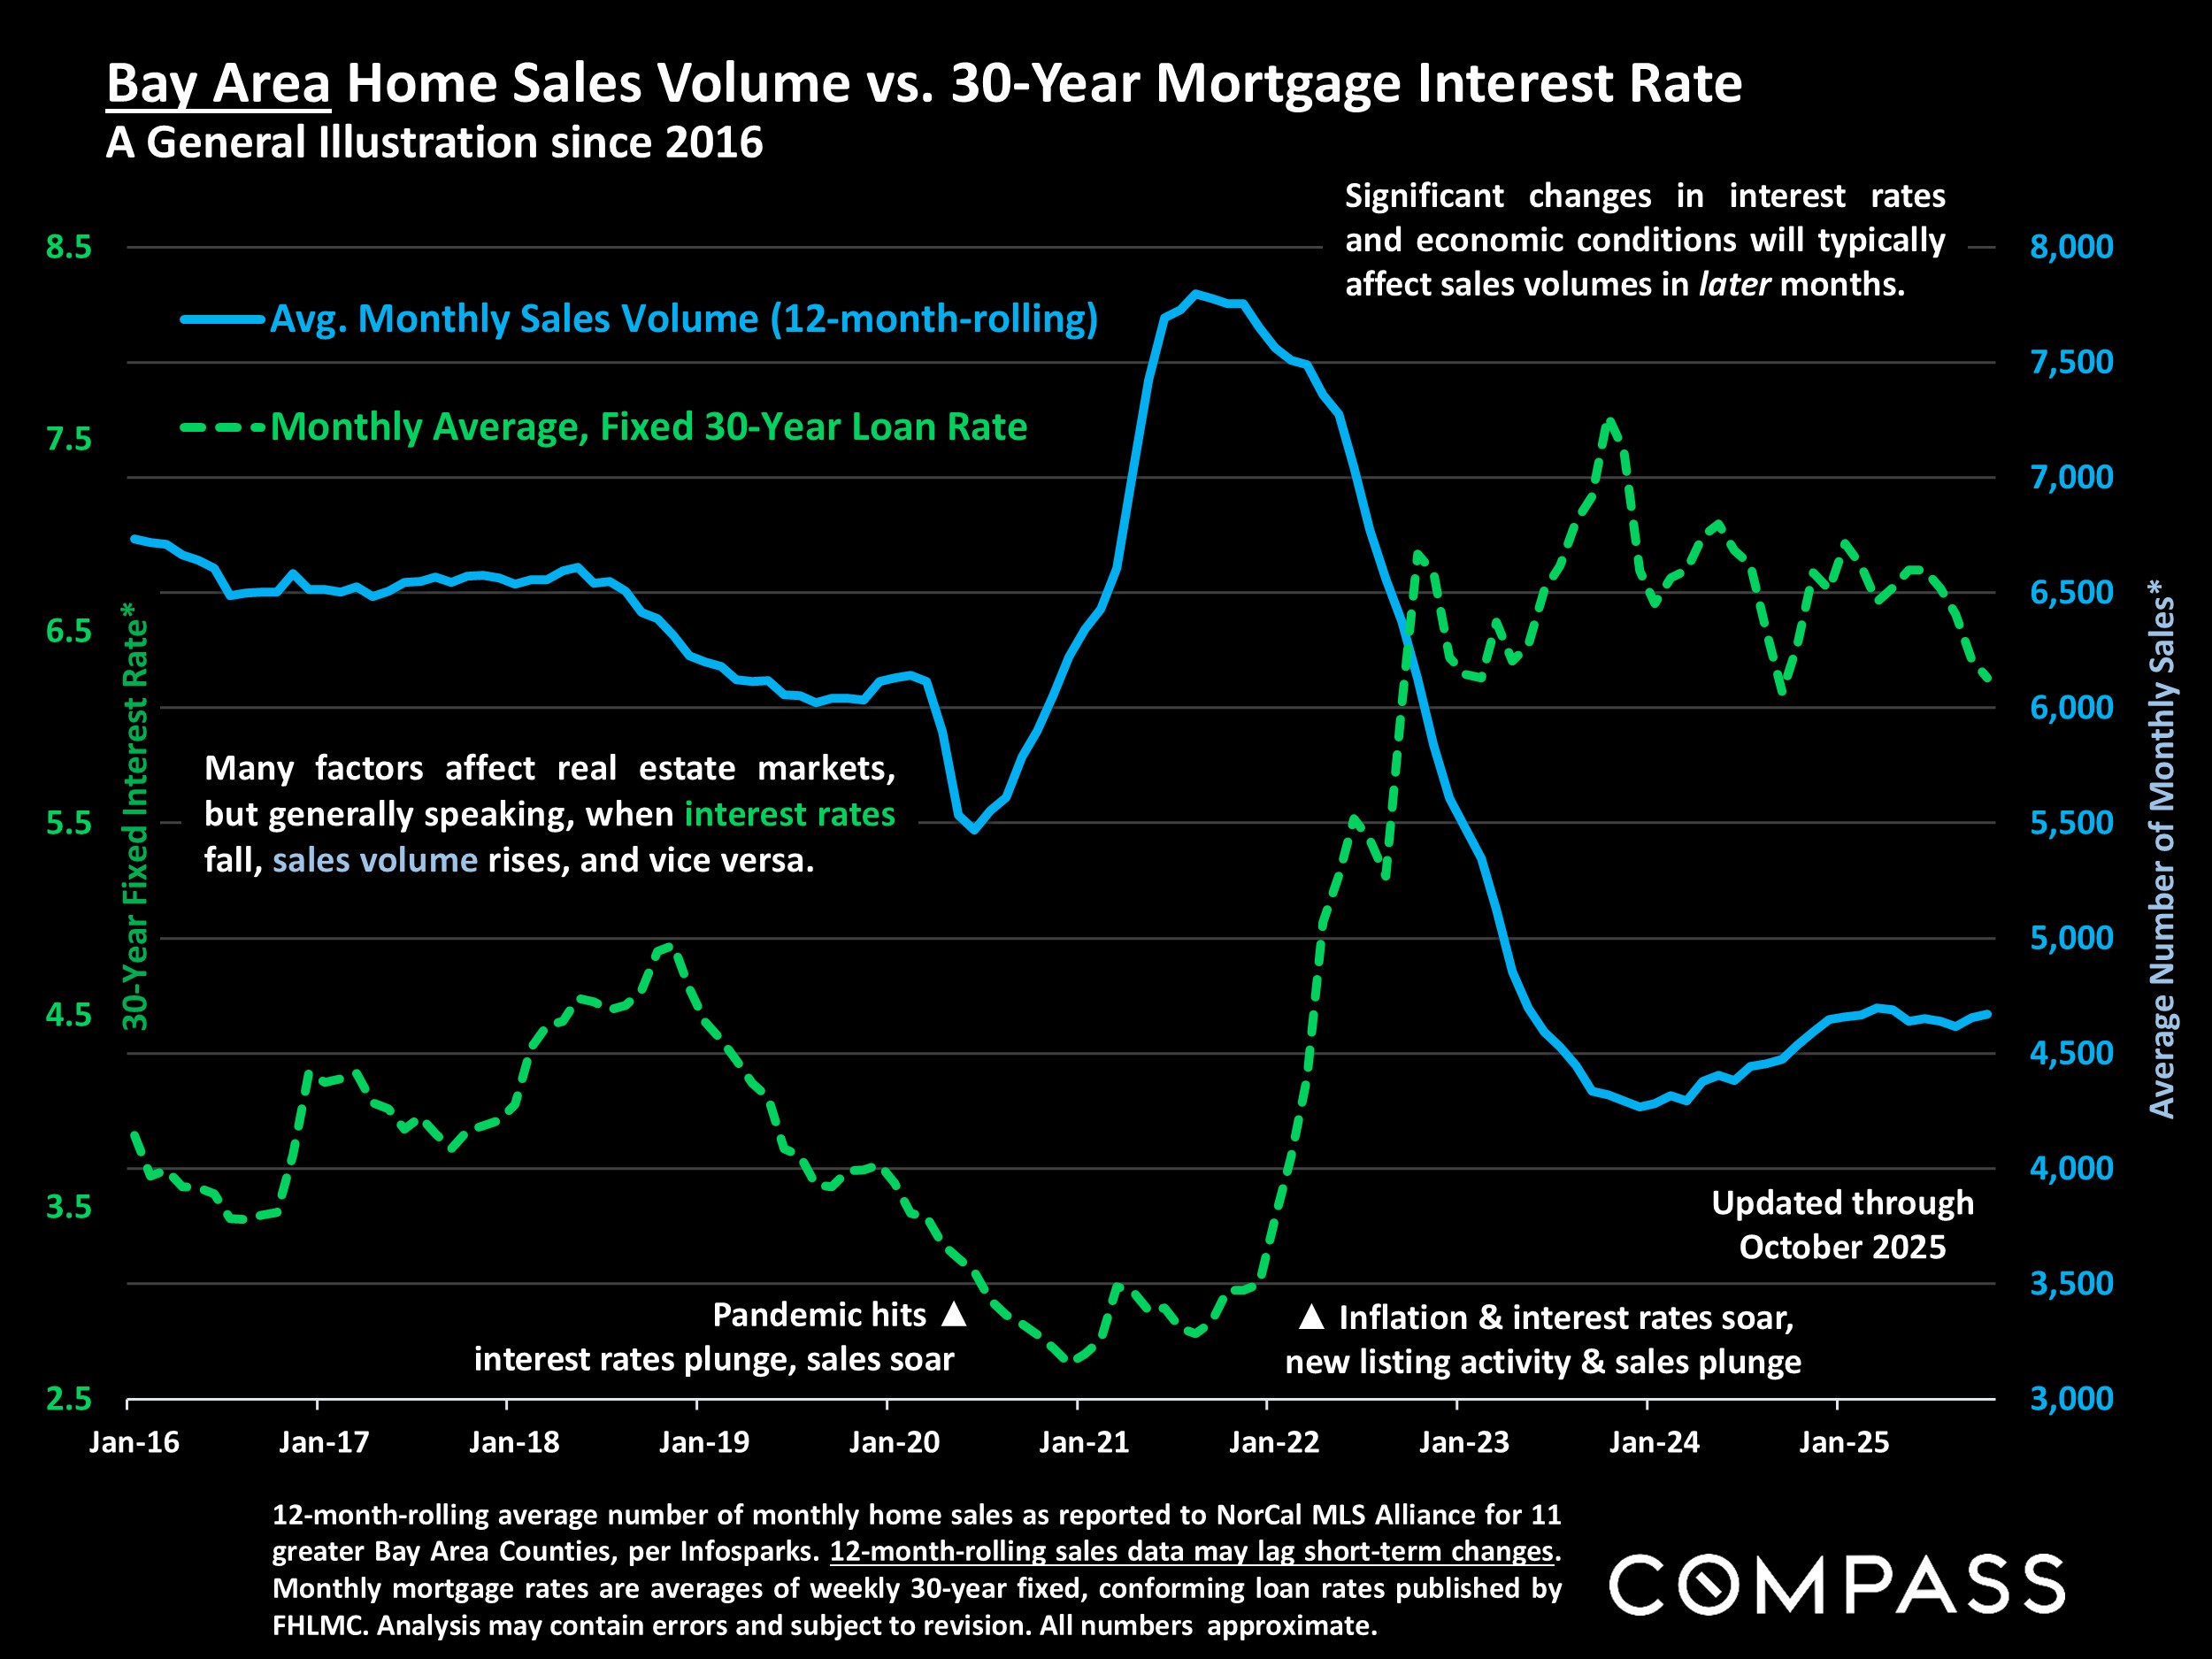
The resulting rise in mortgage rates correlates precisely with a massive slowdown in the Bay Area residential market  as we entered 2022 (chart below).

Mortgage Rates vs Bay Area Home Sales
Bay Area Sales volume vs Mortgage Rates

With that background in mind, many of our statistics are now at or approaching levels they had reached before that 2022 slowdown.  Continue reading “SF Real Estate Heats Up as the Weather Cools Down”

235 Berry Street #112 | “Just Sold”: Listed $1.45, Sold $1.6

235 Berry Street #112

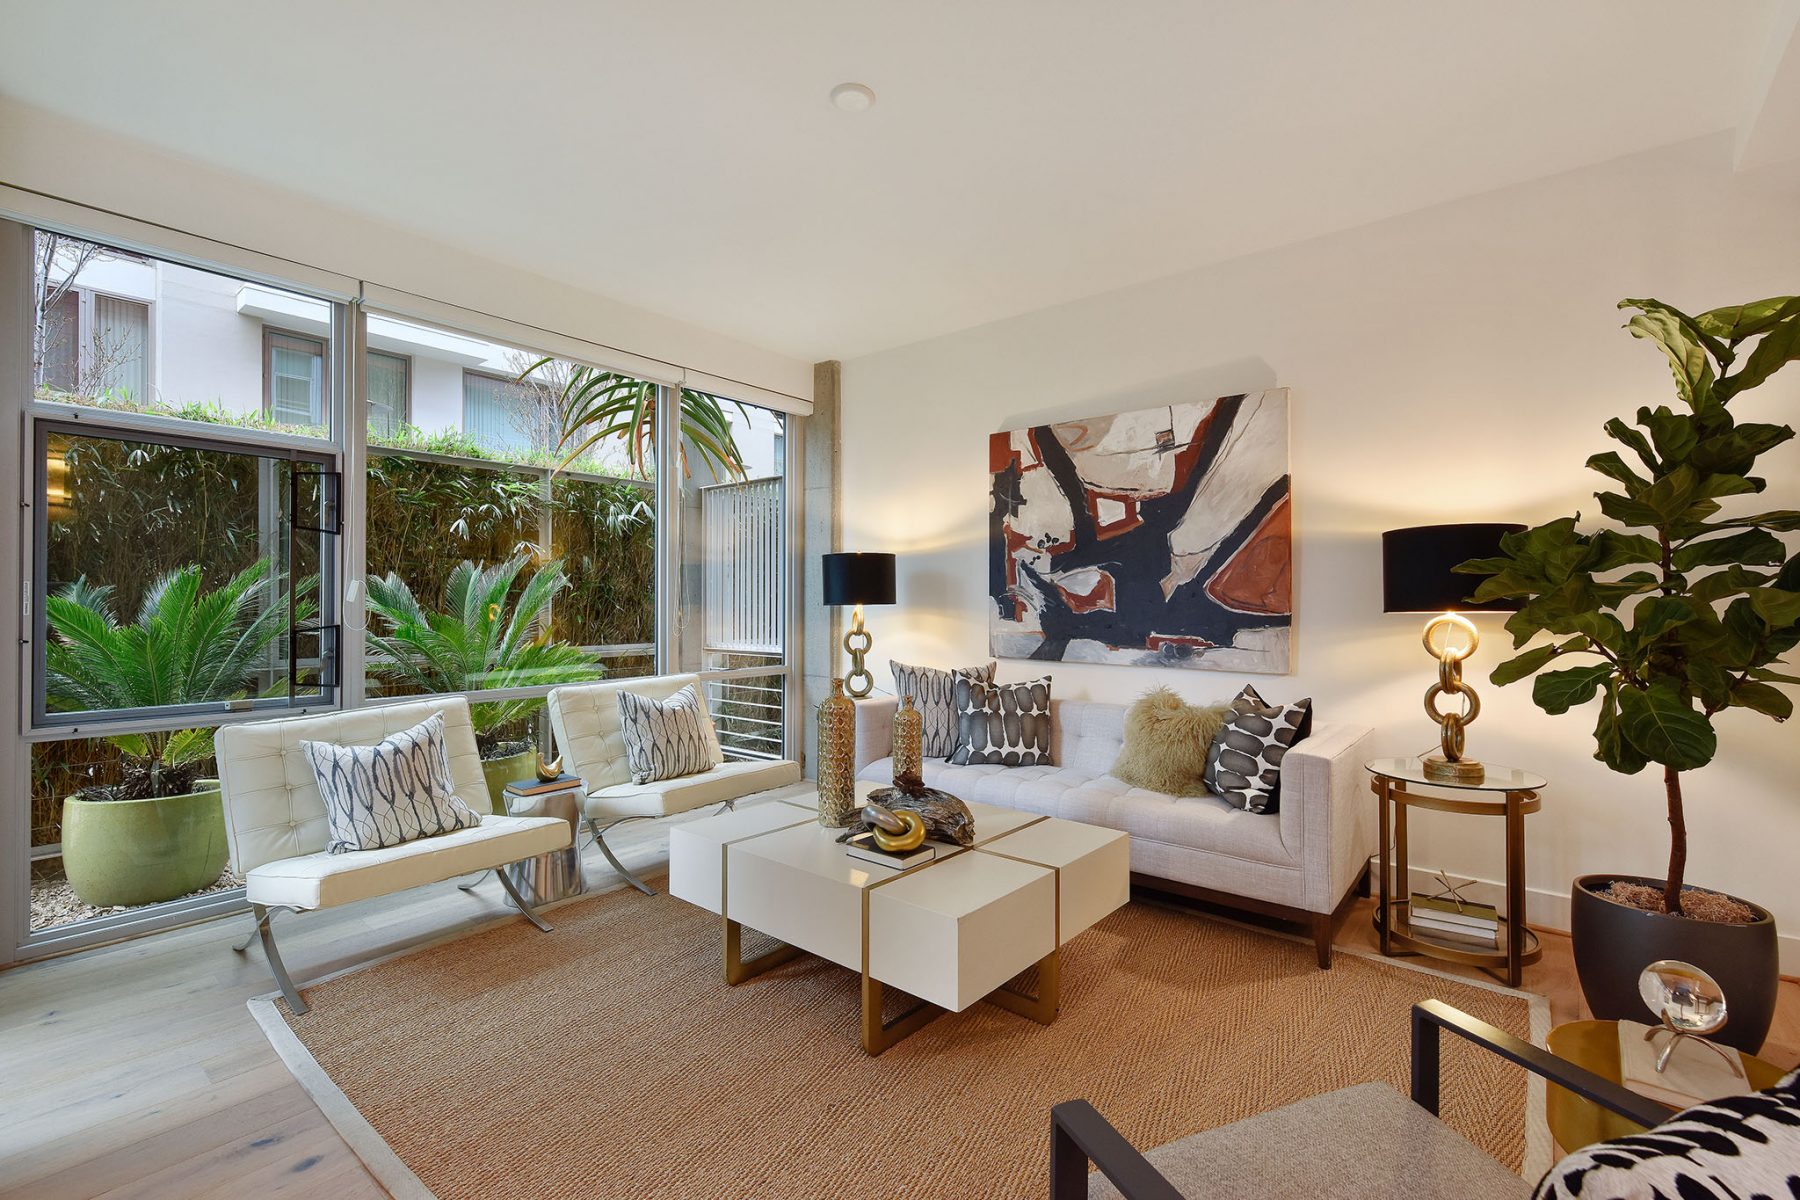
Exceptional Mission Bay Town-Home

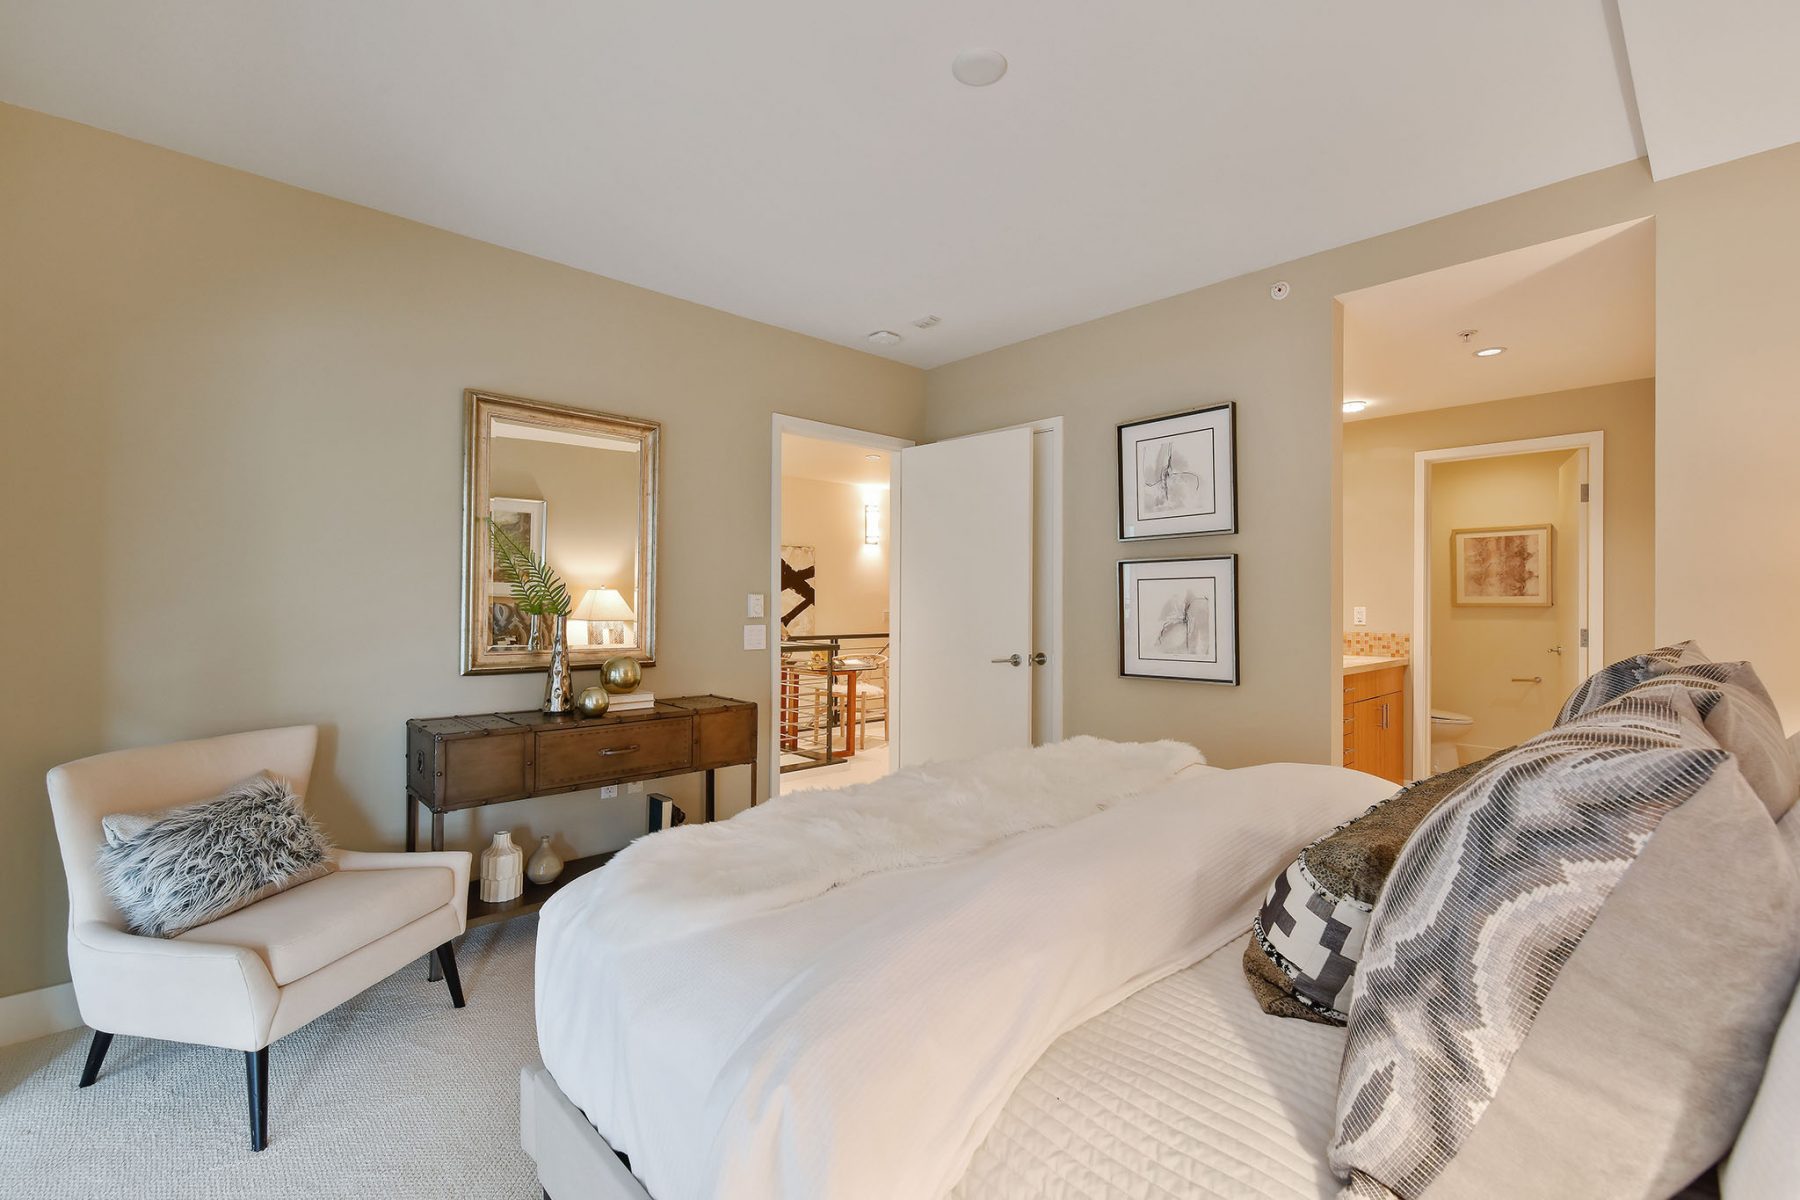
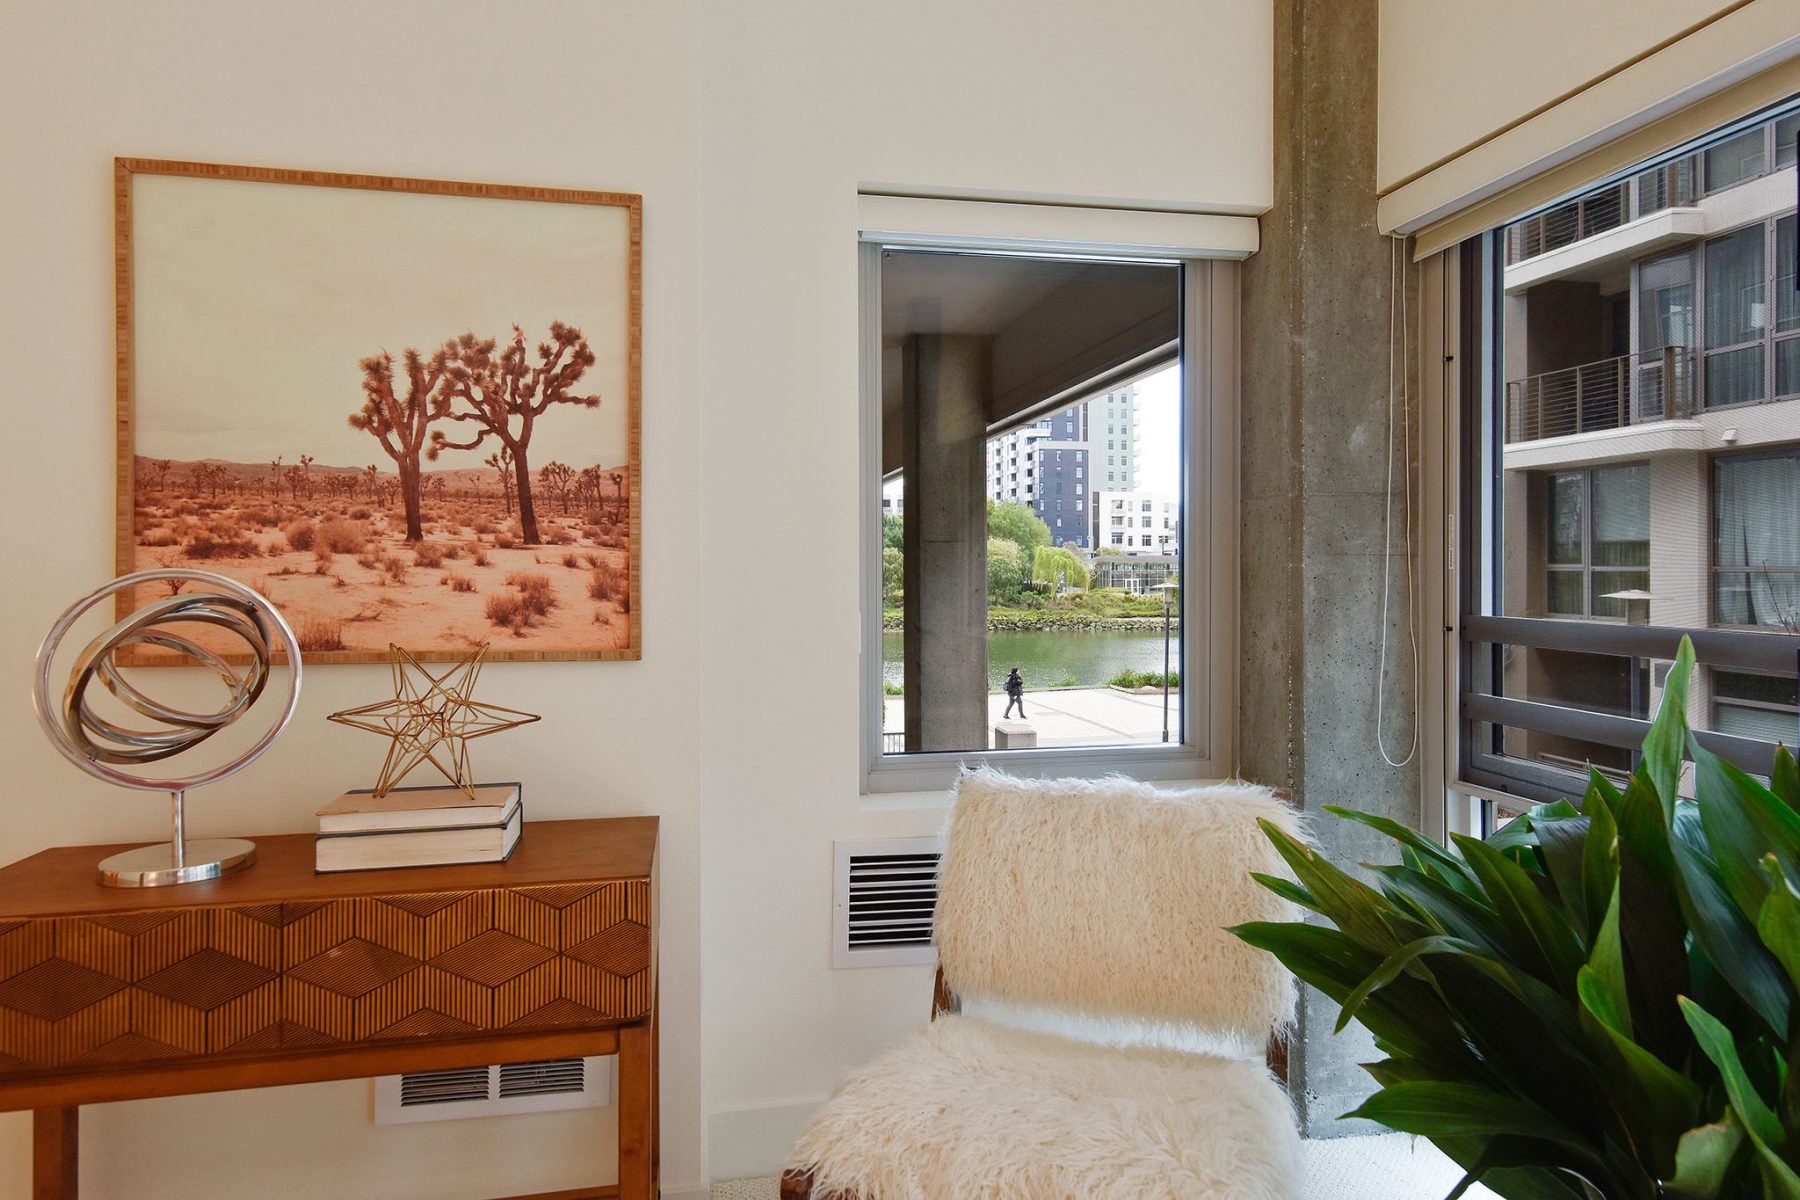
Come take a look at this rare and fabulous 2BR/2.5 BA town-home before it “goes live” on MLS! Enter through your private south-facing gated patio right off the quiet walkway that runs between Berry Street and the Mission Creek Esplanade. On the main level, you’ll find new broad-plank, natural finish engineered wood floors. Bright new w/w carpet upstairs. Freshly painted throughout. Custom closets in the both bedrooms and peek-a-boo views of the creek from the second bedroom. Plus full-sized, in-unit W/D; extra closet space; and a convenient assigned parking space located near the unit.

Enjoy all the pleasures of one of SF’s newest, most thriving, and commuter-friendly neighborhoods. Walk your dog along the Esplanade. Get your coffee at Phil’s. Shop at Guss’s market. Imbibe some of the best weather SF has to offer and cosy up to Giants and Warriors!

“Just Sold”: Listed $1.45, Sold $1.6

Please visit: 235berry-unit-112.com

SF Ranked Top City For Trick-or-Treating

1For the third consecutive year, San Francisco takes the prize as Zillow’s top US city for trick-or-treating. To help identify locations that could potentially dish out the most candy and present the least amount of safety and walking concerns, Zillow determines their rankings based on four categories of equal value: the Zillow Home Value Index, population density, Walk Score, and local crime data from Relocation Essentials.

Other California cities that land in the top 20 are San Jose (#4) and Los Angeles (#6) each moving up a spot from last year, as well as San Diego (#12).

Curious which part of town takes the crown? Zillow also includes in their rankings the top five neighborhoods per city. San Francisco’s may surprise you:
#5- Glen Park
#4- Presidio Heights
#3- Cow Hollow
#2- Sea Cliff
#1- Noe Valley

Zillow’s ranking is, of course, just one way of looking at it. We’ve gotten feedback that lists Cole Valley, St. Francis Wood, and West Portal as tried and true. We’d love to hear more – chime in with your pick!

Online Resources: All Things San Francisco

Online Resources for San Francisco Home Buyers

Schools & City Services

Legal Resources

  • Legal Articles: TICs, Condos, Landlord-Tenant
  • More Legal Articles

About San Francisco