What Costs How Much Where in San Francisco

San Francisco Home Values
By Neighborhood, Property Type & Bedroom Count

MLS Sales February 1, 2012 – mid-August 2012

The charts below apply to non-distressed home sales with at least 1 car parking. Distressed home sales — bank-owned property and short sales — typically sell at a discount, but as the market recovers the number of such listings is rapidly declining.

If a price is followed by a “k” it references thousands of dollars; if followed by an “m”, it signifies millions; “N/A” means that there was not enough data to generate a reliable statistic. Where abnormal “outlier” sales were identified that significantly distorted the statistics, these were deleted from the calculations. Within each chart, the neighborhoods are sorted by median sales price, highest to lowest.

Very generally speaking and varying widely by city neighborhood, thus far in 2012, San Francisco home prices have increased by 5% to 15% over 2011 values.

Trends in Dollar per Square Foot Values for Non-Distressed Houses
in Selected San Francisco Neighborhoods

2012 Numbers reflect 2nd Quarter Sales Only


Trends in Median Sales Prices for Non-Distressed 2-Bedroom Condos
in Selected SF Neighborhoods

2012 Numbers reflect 2nd Quarter Sales Only

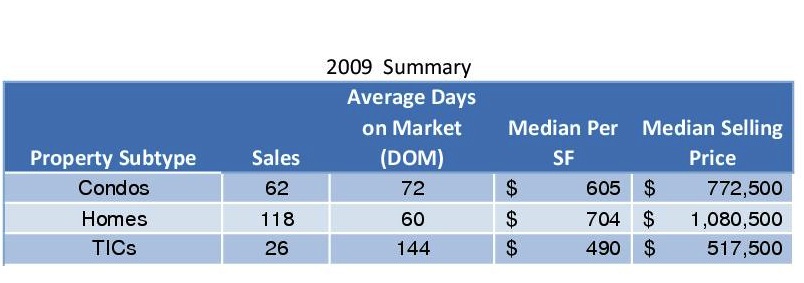
The MEDIAN SALES PRICE is that price at which half the properties sold for more and half for less. If there were 3 sales, at $1, $2 and $10, the median price would be $2. If there were 4 sales at $2, $2, $5 and $10, the median would be $3.50. Median sales price may be affected by seasonal trends, and by changes in inventory or buying trends, as well as by changes in value.

AVERAGE DOLLAR PER SQUARE FOOT is based upon the home’s interior living space and does not include garages, storage, unfinished attics and basements; rooms and apartments built without permit; decks, patios or yards. These figures are typically derived from appraisals or tax records, but can be unreliable, measured in different ways, or unreported altogether: thus consider square footage and $/sq.ft. figures to be very general approximations. Generally speaking, about 60-80% of listings report square footage, and dollar per square foot statistics are based solely on those listings. All things being equal, a house will have a higher dollar per square foot than a condo (because of land value), a condo will have a higher $/sq.ft. than a TIC (quality of title), and a TIC’s will be higher than a multi-unit building’s (quality of use). All things being equal, a smaller home will have a higher $/sq.ft. than a larger one. The highest dollar per square foot values in San Francisco are typically found in upper floor condos in prestige buildings with utterly spectacular views.

The AVERAGE SIZE of homes of the same bedroom count may vary widely by neighborhood: for example, the average size of a 4-bedroom house in Pacific Heights is much larger than one in Noe Valley; and the average of a Marina 2-bedroom condo is larger than one in South Beach. Besides the affluence factor, the era and style of construction often play large roles in these disparities.

Some neighborhoods are well known for having additional ROOMS BUILT WITHOUT PERMIT, such as the classic 1940′s Sunset house with “bedrooms” and baths built out behind the garage. These additions often add value, but being unpermitted are not reflected in $/sq.ft. figures.

Many aspects of value cannot be adequately reflected in general statistics: curb appeal, age, condition, views, amenities, outdoor space, “bonus” rooms, parking, quality of location within the neighborhood, and so forth. Thus, how these statistics apply to any particular home is unknown.

San Francisco Market is Stuck

July 2012 Market Update

If you wish, you may jump straight to the market charts.

The SF real estate market is stuck. Stuck in high gear: huge buyer demand + the lowest interest rates in history + extremely low inventory of listings = (often ferocious) competitive bidding and increasing prices. Though this trend began in the city’s more affluent areas, it has now spread to virtually every neighborhood, property type and price segment. Since closed sales activity follows the time of offer acceptance by 4 to 8 weeks, the appreciation in home values has not yet shown up in the statistics for certain neighborhoods. We believe it will soon.

Though this situation is to the advantage of sellers (after years of market doldrums), homebuyers might take some consolation in the fact that the last time the market dramatically shifted after a similar downturn, in 1996 after the early nineties recession, there was a market frenzy much like ours today. However, people who bought at that time still ended up doing very well by getting in at the beginning of a market rebound that went on for many years, even before the housing-bubble years began. And interest rates then were close to double today’s.

When reviewing the map analyses below, remember that median and average statistics are generalities, and how they apply to any specific property is unknown. Percentage changes should be taken with a grain of salt: some neighborhoods have relatively small numbers of sales, which make statistics less reliable; in other areas, it may simply be that the size/quality mix of homes sold shifted from one period to the other — this happens. Still, overall, it is clear that the city is experiencing a general surge in home values.

Explanations for the statistics referenced can be found on the Paragon website: Statistical Definitions

————————————————-

SF Median House Prices and Appreciation

Many of the city’s neighborhoods are showing significant increases in the house median sales price, and this appears to be accelerating as we get deeper into the year. Those areas not yet showing significant change are expected to show increases in the next quarter’s statistics.


Median Condo Prices and Appreciation
Many neighborhoods are showing significant increases in the condo median sales price, and this appears to be accelerating. (However, as an example of how statistics are not 100% reliable, the chart shows no appreciation for Pacific and Presidio Heights condos over the past year: we believe there was indeed significant appreciation on par with most other nearby affluent areas, but the statistic is reflecting other factors, such as different inventories for sale during the two periods being compared.)


Average Dollar per Square Foot
Average dollar per square foot has been increasing in 2012, and this appears to be accelerating.


San Francisco Dollar Volume Sales
Two factors affect dollar volume: the number of sales and the average sales price. In 2012 both of these statistics have been jumping in the city.


SF Unit Home Sales
The number of sales reported to MLS has jumped to its highest number in over 4 years. However, there are two additional factors: new-development condo sales which are often not reported to MLS are lower than in many previous years due to the crash in building after 2008 (though this is turning around too). On the other hand, it appears that the number of “off-market” sales, not listed in or reported to MLS, has surged in 2012.


Home Sales by Property Type
Houses and condos make up the great majority of sales in San Francisco, though TIC sales seem to be making a big recovery in the low-inventory situation the city has found itself in.


Home Sales by Price Range
As the market has heated up, prices have risen and distressed home listings have plunged. This is causing something of a shift upward in the percentage of sales in the higher price segments.


Average Sales Price: Short Term Trend
Average sales price and median sales price are different statistics, but they’re both showing the same trend in San Francisco.


Price Reductions, Sales Price to List Price Percentage & Days on Market
Houses selling without a price reduction are growing as a percentage of sales. They are averaging well over the asking price and selling in the shortest time period in years.


SF Luxury Home Sales
Homes selling for over $1,500,000 hit their highest level in years in the second quarter of 2012.


2-Bedroom Condo Prices: Long-Term Trends
These neighborhoods have all been showing significant price appreciation since the home-price crash in 2008-2009. If this chart went back to 1995, it would show that median prices pretty much doubled between 1995 and 2000.


Expired and Withdrawn Listings
As the market gets hotter, fewer listings expire without selling. Right now,the percentage of expired and withdrawn listings is incredibly low.


Percentage of Listings Accepting Offers
The stronger the buyer demand and the lower the inventory, the higher the percentage of listings accepting offers. Every San Francisco property type is at its highest percentage in many years, and perhaps its highest ever.

2010 San Francisco Residential Wrap-Up: Why condo owners may not be celebrating.

Given the amount of bad news coming out of the housing market these days, you’d think that San Francisco condo and TIC owners would be celebrating the fact that values increased 4.5% in 2010.

If no one feels like popping corks, it may be because prices have been stuck in a narrow range since they hit their post-bubble bottom two years ago.  Take a look (click to enlarge):

Continue reading “2010 San Francisco Residential Wrap-Up: Why condo owners may not be celebrating.”

Noe Valley: The Condo/TIC market

At long last, here’s the promised data on Noe Valley condos and TIC’s.

First, a look back (in anger?) at the make-up of Noe Valley sales in 2009.

Note that there were more than twice as many condos sold as TICs, and more homes sold than condos and TICs put together. (What’s a TIC?  — Check out my series of posts on Tenancy-In-Common Interests, starting here.)

Also, that absurdly long DOM for TICs was distorted by 3 TICs at 201 Hoffman that took 410 days to sell.  Still, without those sales, DOM for TICs (tired of the acronyms yet?) was still 99 days.  And I’d be somewhat skeptical of the whopping difference in price between TICs and condos as well:  TICs sales often don’t have a price per square foot listed, so there are very few data points — and there are very few sales to begin with.

Here’s how condos and TICs have been doing as a combined group, versus their all-time highs.

That precipitous plunge (actually a huge increase since the scale is reversed) in DOM at the end of 2009 was also due to the lingering effects of 201 Hoffman.

For a shorter term view, prices through February 2010 are up 11% from January 2009 and are up a whopping 31% from the trough of June 2009.  Since I use trailing 3 month averages, I think this is a belated reflection of the deep credit freeze of Spring 2009 when we thought the world might come to an end.

And here’s how condos and TICs stacked up against homes.

For what it’s worth, it feels like spring has really sprung.  Nice-looking condos/tics are swarming with people and are moving fast — no kidding.  Whether it will last is anybody’s guess.

Looking Back at 2009: Condos/TICs

Pretty much everything I said about how single family homes fared in 2009 also applies to the condo/TIC market.   (TIC’s, aka Tenancy In Commons are similar to condos.  For more information on TICs, see my three-part series starting here.)

Condo/TICs hit their all-time highs about a year later than homes did — in July 2008.  But they’ve fallen from their highs almost exactly as much as homes have.  Condos/TICs were down 17%, just one percent better than single family homes.

For those who prefer their data on a per square foot basis, the picture is pretty much the same.  The all-time high was $711 — reached in November 2008 and the price per square foot stood at $592 at year’s end, also a drop of 17%.

While condos/TICs ended the year at the same point, the pattern has not been the same. Condos/TICs have been stuck near the bottom of their 2009 range after bouncing up in the first quarter. Homes, on the other hand, appear to have bounced up and stayed up.

What’s in store for 2010 remains anybody’s guess, but on the streets it certainly feels like spring is in the air.  There are more listings coming onto the market and more people looking at them.  Will that translate into sales and higher prices?  That’ll depend on macro-economic trends I’ve discussed elsewhere, but one thing’s pretty clear:  interest rates are heading higher, as evidenced by the Fed’s recent increase in the discount rate. If the economy continues to strengthen, that trend will continue.  And, for many people, that will result in less buying power and reduced affordability.

TICs, San Francisco’s Involuntary Reflex — Part 3: The Condo Premium Per Square Foot? Or not…

Last post, we determined that the current difference between the average (annual) price of a condo and that of a TIC is  $86,000, down from a high of $124,364 in 2006.  (That’s a 30%+ drop, by the way.)  Here’s the chart again (sorry for the funky transparency on the sales volume bars).

Condos vs. Tics Annual Average Sales Prices

That’s useful if you’re looking at an average-priced TIC and you’re curious about how much of a premium you’d have to pay for an average-priced condo.  But how about reducing that to a per square foot premium?

For those who just want the bottom line, here’s the answer, but it’s worth reading on for the caveats.

Simple Condo Premium Per SF

$37 a foot doesn’t sound like much of a condo premium to me, that’s for sure.  And as my astute readers will note, the drop in price on a per square foot (from around $225 per sf) is obviously much more than the drop in median sales prices shown in the previous chart.

What’s going on?  It’s really simple:  there’s a lot less information on sales price per square foot for TICs.

All my data comes from the MLS (Multiple Listing Service) that real estate brokers use to find and market properties.  When a sale’s completed, they are required to enter the sales price.  If there’s information on the square footage of the property — provided by the owner or more frequently from the property records — the database calculates a per square foot price.  Roughly 80% of condo sales have a recorded price per square foot in the MLS.  Only 45% of TIC sales have a recorded price per square foot. How bad is that? In September 09, there were just 27 TIC sales.  Only 9 of them had a recorded price per square foot.  For all of 2009 through September, there were 275 TIC sales.  Only 113 – 41% – show a per square foot price.

There are lots of people — mostly on other blogs 🙂  — who love to trash statistics and say they’re meaningless.  Medians don’t reflect home values, etc etc.  I disagree.  Provided you have enough data  and you understand what you’re measuring, statistics help make sense out of what is otherwise undifferentiated data.  But I am afraid that in the case of measuring the condo premium on a per square foot basis, we are in dangerous low on data.

One final reminder:  For this series of posts, my TIC data includes the handful of stock cooperative sales that occur in this market.

And thanks for sticking with me on this long series of posts….


TICs, San Francisco’s Involuntary Reflex: Part 2 — The Data

There are weeks when I look through the new listings on the MLS (Multiple Listing Service) and it seems like there are more TICs for sale than condominiums.  Turns out, this just isn’t true.  Here’s a chart showing relative sales volumes since 2003 (click to enlarge).

Units Sold By Month
Look at that!  Excluding those wonderfully regular dips every Xmas, condo sales are generally at around 200 units per month.  TICs rarely break 40.

Here’s how TIC and condo median prices stack up against each other on a monthly basis.

Condo vs TICs Median Prices By Month
Dueling spaghetti you say?  That was my reaction, too.  The huge variability in prices from month to month on the TIC line is a direct result of the paucity of sales.  And this chart certainly doesn’t help get at the key question, which is this:

Given that TICs are riskier and less flexible than condos, what’s the premium that you pay for buying a condo vs.  a TIC?

In fact many TIC buyers do so with the hope of being able to realize this “premium” by converting their TICs into condos down the road.  Fat chance unless you’re buying a TIC in a two unit building which — for now at least — remain exempt from San Francisco’s byzantine annual lottery system.

Luckily, I have a bona fide statistician mathematical genius phd for a wife, and she always lends a hand on methodology when I need it.  She suggested that where one set of data (condos) is so much larger than another, using averages provides a more reliable “apples to apples” comparison than medians.   Also, with so few monthly TIC sales, I decided to look at annual rather than monthly trends.

Here’s attempt number two.

Condos vs. Tics Annual Average Sales Prices

Much more useful!  (By the way, the fact that TICs were more expensive than condos in 2003 and 2004 can be explained by a few massively (in excess of $8 million) expensive TIC sales in those years.  This is a great example of how using medians or averages can really affect the results.)

So, can we drill down further and come up with a condo premium per square foot? Stay tuned….