San Francisco Real Estate: Doom and Gloom or Vroom and Boom?

Driving with one eye on the rear-view mirror is a good thing.  Driving with both eyes on it is likely to get you into a crash.

At a recent sales meeting where 40 or so agents discussed their impressions of the autumn sales market which opened on Labor Day, quite a few bemoaned the lack of agents showing up on brokers’ tour on Tuesdays and Wednesdays.  Others said that they’d had Sunday open houses with nary a visitor.  Agent and client fatigue?  The “flood” of new listings on the market (though that’s typical for this time of year)? An ominous sign of things to come? 

Another agent got up and spoke about how over 100 people had showed up at her Sunday open house in the Outer Sunset.  Someone else talked about the 1,500 square foot condo that went into contract at 30% over list price.  Another mused that maybe the market was diverging for properties below $2 million (strong) and those above $2 million (weakening).

A recent article in the SF Examiner quoted data produced by our own Chief Market Analyst Patrick Carlisle and concluded that, right now, it’s anybody’s guess which way the market is headed.  The metrics are pointing every which-way. I liked the closing quote, which reflects what I’ve told my clients for years:

If your aim is to keep living where you’ve been living, if you’ve been sitting on a property for more than 10 years or if you plan to buy a house and hang onto it for awhile, all of this should be white noise to you.

What makes predicting where the market is headed so difficult is that all our data points backwards to where we’ve been, not where we’re going.  September’s sales numbers reflect contracts that were entered into 20 to 40 days previous, on properties that might have hit the market 10 to 30 days before that, thus reflecting a summer market whose own dynamics are different and usually slower than the autumn “big-surge-before-winter-shuts-everything down” market we are in today.  If you think there’s any reliable leading indicator for what’s going to happen, please – please! – let me know.

Here are some selected charts from Patrick’s most recent newsletter (email me if you want the full version), starting with a snapshot of Q3 compared to the last three years.

Prices for single family homes eked out a 1.8% gain year-over-year.  That still leaves home prices up 16% from Q3 2017.  Meanwhile condos are up a healthy 7.6% over last year, but up “merely” 11% from Q3 2017.

If there are any warning signs here it may be that both the number of sales and the percentage of listings sold are stalling.  Is this the buyer and agent fatigue that agents mentioned in our sales meeting?  Remember, the chart above shows what happened July – September, whereas discussions at our recent sales meeting reflect current sentiment.  If that sentiment shows up in this quarter’s numbers too, then maybe – just maybe – we are looking at a slowing market.

Here’s another chart that suggests a bit of a plateau in home prices – but only because we’re used to a stream of double-digit gains.

Price reductions, however, which can obviously indicate a slowing market, do not seem to be signaling an imminent slowdown; they’re about the same as last year and maybe a tad lower than earlier years.

And “Days on Market,” which signals very directly the “heat” of the market, seems to show a continuing and robust sellers’ market when compared to recent years.

And for what it’s worth, from a global perspective, some analyses suggest that San Francisco may be over-valued but is not in bubble territory.  Here’s a chart from a recent UBS report on global cities (email me if you want a copy of the full report). A recent article in The Economist also concluded. that prices in San Francisco had room to run.

My personal view is – as the 8-ball so wisely says – “Ask again later.”  There’s nothing in these numbers that suggest that we’re heading into the kind of feeding frenzy that the IPO’s of Lyft, Uber and the like were predicted not long ago to ignite.  (I got that one right.) Nor is there evidence that suggests things are going to change dramatically for the worse in the near term. 

That said, if you’re thinking of selling I wouldn’t wait. Despite the (rear-view) numbers, I’d say there’s more downside risk then upside potential ahead. Prepare your home as well as possible for sale (I can help, and Compass Concierge can help pay for the costs upfront) and price it right. Homes that “check the boxes” and are move-in ready continue to sell well.

Conversely, if you’re a buyer, think about focusing on properties that have been on the market for three weeks or more and may not be “perfect.” That’s where you’ll find the values.

As always, your questions, comments and referrals are much appreciated!

Misha


Which San Francisco Neighborhoods Have Appreciated the Most?

A client of mine recently opined that he thought that Pacific Heights and other luxury neighborhoods were “overdue for a bump” in home prices. He thought that well-heeled Millennials and Gen-Z-ers were neglecting the north side of the city in favor of hipper locations like Mission/Valencia Street, Duboce Triangle, Hayes Valley and, of course, the perennial favorite Noe Valley.

As someone who has lived and worked in SF for over 30 years, I’ve witnessed my share of cycles where people bid up the “up and coming” neighborhoods (Bernal Heights is the poster child) as they get priced out of their “A-list” neighborhoods. However, when the market turns down, those same neighborhoods tend to get hit hard as buyers shift their attention back to their first choice. So, my hunch was that over the long-term, neighborhood appreciation rates would be about the same.

It turns out that I’m mostly right. The chart below shows both total appreciation and compound annual appreciation for various neighborhoods in the city within their MLS (Multiple Listing Service) Districts over the last 20 years.


While the Inner Mission and Bernal Heights have in fact appreciated more and faster than elsewhere, most city neighborhoods are right at around a 7.5% increase year over year. This fits with my general view that you could buy a single family home pretty much anywhere in the city and do alright over the long-term.

Why? First and foremost, SF is always going to be a popular place to live – notwithstanding its challenges. Secondly, single family homes are a shrinking part of the housing market. “Land,” as Will Rogers famously said, “they ain’t making any more of it.” The city’s stock of single family homes is constrained by geography – but demand continues to grow.

In fact, as I’ve described elsewhere, sales inventory is actually falling as more and more people choose to “age in place” for financial and lifestyle reasons.

But back to our first chart and rates of appreciation. The big exception is the cluster of luxury neighborhoods in MLS District 7: Pacific and Presidio Heights, Cow Hollow, and the Marina. Here, the rate of appreciation is significantly lower than elsewhere. Why? Well, consider that the base starting price is significantly higher. Back in 1998, you needed $1.6 million to buy a house in those neighborhoods – three to five times what you needed for other neighborhoods. I’m no economist, but I suspect that these neighborhoods will always approach the upper limit of what people are prepared to pay for a home. There’s simply less headroom for them to move up in price.

It’s also worth remembering that cumulative appreciation over a long period can obscure short-term fluctuations, as the following chart shows. That’s why I generally counsel my clients not to buy a home if they’re not planning on holding onto it for at least 5 to 7 years.

Here’s a comparative look at median home price trends in select neighborhoods, updated through 2018.

And while I believe that it is folly to base an offer on statistical averages for “list” to “sale” prices, the following chart does reflect which neighborhoods are seeing a lot of buyer interest. Here’s the takeaway: just as you’d expect in a mature “up” market, it’s the more affordable neighborhoods that are seeing the highest level of interest as buyers are priced out of the more expensive ones.

I have a comprehensive table of median home prices by neighborhood and bedroom count for every MLS District in the city, updated through May 2019, as well as a similar table for condos.  Unfortunately, there’s no easy way for me to display it in my newsletter.  If you’d like a PDF of the table or are curious about a specific neighborhood, please email me and I’ll be happy to send it to you.

As always, your questions, comments and referrals are much appreciated!

Misha

Spring has Sprung: How about the SF Housing Market?

First, let me thank everyone for their positive feedback on my last newsletter regarding Unicorns, IPO’s, big press headlines, and the likely effects of all of that on San Francisco home prices.  With Lyft down 30% from its opening price, Uber looking less “über alles”, and the stock market gyrating on news of a trade war – or just, um, war – we are already in the realm of larger forces potentially swamping whatever IPO effect was so breathlessly anticipated. 

That said, after a very slow start to the typically strong spring season – and by “strong” I mean heavy buyer demand and higher prices – the residential market has notably recovered from the “weakness” of the last half of 2018.  (For more on that, check out my 2018 Real Estate Wrap-Up.)

And let’s be clear about what I mean by “weakness.”  Real estate sales typically cool during the winter months after Thanksgiving anyway.  In 2018, the “cooling” might have started a little earlier in the autumn  — exacerbated by a volatile stock market – and continued longer into the new year – perhaps as a result of all the rain we’ve had — but overall the last couple of quarters don’t look significantly different from a year earlier.  Median house prices reached an all-time high of $1.7 million in February 2018; we haven’t surpassed that point for a year now, but with March and April results hovering at around $1.65, we are not far off either.  And to put this into further perspective, Spring of 2018 was one of the hottest Spring markets in SF history.

The table below shows the same thing broken down by many key metrics.  “Negligible change” seems to be a fitting description.

“Word on the street” suggests a mostly positive environment, especially at the more affordable end, and especially for single family homes, which are an increasingly small share of the market.  Open houses are well-attended; those properties that “check the boxes” are receiving multiple offers, though more frequently by the handful than by the dozen as was the case a few years ago.  At the more expensive end of the market – let’s say above $4 million for single family homes — properties are sitting a little longer and listing agents are complaining that buyers are increasingly picky – they want a “move-in” ready home.  For $4+ million you can hardly blame them.

Below are some general metrics on various neighborhoods grouped by MLS District for both single family homes and condos. Note that these are for the preceding 12 months so they do not reflect any short-term movements.

As always, your questions, comments and referrals are much appreciated.  And please consider following me on Facebook, LinkedIn, Twitter and/or Instagram as I intend to post short pieces on items of interest on a more frequent basis than this once-a-month newsletter.

All the best,

Misha

The IPO Thing: Will Lyft and Uber take Real Estate Prices for a Ryde?

I don’t think I have ever been pinged so often as I was shortly after the New York Times published “When Uber and Airbnb Go Public, San Francisco Will Drown in Millionaires.” In the Styles Section, no less.  Certainly, the idea that San Francisco, where so many IPO companies are headquartered, could see upward pressure on home prices makes sense.  As the NY Times article notes, there were only about 5,600 home sales in San Francisco in 2018 and less than half of those were single family homes.  So it makes intuitive sense that a few thousand newly minted millionaires could move the market with their new-found fortunes. (I made the same point months before the NY Times article but sadly they didn’t quote me.)

The reality may be more nuanced than the attention-grabbing headlines.  In February, Zillow published its own analysis of what it described as “the Facebook Effect.”  It tracked home price increases back in 2012 after FB went public in census tracts with an unusual number of FB employees and found that “every 10 Facebook employees living in a given census tract at the time of Facebook’s IPO in May 2012 were associated with an additional 1.6 percentage points of home value increase over that year.”   Bay Area wide, census tracts with a particularly heavy presence of FB employees saw home price increases of 21% vs the non-FB heavy tracts of 17%  between March 2012 and March 2013.

That 4% difference is nothing to be sneezed at, and I can see people rubbing their hands as they point out that the Uber IPO alone will dwarf FB’s, not to mention the effect of all the other smaller IPOs (see below).  And they could be right, particularly if, as is likely, so many more of the IPO companies have concentrations of employees in the tiny geographical area called San Francisco than was the case with FB’s IPO back in 2012.

But Zillow’s takeaway is notably cautious:

“While we still expect this year’s tech IPOs to impact the local housing market, it may be more about easing the fall than acting as a springboard for accelerated future growth.”

And that’s approximately where I come out.  While the significant new influx of money cannot be ignored, it is just one factor at play among other forces.  Those include:

  • What happens to the value of those IPO stocks after they go public?  (Lyft opened at $88.60 and closed today at $67.40 –  a drop of 24%.)
  • What’s happening to the economy and employment generally?
  • What’s happening to interest rates?
  • What’s happening in the real estate market overall?

I’d venture to say that while the fate of the IPO stock price may most directly affect both the pocket-book and, equally importantly, the confidence of the new home-buying millionaire, the other three factors will have a much broader influence on home prices over the course of the next few years. 

Here’s a hypothesis for you (and please post your thoughts here to continue the conversation):  If the market warms up again after going a bit cold at the end of 2018 (see my last newsletter), the IPO effect will accelerate price growth in the city, as the nouveau riche have the means and confidence to buy up what they want.  However, if the market continues to slow,  the IPO effect may soften the decline but not by much.

Why?  When a property is perceived as being over-priced, people just don’t want to overpay.  Nobody wants to be taken for a chump — even when they can afford to be.

And, speaking of young and upwardly mobile, take a look at this great new townhome in Mission Bay that I will be bringing to market this week-end. Absolutely perfect 2BR/2.5 BA pad, right off Mission Creek, in one of the hippest, most vibrant neighborhoods in the city: www.235berry-unit-112.com.

As always, your questions, comments and referrals are much appreciated!

Misha

“What Goes Up Just Might Be Coming Down.” The 2018 San Francisco Residential Real Estate Wrap-Up

Off to the Races

In 2018, San Francisco’s median house sales price was $1.6 million.  That’s an increase of 13% over the previous year.  Meanwhile, the median condominium sales price increased about 5% to $1,210,000.

If the chart above was the only one you consulted on SF real estate, you could be forgiven for thinking that since the 2012 recovery from the Great Financial Crisis, the city’s real estate prices have been rocketing inexorably upward. 

Slow Finish

But you’d be wrong.  As Mark Twain said, quoting Benjamin Disraeli: “There’s lies, damn lies, and statistics.”  In 2018, the year had two very distinct halves.  And if you don’t look at the statistics for those two halves, you’ll miss the real story here – which is that single family home prices fell precipitously over the last two quarters. The chart below shows price changes by quarter.

In a nutshell, the median price of a single family home in the last quarter of 2018 was essentially the same as it was a year earlier – $1.5 million.  Homes lost $120,000 in 2 quarters.  That’s a 7% drop in value.  (Condos, meanwhile, remained basically flat.)

While our Chief Market Analyst, Patrick Carlisle, judiciously hedges his bets by pointing out that quarterly fluctuations are not unusual and also reflect seasonal variations, other data also supports the notion that we may – operative word, “may” – have reached some sort of inflection point. 

Less Frenzied Over-Bidding

For example, “overbidding” – the difference between the list price and the ultimate sale price – dropped dramatically for single family homes in the last half of the year, even though it remains at high levels.  Interestingly, the last time overbids declined significantly was from late 2015 through 2017; that may correlate with the massive drop in annual appreciation for 2016 and 2017 to single digits, whereas the previous three years’ returns were between 16 and 20% (see second chart below).

More Price Reductions

Another indicator: Price reductions in the fourth quarter hit their highest levels in over five years.

Still, Mixed Signals

Not all the statistics point clearly to a softening market.  For starters, supply remains constrained and at historically low levels.  I’ve described this elsewhere as a secular shift, reflecting, perhaps, an aging population that chooses to age in place rather than to move.

In addition, Average Days on Market (DOM) remains very low for most single family homes as the following charts shows.  While DOM for the most expensive homes rose significantly in the last two quarters, there are so few sales in this segment that statistics tend to be volatile anyway.

If we see any current weakness in the market, however, it’s in high-end condos ($3+ million) where new construction in recent years has created oversupply. The next chart shows that DOM for this segment has been between 40 and 60 days for two years.  Most other markets would love to have a DOM statistic of 60 days.  In San Francisco, that’s considered l-o-n-g.

Bay Area Perspective

For a broader perspective we can look at the Case Shiller Index for the SF Metro Area.  It aggregates data for five Bay Area counties:  San Francisco, San Mateo, Alameda, Contra Costa and Marin.  San Francisco represents a tiny part of that index – only 7% of all sales.  And virtually all of those sales would fall within the “high price tier” of the Index.  Still, if there’s one thing we should have learned by now it’s that SF is not immune from broader market trends.

The first chart below confirms how, Bay Area wide, there was price slippage in all price tiers starting in the summer months of 2018. The second chart, with a longer perspective, shows how lower and mid-priced homes generally appreciate faster during run-ups and then drop faster and further during slowdowns.  The same phenomenon applies to SF itself.  As people get outbid on homes in their “A” list neighborhoods, they bid up prices in neighborhoods deemed less desirable.  When the market drops, buyers focus again on the “A” list neighborhoods and avoid the B-List , thus exacerbating the decline in the latter.

Caveats, IPO’s, and Wild Cards

It’s worth remembering that the end of 2018 saw one of the most volatile stock market rides in recent history.  That, in itself, could have contributed significantly to the weakness we saw in the real estate market in the second half of the year.  If the stock market stabilizes and returns to its bullish ways, maybe that end-of-year weakness will be just a blip. 

With a handful of high-profile Bay Area unicorns going public (including Lyft, AirBnB, and Uber), there’s speculation that the resulting crop of newly minted millionaires will bid up the market as they look for homes.  As I’ve written previously, in a market as small as San Francisco, that’s a plausible theory.  However, three studies report in a recent article in the SF Chronicle suggests that if there’s an effect at all, it’s limited.

Then there’s Brexit, Venezuela, North Korea, a trade war with China, and the possibility of another government shut-down, not to mention Robert Mueller and a certain volatile public figure who is the subject of his inquiry.

As the Chinese proverb says:  “May you live in interesting times.”  Happy New Year!

As always, your comments, questions and referrals are greatly appreciated!

Misha


Signs of a Slowdown? – “Ask Again Later”

Every couple of weeks, around a hundred (formerly Paragon, now Compass) agents get together to discuss the market and share their sense of what’s going on.  Is there lots of activity at open houses?  What’s selling? What’s not?  Are buyers active – or tired?  Are sellers getting greedy?  That sort of stuff.  We also receive regular updates from our stellar Chief Market Analyst, Patrick Carlisle – the best in the business – who puts together the charts that I use in these newsletters.

The last few meetings have been interesting.  More than a few agents have talked about slow open houses on week-ends and buyer-clients that are choosing to look outside of San Francisco (I myself have one couple who are considering a move to Seattle).  And rather than listings receiving a dozen offers, agents are happy to have two or three.  Or one.  The practice of creating a blind auction by calling for offers on a specific date may be starting to backfire.  Some properties are receiving no offers at all.  That puts the buyer in the driver’s seat, so more and more agents are returning to the almost ancient way of taking “offers as they come.” Who knows, maybe we’ll even start seeing offers written with contingencies again.

This feeling “on the street” that we may be experiencing the start of a slowdown or correction has been in the news as well.  The New York Times reported recently on cooling markets in New York, Seattle, Denver and “even” San Francisco.  Yet – so far, at least – it hasn’t shown up decisively in the data.  The biggest reason may simply be that data is backward-looking – by about 45 days, which is about how long it takes for a property to get from “on market” to “sold.”  A second reason is seasonality.  Sales, particularly at the higher end, always slow down during the summer.  This results in the data showing fewer new listings, fewer sales, and lower average prices during the summer months and through to September and even October.  Thus, seasonality can itself obscure an underlying slowing trend.

So while median single family home prices dropped to $1,570,000 in the third quarter from their all-time high of $1,620,000 in the second quarter, this could be nothing more than a recurring seasonal effect.  (Median condominium prices dropped from $1,235,00 in Q2 to $1,200,000 in Q3.)  And before anyone panics, it’s worth noting that home prices were up 15% over Q3 2017 and condos were up 4%.

Supply – Increasing (Maybe)

But take another look at the top chart.  September typically brings the largest number of new listings to market as folks try to sell before the market goes into hibernation during the winter months following Thanksgiving.  This September was no different in that regard.  But the number of new listings jumped 28% over September 2017 and hit its highest point in years.

Since constrained supply is one of the things that has been driving San Francisco prices higher, a jump in total active listings – as opposed to new listings — could signal a slowdown. Yet we haven’t seen any dramatic jump in total active listings (see chart below).  While active listings in September were up slightly over 2017, year to date they are about on par with last year and lower than 2016.

Demand –  Decreasing (Maybe)

One of the metrics we look at to measure demand is the number of properties that see a reduction in their list price while on the market.  Some properties are just priced too aggressively to begin with, but for a long time now the reverse has been true:  agents price properties low and expect competing buyers to bid the price up. So a jump in the number of listings with price reductions can signal that the market is cooling off.  If there is the whisper of a chill wind starting to blow it may be in the next chart, which shows a 37% jump in price reductions in September 2017 over the previous year and an 18% increase in reductions over September 2016.  And, perhaps significantly, the higher number of price reductions in 2016 overall (see October 2016 especially) relative to the two previous and subsequent years was in fact accompanied by a market slowdown – albeit a temporary one.

Headwinds

If, in fact, a slowdown has arrived or is on its way, rising interest rates and the recent tumble in the stock market is not going to help.  The NY Times article I mentioned suggests that wage increases simply haven’t kept up with price increases.  And buyers may be starting to realize that the tax law changes enacted earlier this year will result in a decrease in the tax benefits of owning high-priced homes.  Here in SF, that’s pretty much all we have.

The bottom line is that it’s too soon to tell whether September will prove to be just a blip or the start of a meaningful shift towards a market that’s a little kinder to buyers.  As the wise 8-Ball says, “Ask again later.”

As always, your comments, questions, and referrals are much appreciated!

Misha

And a PS.  Some of you may know of my interest in photography.  I’ve started posting a few photos to my Instagram account.  They’re typically of urbanscapes, buildings, or related to interior design.  You can find me at instagram.com/mmmmisha

Housing Market Slows, as Rising Prices Outpace Wages

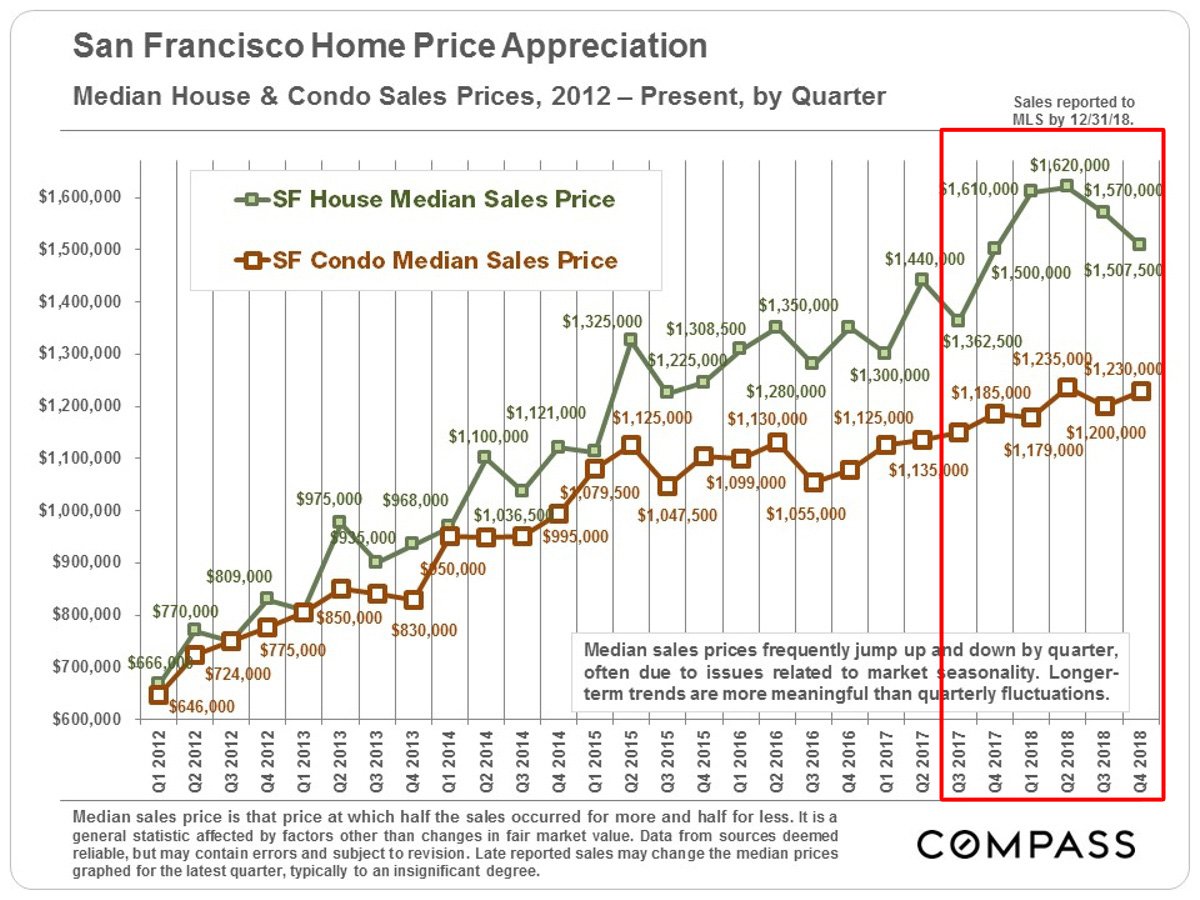
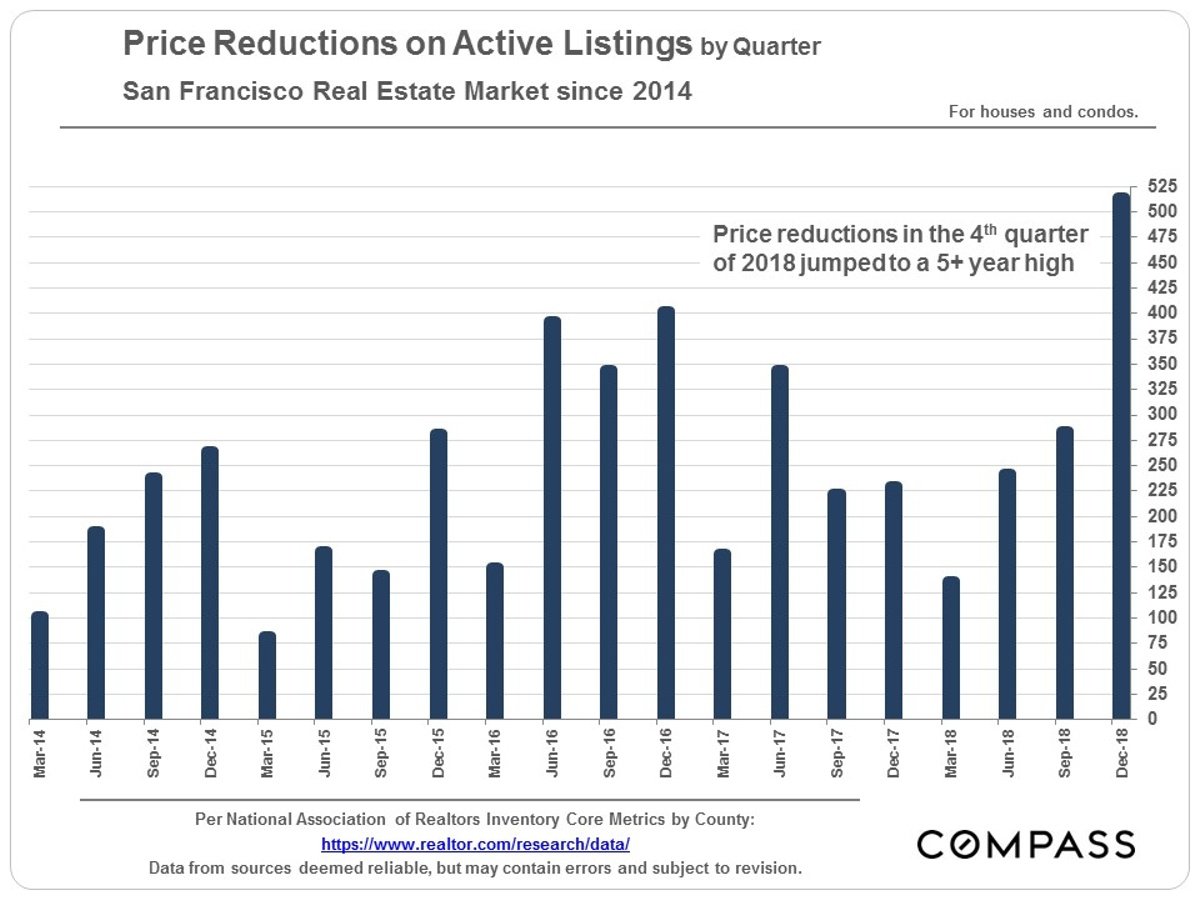
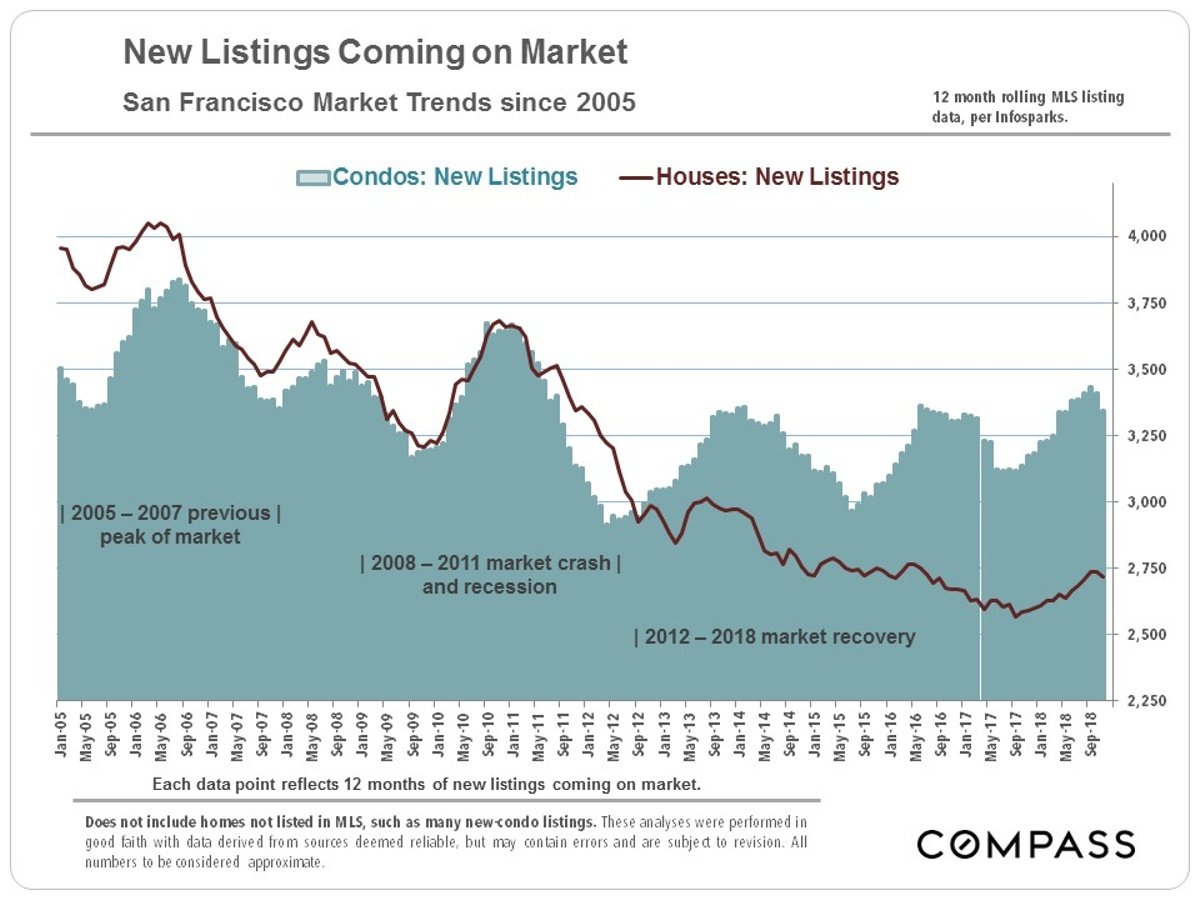
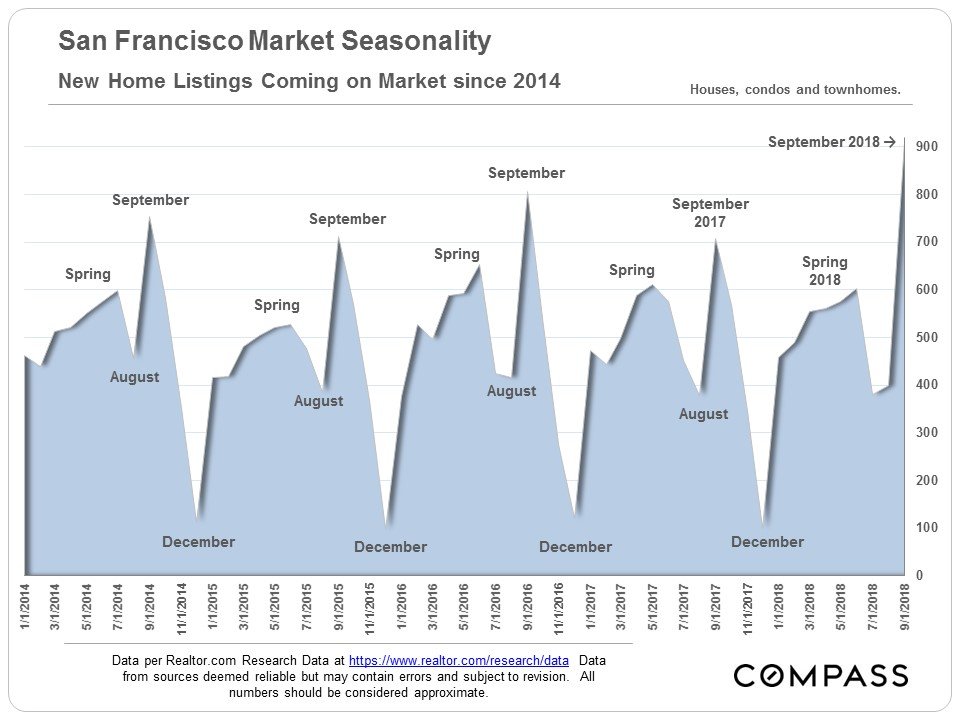
This Sunday’s front page NY Times article suggests a national slowdown as wage increases fail to keep up with home price increases. Indeed, it “feels” as though there is some slowing in the market, especially at the higher end – and we do have the data to indicate that there’s been a lot more new inventory coming to the market in the months of August and September than in the previous two years. We do not yet have hard data on whether this and other factors are creating downward pressure on sales prices. Stay tuned!

Misha

DENVER — By nearly any measure, this city is booming. The unemployment rate is below 3 percent. There is so much construction that a local newspaper started a “crane watch” feature. Seemingly every week brings headlines about companies bringing high-paying jobs to the area.

Yet, Denver’s once-soaring housing market has run into turbulence. Sales and construction activity have slowed in recent months. Houses that would once have drawn a frenzy of offers are sitting on the market for days or weeks. Selling prices are rising more slowly, and asking prices are being slashed to attract buyers.

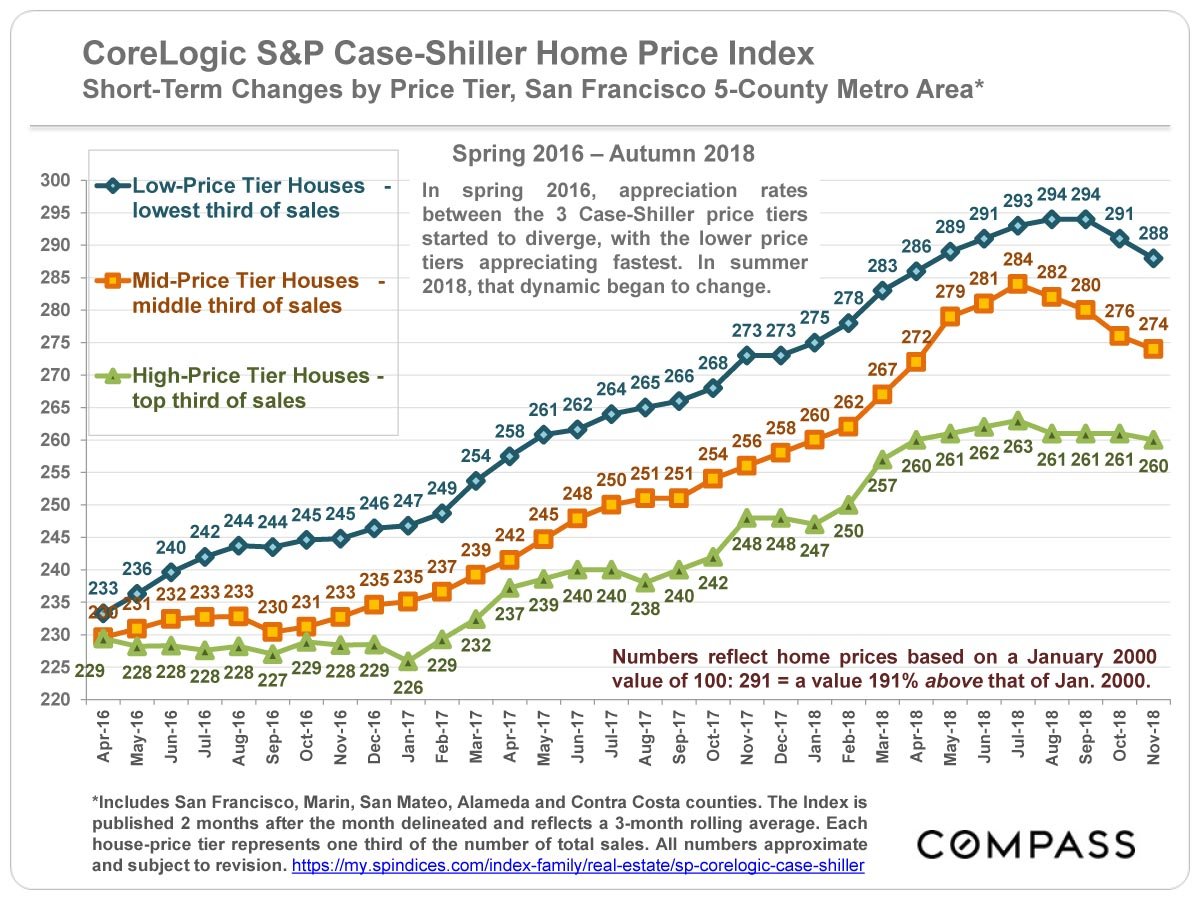
Similar slowdowns have hit New York, Seattle and even San Francisco, cities that until recently ranked among the nation’s hottest housing markets. The specifics vary, but economists, real estate agents and home builders say the core issue is the same: Home buyers are reaching a breaking point after years of breakneck price increases that far exceeded income gains.

“The local economy is still fantastic, all the fundamentals are there, but obviously wages are not keeping pace,” said Steve Danyliw, a Denver realtor. “As the market continues to move up, buyers are being pushed out.”

Rachel Sandoval is one of them. An elementary schoolteacher in the Denver Public Schools, Ms. Sandoval earns about $50,000 a year, enough to afford a condominium or a modest house in most markets. But not in Denver, where the median sales price for all homes was $410,000 in August, and where even condos routinely top $300,000 — a price Ms. Sandoval calls “not even close to feasible.” She said she was scoping out jobs in Texas, where houses are cheaper and pay is higher, and considering leaving teaching in search of a higher salary.

For now, Ms. Sandoval, 41, is sharing a one-bathroom rental house with two roommates, a nurse and an adjunct professor. The three stick to a strict schedule to make sure they can all get to work on time.

“We are professionals, we have degrees,” Ms. Sandoval said. “This was not the plan.”

Nationwide, sales of previously owned homes fell 1.5 percent in August from a year earlier, according to the National Association of Realtors. Residential building permits were down 5.5 percent over the past year, according to the Department of Commerce. Many economists say the housing market may have turned into a drag on the gross domestic product.

The recent slowdown, however, is unlikely to give would-be buyers like Ms. Sandoval much relief. Prices in Denver are still up 8 percent over the past year, according to the S&P Case-Shiller index. That’s cool compared to the double-digit gains of a couple years ago, but well ahead of the 6 percent increase in average hourly earnings over the same period. Rising interest rates have also made buying homes more expensive.

Few analysts expect an outright decline in home prices anytime soon. That’s because, unlike the speculative bubble of the mid-2000s, the recent run-up in prices has been driven primarily by economic fundamentals: People are moving to Denver faster than developers can build places to live. The Denver region has added more than 300,000 residents since 2010, making it one of the country’s fastest-growing areas.

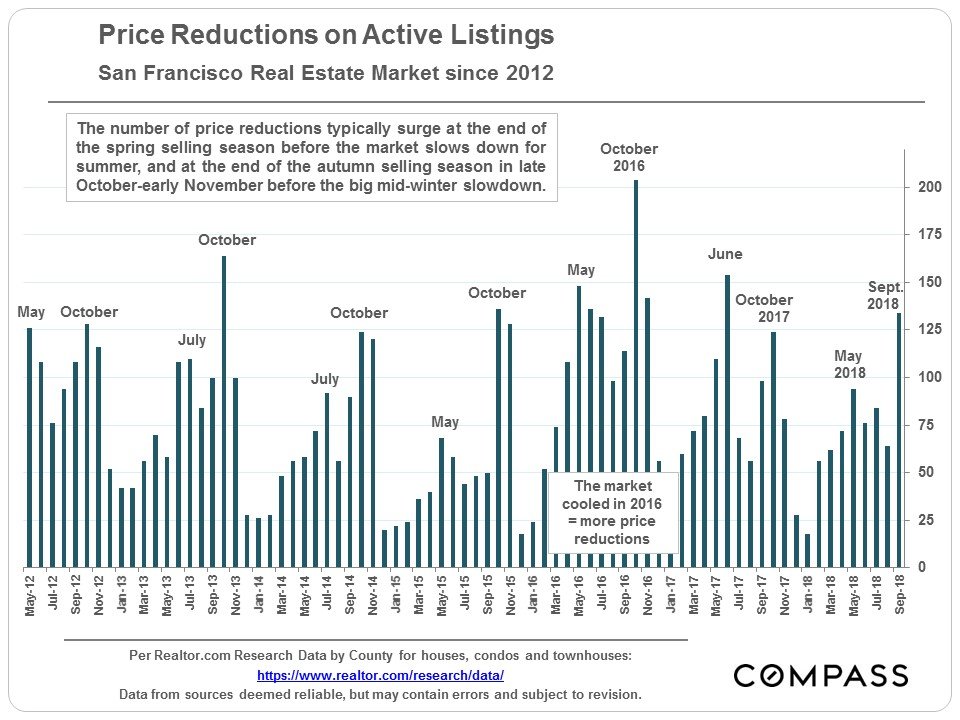
Introductory economics textbooks suggest that high prices should attract more supply or suppress demand — or both. Inventories of unsold homes have risen in Denver and other markets in recent months, and the real estate site Zillow found that price cuts have become more common.

Over all, however, the housing market is not behaving as the textbooks say it should. Inventories remain low despite the recent increases, and new construction is slowing, not picking up.

Part of the problem, local real estate agents say, is that the furious pace of price growth has essentially gummed up the market, making homeowners reluctant to sell for fear of being unable to find a new home.


The median sales price for all homes in the Denver area was $410,000 in August, and condos routinely top $300,000. Credit Benjamin Rasmussen for The New York Times

The median sales price for all homes in the Denver area was $410,000 in August, and condos routinely top $300,000. Credit Benjamin Rasmussen for The New York Times

Brant and Annie Wiedel spent more than a year trying to get a foothold in Denver’s housing market — and they are reluctant to give it up. The couple estimate that they looked at 160 houses before finally closing on a three-bedroom ranch house in Lakewood, a suburb, three years ago.

With two children and a third due in January, the Wiedels would like to trade up. With the rise in home prices some renovations, the house they bought for $350,000 could be worth more than $500,000.

But the family borrowed at about 3.5 percent three years ago. Today, they would pay closer to 5 percent. “Even if we just saw houses at the same price, we’d have to pay more” every month, he said.

Ultimately, the key to breaking the logjam is to build more homes. Downtown Denver is crawling with cranes, many of them erecting amenity-filled apartment complexes aimed at young professionals. A drive in almost any direction from downtown reveals freshly built subdivisions with names like Tallgrass, The Enclave and Green Gables Reserve.

Most of those new homes, however, will list for more than $400,000. And hardly any builders are selling properties for under $300,000 without government subsidies. Even many home builders worry they are pricing themselves out of the market.

“I see the biggest threat to our business as the affordability challenge, that we are building houses that people can’t afford,” said Gene Myers, chief executive of Thrive Home Builders.

The problem, Mr. Myers and other local builders say, is cost. The price of land, building permits and other fees can run close to $150,000 for a single-family lot — before construction.

Some of the challenges are specific to Colorado. Quirks in state law, for example, make it easy for condominium buyers to collectively sue builders over construction defects, making developers reluctant to build condos.

But other issues are common to many cities. Building materials have become more expensive, in part because of tariffs on lumber and other products that President Trump imposed this year. Labor costs are rising, too, especially for skilled trade workers. Restrictive zoning makes it hard to build denser developments that make cheaper homes profitable for builders.

Building materials have become more expensive, in part because of tariffs on lumber and other products that President Trump imposed this year. Labor costs are rising, too, especially for skilled trade workers. Credit Benjamin Rasmussen for The New York Times

“They’re producing what they can produce,” said Sam Khater, chief economist for Freddie Mac, the government housing-finance company. “The problem is, it’s uneconomic for them to produce affordable.”

This big-city conundrum is spreading. People priced out of San Francisco moved to Seattle and Portland, driving up prices and displacing people who moved to Denver and Austin. Next on the list: Boise, Nashville and other cities offering some of the same attractions at lower prices.

Sure enough, the online real estate site Redfin this spring found that Denver had joined Seattle and San Francisco as cities with a “net outflow” of users — that is, there were more people on the site looking to leave Denver than to move there.

“City after city is going to face this,” said Glenn Kelman, Redfin’s chief executive. “At some point, the buyers step back and say, ‘Enough is enough.’”

More people are moving to Denver than leaving it, but migration has tapered off in recent years. J. J. Ament, chief executive of Metro Denver Economic Development Corporation, said he had seen no sign that rising home prices were making the region less attractive. Last month, VF Corporation, an apparel maker that owns brands like The North Face and Vans, announced it would move its headquarters to Denver from North Carolina, partly because of the area’s reputation for outdoor activities. The state also offered $27 million in incentives.

“I wouldn’t use the word ‘crisis,’” Mr. Ament said. “The work force is still willing to move here.”

Plenty of people in Denver do use the word “crisis,” however. A January report from Shift Research Lab, a local research group, concluded that years of under-building have left the region with a shortfall of tens of thousands of housing units.

That shortfall could threaten Denver’s growth, said Phyllis Resnick, a Colorado State University economist and one of the report’s authors. The skilled workers moving to the area, who have been so important to attracting companies and jobs, want to be able to eat out at restaurants, drop off their dry cleaning and send their children to school, all of which require lower and middle income workers. If they cannot afford to live in the area, Ms. Resnick said, Denver will not retain its allure — and the economy will not keep growing.

Angela Kirkland-Vandecar recently moved into a condo in the Villas at Wheatlands in Aurora, Colo., east of Denver. Each lot in the development has three attached homes. Credit Benjamin Rasmussen for The New York Times

“My concern is, at some point it sort of breaks because we can’t house the folks that we need to fill out all the economic activity in the region,” she said. “I’m not convinced that in the near term it will correct itself just through market forces, unless that’s through people moving out.”

Local governments and charities are trying to address the problem. The Denver City Council last month voted to double, to $30 million per year, the city’s affordable housing fund, which is used to build and preserve homes for low-income residents. Late last year, nonprofit groups announced they had raised $24 million to start the Elevation Community Land Trust, which will buy land to create permanently affordable housing. Another new program aims to help public schoolteachers come up with down payments.

To have a big impact, economists say Denver and other cities have to build more homes affordable to middle-class families. That will require persuading communities accustomed to single-family homes to accept condos and townhomes.

“The only way to solve the riddle is through density,” said Dave Lemnah, co-owner of Lokal Homes, a Denver builder.

That’s why he is building projects like the Villas at Wheatlands, a 94-unit development in Aurora, east of Denver. Each lot has three attached units arranged like a jigsaw puzzle. Lokal sells the homes for less than $400,000; some go for close to $300,000.

One buyer, Angela Kirkland-Vandecar, an aesthetician and a single mother, has spent two years searching for a home she could afford on her roughly $50,000 income.

Ms. Kirkland-Vandecar said she spent two years looking for a home before finding one she liked and could afford. Credit Benjamin Rasmussen for The New York Times

When Ms. Kirkland-Vandecar began her search, she did not want to move to Aurora or to a condo.

“I’ve now done everything that in the beginning I said I was not going to do,” she said.

But Ms. Kirkland-Vandecar feels good about her decision. Her monthly mortgage payment will be less than her $1,900 monthly rent, and she is happy not to have a lawn to mow. Her daughters, 11 and 13, will have their own rooms, and she will no longer have to store food in the laundry room, as she did in the cramped apartment she had been renting.

Walking through her nearly ready house recently, looking for defects, Ms. Kirkland-Vandecar opened a door in the kitchen and paused. A Lokal Homes worker asked if she had found a problem. She shook her head.

“I’m just enjoying my pantry,” she said.

Source

Prop 10 and How Your Own Home Might Become Subject to Rent Control

I don’t mean to sound alarmist – well yes I do – but there’s a California ballot measure up for vote this November that could significantly curtail your rights as an owner of a single family house or condominium if you should ever decide to rent it out.    

Most people are aware that San Francisco has rent and eviction control legislation.  Briefly summarized and simplified, if you own a multi-unit building (ie. two units or more) which was completed prior to the date the Rent Ordinance was passed, June 13, 1979, you cannot increase the rent of an existing tenant by more than 60% of the annual Consumer Price Index each year. In addition, you can only evict a tenant for a limited set of reasons enumerated under the Ordinance.  In practical effect this means that a lease for a fixed term has no meaning:  once the lease is up, a tenant who is otherwise paying rent on time can stay as long as she wants to stay. And, for as long as she stays, the maximum annual amount that her rent can increase is determined by the Rent Ordinance, not by you. 

Now, some might support Rent Control as way to support affordable housing in the context of an apartment building.  However, they might feel differently if owners of single family homes or condos are subject to the same set of rules as those that govern buildings with two, three, or thirty tenants. 

That’s why Proposition 10 is important: it could mean that in the future San Francisco’s Rent Ordinance will apply to every kind of residential property in San Francisco, including single family homes and condos.

Costa-Hawkins Protects Single Family Homes and Condos from Rent Control

In February 1995, the California Legislature passed a law known as Costa-Hawkins that prohibited local governments like San Francisco from imposing rent control laws on single family homes and condominiums, while leaving rent control regulation on multi-unit buildings intact.  The second important aspect of the legislation was that it prohibited the imposition of rent control on newly constructed residential buildings or, in the case of municipalities that already had a rent ordinance in place, buildings constructed after the date of the local ordinance.  This “new construction” exemption was intended to allay fears that apartment developers would simply stop building in areas where rent control was in effect — thus exacerbating the housing crunch precisely in those areas that needed more housing.

As a result of Costa Hawkins, if you own a home or a condo in San Francisco and you decide to rent it out, it is not subject to rent control – regardless of when it was built.  As for eviction control, it depends on whether the home or condo was built before or after June 13, 1979, when the Rent Ordinance was passed.  If built before, it is subject to eviction control; if built after, it is not.   Complicated?  You bet.  Here’s the best graphic I’ve found to describe how things work now, courtesy of the law firm of Bornstein & Bornstein.

Other important and potentially expensive ramifications follow from whether a property is or isn’t subject to rent control and/or eviction control.  I’ll briefly touch on one – Relocation Payments – which are mentioned in the chart. Say you’re thinking of buying a condo in a building constructed in 1925.  The condo is occupied by a couple with a school-aged child whose original lease has expired and who are now protected from eviction under the Rent Ordinance.  You want to move into it yourself.  This is called an “Owner Move-In Eviction.”  The Rent Ordinance controls every aspect of this process, including: when you can evict the tenant (not during the school year); how much notice you need to give them; and the amount of the “Relocation Payment” you’d be required to pay (for this family, it’s about $25,000 and goes up from there depending on particular circumstances).  Take the same situation but imagine that you’re looking to buy a condo in a new high-rise: none of those same requirements currently apply. 

Prop 10 Would Repeal Costa-Hawkins

Prop 10’s purpose is to repeal Costa-Hawkins and to leave it to local governments to decide which kinds of properties are subject to rent and eviction control. For example, San Francisco could extend its Rent Ordinance to most or all of the residential properties that are currently exempt. Here’s what the Law Firm of Steven Adair MacDonald wrote in its recent bulletin about Prop 10:  (Please email me for a copy.)

If Costa-Hawkins were repealed, local governments could create or expand their existing rent and eviction control ordinances so that all residential units, including, new apartments, single family homes, and condos, are treated alike. Vacancy control could also be implemented, which would limit what a landlord can charge when a unit becomes vacant.


Are such additional regulations likely in San Francisco?  I offer Exhibit A:  In June 2018, San Francisco voters passed Proposition F by a 56% margin.  It requires the City to provide free legal representation to every tenant that is served an eviction notice, regardless of the tenant’s economic means or the circumstances of the eviction.

While proponents of Prop 10 argue that it will give local government the power to protect and expand affordable housing, “opponents argue it will ultimately reduce the housing stock given that landlords can no longer get a reasonable return on their investment and will instead, opt to remove their units from the already shrinking housing market.”  How do you “remove a unit?”  You “Ellis Act” it. That’s a subject unto itself.

Will it Pass?

Proponents and opponents are both spending at a furious rate.  While California’s home-ownership rate is 54% according to the US Census,  a recent UC Berkeley study found that 60% of likely voters support rent control.  I haven’t been able to find any current predictions on whether the measure will pass but given the general and understandable frustration about high rents in many parts of the state, I’d say that there’s a better than 50/50 chance that it will.

Why it Matters

It’s one thing to believe that the owners of multi-unit buildings who have chosen to be “in the business” of owning residential income property should be subject to rent control legislation.  It’s quite another to apply those same regulations to someone who originally bought a home or a condo for their own use and who then later decided to rent it out.  People move away temporarily for work reasons and want to rent out their home to cover the cost of their mortgage.  Others want to “downsize” but get income from their home for their retirement. Others may simply want to eventually pass the home on to their children.

If Prop 10 passes and San Francisco extends its Rent Ordinance to homes and condos, perhaps more people will choose to sell once they no longer intend to occupy their homes or condos themselves.  Others who can afford to may simply keep their homes vacant rather than subject themselves to the Rent Ordinance. Yet others, may think twice about owning property in San Francisco at all.

My purpose in this newsletter is not to bash rent control.  Housing affordability is a real and complex issue.  Is rent control a good policy solution?  Academicians and economists seem on balance to think it is not, but I’m in no position to judge their conclusions. Still, considering that about 37% of SF’s 390,000 housing units are owner-occupied, I think it’s fair to say Prop 10 could have an enormous effect on San Francisco’s homeowners.

What to Do?  Talk to an Attorney, Really

It should be abundantly clear by now that buying, selling or owning a property in San Francisco that is tenant-occupied – or even that has previously been tenant-occupied — can be a veritable legal minefield.  If you own or are thinking of buying residential income property in San Francisco or elsewhere in California, I urge you to read this excellent non-partisan article about Proposition 10.  Then sit down with an attorney that specializes in residential real estate law.  Please call or email me if you need a referral.

For people who might be thinking about renting out their home or condo for a while – say, during a temporary relocation – again, I urge you to consult with an attorney and to consider delaying the rental until we see if Prop 10 passes.  You might find that getting your home back when you want it is more difficult and expensive than you anticipated.

Thanks for your patience on this especially long newsletter.  As always, your comments, referrals and suggestions are much appreciated.

[Note, this newsletter is not to be construed as legal advice on any of the matters discussed within it and is intended for general informational purposes only.]