Return on Investment: 1994 – 2014
May 2014 Report
We recently put together an analysis comparing the comparative investment returns of buying a San Francisco Bay Area house, gold, Apple stock, an S&P 500 Index fund or putting money into a bank CD in January 2012 (Of Real Estate, Gold & Apple Stock). Not unreasonably, the issue arose regarding returns over a longer term. Now, whatever time period is used will always be fundamentally arbitrary, and different periods will often generate dramatically different results. Twenty years is a round number, which allows a nice mix of recessions, bubbles, crashes and recoveries to be encompassed within our inquiry.
Stock and home purchases cannot really be compared apples to apples: This is a simplified, good faith illustration pertaining to the investment of $100,000 in January 1994. February 2014 was chosen as the home sale date because that is the last published Case-Shiller Index (as of 5/20/14). Home prices in San Francisco have actually surged yet again in the past few months, but this is not reflected below. April 2014 was chosen for the stock sale date because that was last published update for the DQYDJ S&P 500 calculator.
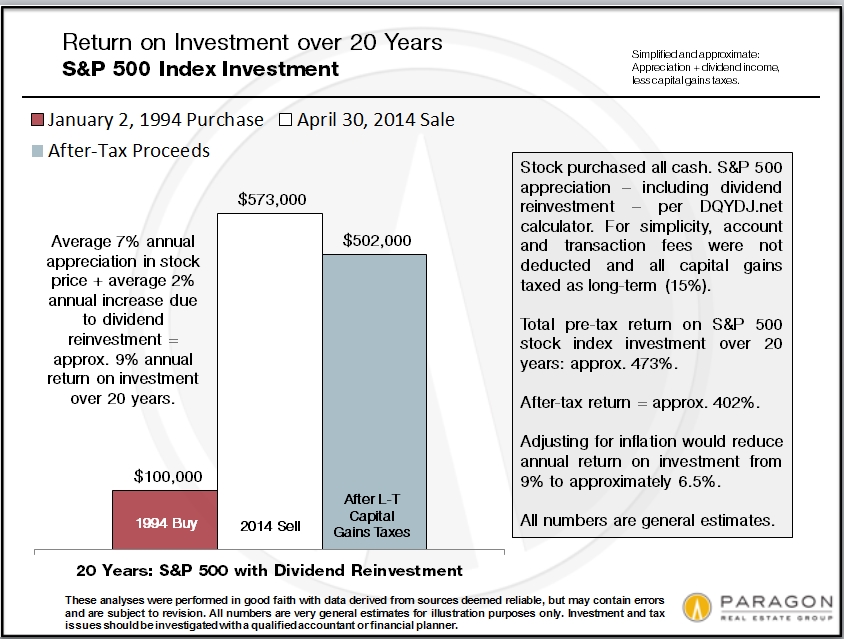
S&P 500 Index Investment, 1994 – 2014
In hindsight, 1994 was an excellent time to put money into the stock market.
If hindsight investing was viable, we would all be rich as Russian oligarchs.
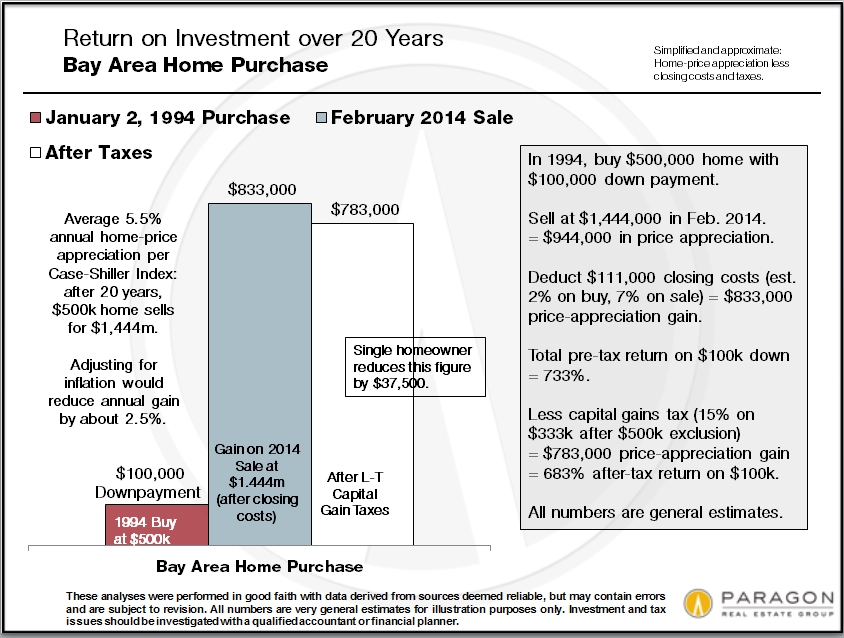
Bay Area Home Purchase, Buy in 1994, Sell in 2014
1994 was an even better time to purchase a San Francisco Bay Area home.
Return on Cash Investment: S&P 500 vs. Bay Area Home
Certain benefits to U.S. homeownership boost return on investment over stock market.
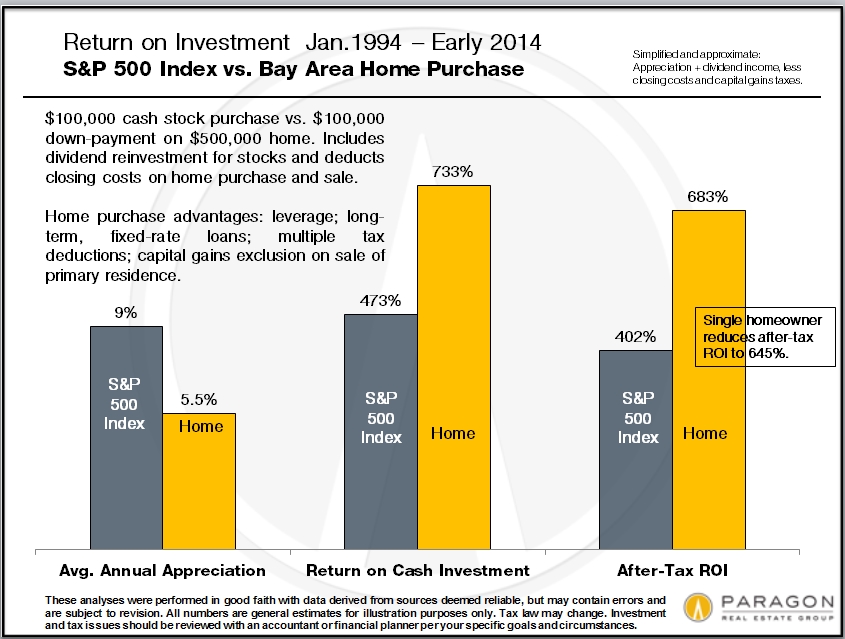
Including dividend reinvestment, the S&P 500 appreciated approximately 9% per year for a total of 473% over the 20 year period. (If account and transaction fees were deducted, the return would be somewhat reduced.)
Bay Area home prices appreciated much less than the S&P 500 during this period, approximately 5.5% per year for a total of 189%, but the return on cash down-payment investment would be approximately 733%, significantly out-performing stocks. This difference increases when taxes on gain are included in the equation.
Note: Adjusting for inflation, investment returns would be about 2.5% lower per year (the approximate, average inflation rate over the past 20 years). Both stocks and home investments significantly outpaced inflation.
Financial Advantages Peculiar to American Homeownership
1) Leverage: 189% appreciation of a $500,000 home = over 900% appreciation, before closing costs, of the $100,000 down-payment. If one pays all cash this advantage disappears, but one’s monthly cost of housing plunges (though probably not close to making up for losing the supercharging that leverage adds to investing).
2) Long-term, fixed-rate home loans: Which substantially lock in monthly housing costs (while other costs, such as rents, continue to increase) and can be refinanced at opportune times. When one can get a 30-year mortgage at what is, historically speaking, an extremely low interest rate, it makes an enormous difference in total interest expense and monthly housing costs. As an example, in 1994, the average 30-year rate was 8.4%; now, in mid-May 2014, it’s 4.2%, (in 2013, it dipped to below 3.5%) i.e. today’s million dollar loan charges the same interest as 1994′s $500,000 loan.
3) Multiple homeownership tax deductions: Such as the mortgage interest deduction, which effectively subsidize monthly housing costs. (Consult with a qualified accountant regarding your own tax situation.) These deductions, along with low interest rates and ongoing principal repayment of the loan, generally make net monthly homeownership costs comparable to and often less than the cost of renting the same home. (Rent vs. Buy Calculator)
4) The huge, capital-gains exclusion on the sale of a primary residence: $250,000 for singles/ $500,000 for couples. It’s a rare investment that allows you to walk away with large, untaxed profits. For a couple selling their home in the above investment scenario, it means an extra $75,000.
It’s worth noting that advantages 2, 3 & 4 above are not found in most other countries, and indeed some of them remain issues of political contention in our country as well.
Homeownership as Investment & Homeownership as Housing
In this analysis, home-ownership is divided into two distinct financial spheres: 1) the investment return on the $100,000 down payment: you put in $100k cash and upon sale, you receive a certain amount of cash proceeds back. And 2) the cost of living in the home you purchase, i.e. the monthly net homeownership cost (principal, interest, taxes, insurance and maintenance, after tax deductions and principal pay-down), which is minimally assumed to be, over the course of time, comparable to the cost of renting.
Upon purchase in 1994, with interest rates at over 8%, the net homeownership cost probably exceeded the cost of renting by a good margin. But interest rates then started to decline: to under 6%; then under 5%; and in 2013, to under 3.5%. As of mid-May 2014, it is 4.2%. Refinancing at selected times over the 20 year period would have dropped net monthly homeownership costs substantially, while San Francisco rents over the same period have soared to historic highs. Ultimately, the monthly cost of owning would be far below – probably more than 50% below – the market rental rate for the same home.
The cost of housing issue is not figured into the return on investment scenario, because the equation simply gets too complicated. This is one of the ways in which comparing homes to stocks is not an apples to apples comparison.
Asset Building One Loan Payment at a Time
This analysis does not adjust proceeds of home sale for the reduction of outstanding loan balance over the 20 years, i.e. of the original $400,000 loan, only $153,000 remains due and payable upon sale. If this was done, then cash after-tax proceeds of sale would be almost $250,000 higher.
Homeownership over time — especially longer periods of time — not only typically delivers a good return on investment, but as long as one doesn’t refinance out increasing home equity to buy yachts or finance a child going to college, it acts as a lay-away savings account that grows each month as your loan payment reduces the principal loan amount due. In earlier generations, this was a classic strategy: buy a home, live in it for 30 years, retire, and then either live in it at a very low cost, since there is no longer a mortgage payment, or sell it and recoup not only appreciation but the initial purchase loan amount which has turned into home equity. Many of us are not that good at saving: Mortgage repayment can act as a “forced” savings account to be tapped far in the future, such as upon retirement.
If you want to read even more analysis regarding leverage, inflation and home equity, please see our October 2013 article: Home-Buying as Investment
Real estate markets, like other financial markets, typically move in cycles:
Where you buy and sell within these cycles can dramatically affect the outcome.


