Judging by the number of houses I’ve seen being redone from the studs up, together with the number of homes that seem to be hitting the market at over $2 million these days, you’d think that Noe Valley real estate is doing very well once again, thank you very much.
I first saw this house, advertised as a fully remodelled 4 BR, 2BA, Potrero Hill View Home,” back in October 2009. With its Spanish Mediterranean, sunny yellow exterior, it had curb appeal, together with terrific if industrial views over the working end of the Central Waterfront and I-280. The main floor showed started off well, with an open layout, great sun and expansive views. I don’t recall the exact layout any more, but I do recall that a lot of the home’s square footage, including “an expansive fourth bedroom/media room” and “informal office space” were located on a lower floor basement conversion that still felt like a basement.
I like to try to guess what things will sell for when I see them on Broker’s Tour. Listed at $1,198,000, this one seemed high, even though the “stats” seemed pretty good. 130 days later, they dropped the price by $50,000. Thirty days after that, they dropped it by another $50,000. It finally sold last month, 223 days after it was first listed. Price? $1,040,000 — 13% off the original asking price.
With space so tight in SF, basement conversions are an obvious place to shoe-horn in extra space. But they have to be done right or they’ll feel cramped and dark. Most of the time, I’ll take an attic instead.
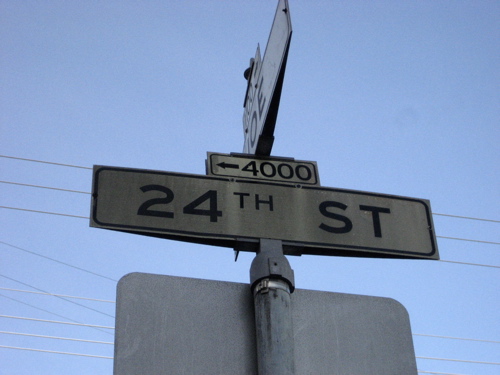
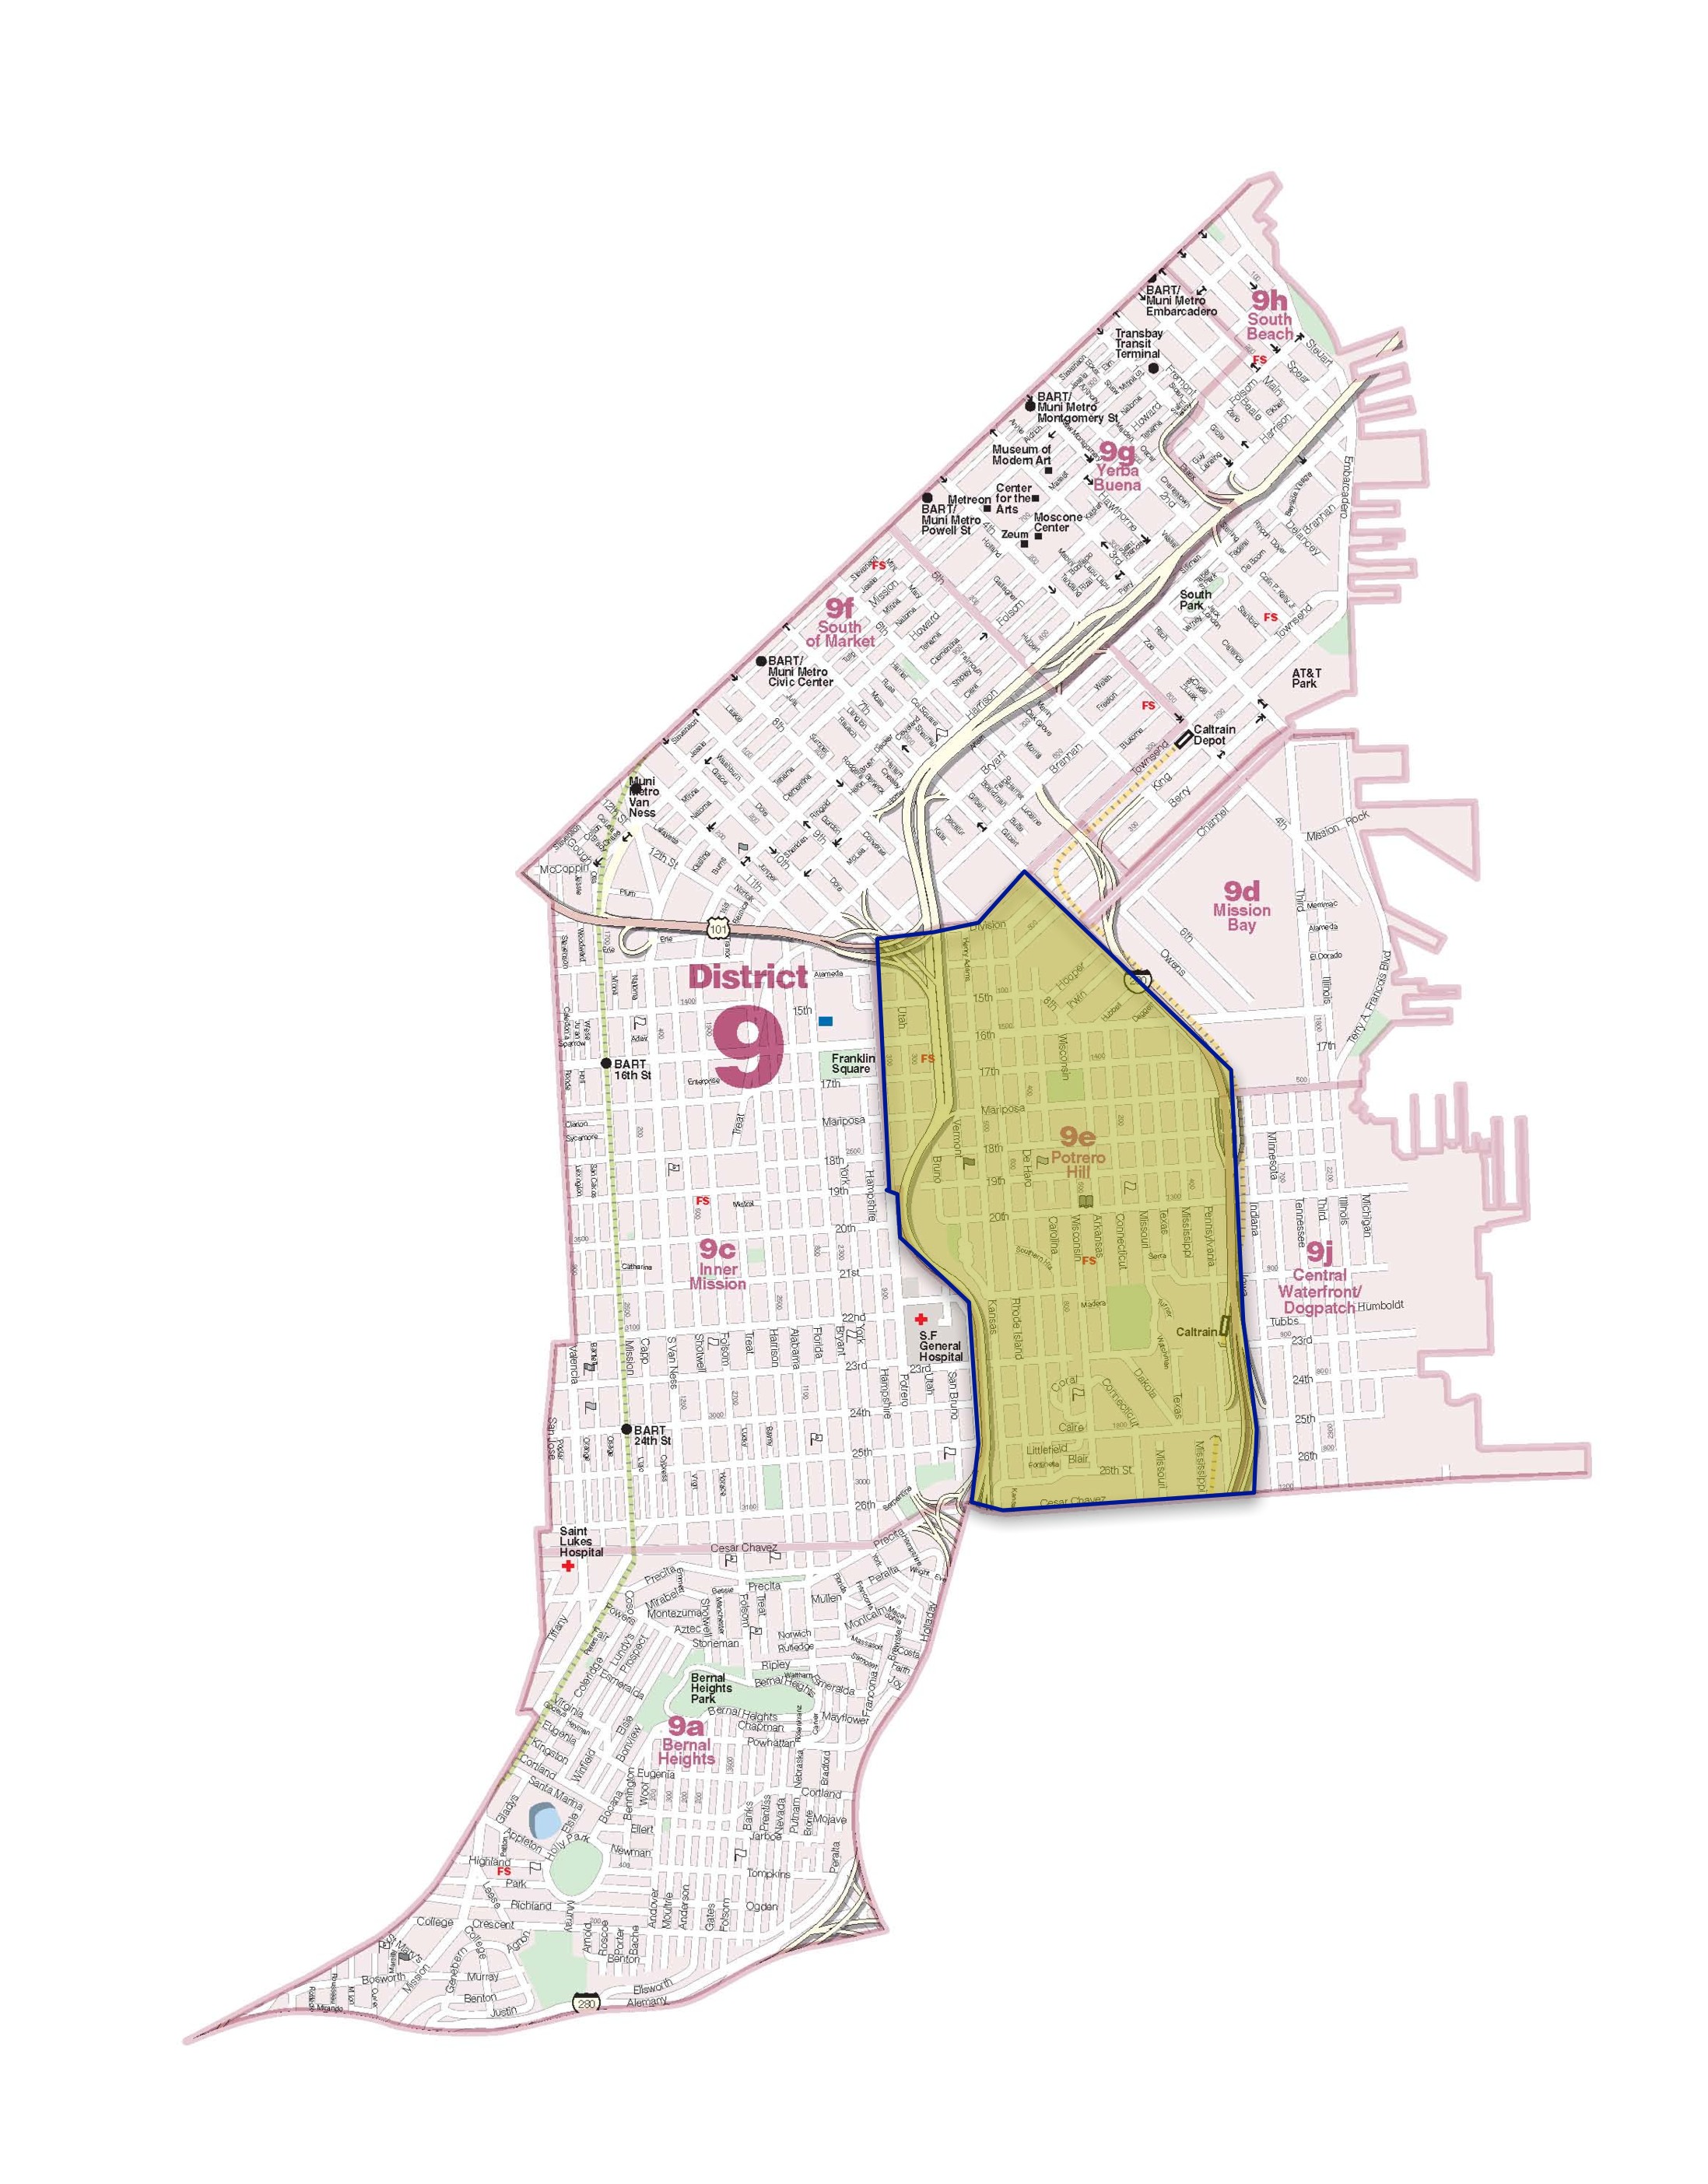
I’m currently working with a couple of clients looking for homes in the Potrero Hill District. Here, we’re talking specifically about subdistrict 9.E under San Francisco’s MLS (Multiple Listing Service).
It’s an area that roughly sits between I-280 and I-101, with Cesar Chavez at its the south end and the tangle of 101/Design District/Division at its north end. With major arteries at all ends as well as proximity to Caltrain, it’s a favorite for people who need good commute access. It’s also got some of the best weather in San Francisco. The crest of Potrero Hill sits at intersection of Carolina and 22nd Street. Homes on the “north slope” — ie. north of 22nd Street — boast spectacular views of downtown SF and the Bay and therefore fetch a premium. Potrero Hill has a small but upscalish shopping/cafe strip located on 18th between Connecticut and Texas. The recently opened Whole Foods at Rhode Island and 17th hasn’t hurt either. Architecture is a mix of broad two-story Victorians and newer modern structures designed to take advantage of the weather and the views, especially on the north slope.
Apparently the denizens of Potrero Hill like their neighborhood because there are very few sales. In fact, based on my review of sales of single family homes back to 2003, there’s an average of just 4 sales per month. Sometimes there are none at all. With so few sales each month, I’ve used averages to look at values rather than medians. Prices seem to have remained incredibly stable over a long period of time. This chart shows price on a per square foot basis (click to enlarge).
Potrero Hill SFD sales
Potrero has the reputation of being a relatively affordable area, and perhaps it is if you’re talking about Noe Valley or Pacific Heights. In June 2010, the average home sales price for the city as a whole (based on 217 sales) was $1,107,000 — about $100,000 over the average for Potrero. However, the average price per square foot for the city as a whole came in at $523 — substantially below that for Potrero. With so few monthly sales available in Potrero, I’d be cautious about drawing any conclusions from one month. As the chart trend line shows, Potrero’s price average price per square foot looks remarkably stable at around $560 currently. That seems consistent with the idea that Potrero Hill is one of San Francisco’s better, if not poshest, neighborhoods.
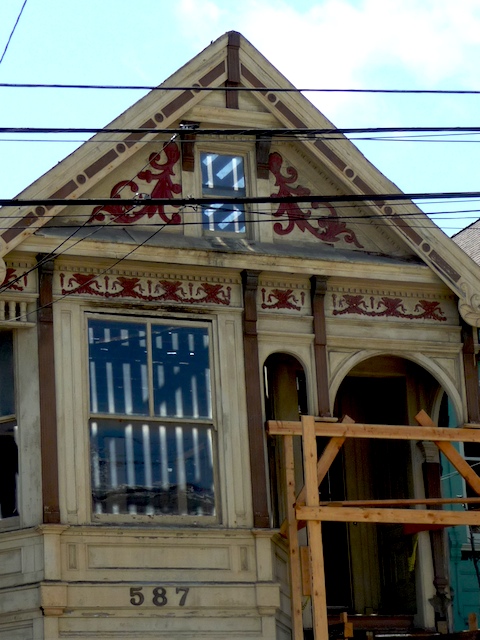
I came across this beautiful wreck during a walk in my ‘hood last autumn and snapped this photo to catch the eerie light through the windows.
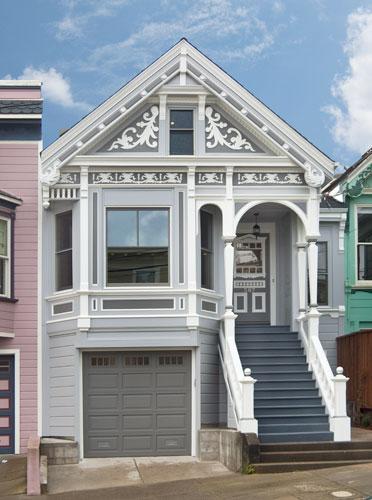
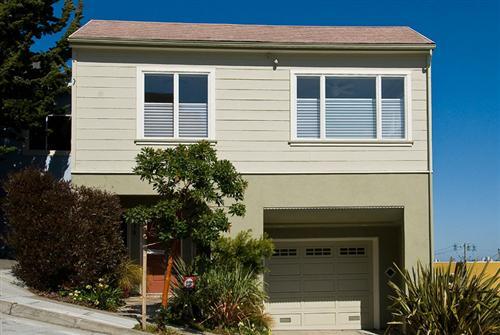
Purchased a year ago for $700,000, the 1300 sf house has grown to 4BR, 3 BA and 2462 square feet. Voila, the new 587 Jersey, just listed at a slender $1,749,000. That’s $710 a foot.
I toured the property last Tuesday and to be honest I was underwhelmed. The developers squeezed the extra square footage into the original building envelope by building out the attic and the basement. Certainly a good way to avoid all the hassle of neighborhood 311 hearings, notifications, and controversy. But at the end of the day, you’re still buying a built out basement and a built out attic. And it shows.
At long last, here’s the promised data on Noe Valley condos and TIC’s.
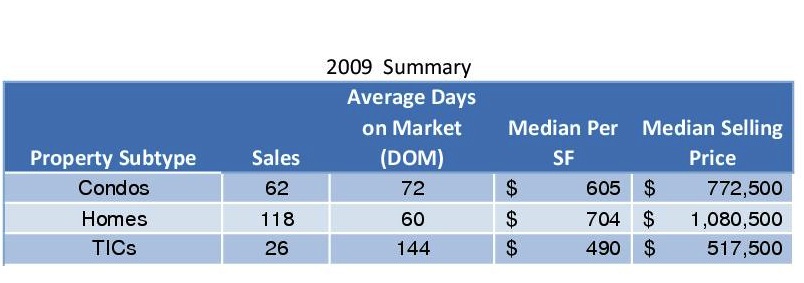
First, a look back (in anger?) at the make-up of Noe Valley sales in 2009.
Note that there were more than twice as many condos sold as TICs, and more homes sold than condos and TICs put together. (What’s a TIC? — Check out my series of posts on Tenancy-In-Common Interests, starting here.)
Also, that absurdly long DOM for TICs was distorted by 3 TICs at 201 Hoffman that took 410 days to sell. Still, without those sales, DOM for TICs (tired of the acronyms yet?) was still 99 days. And I’d be somewhat skeptical of the whopping difference in price between TICs and condos as well: TICs sales often don’t have a price per square foot listed, so there are very few data points — and there are very few sales to begin with.
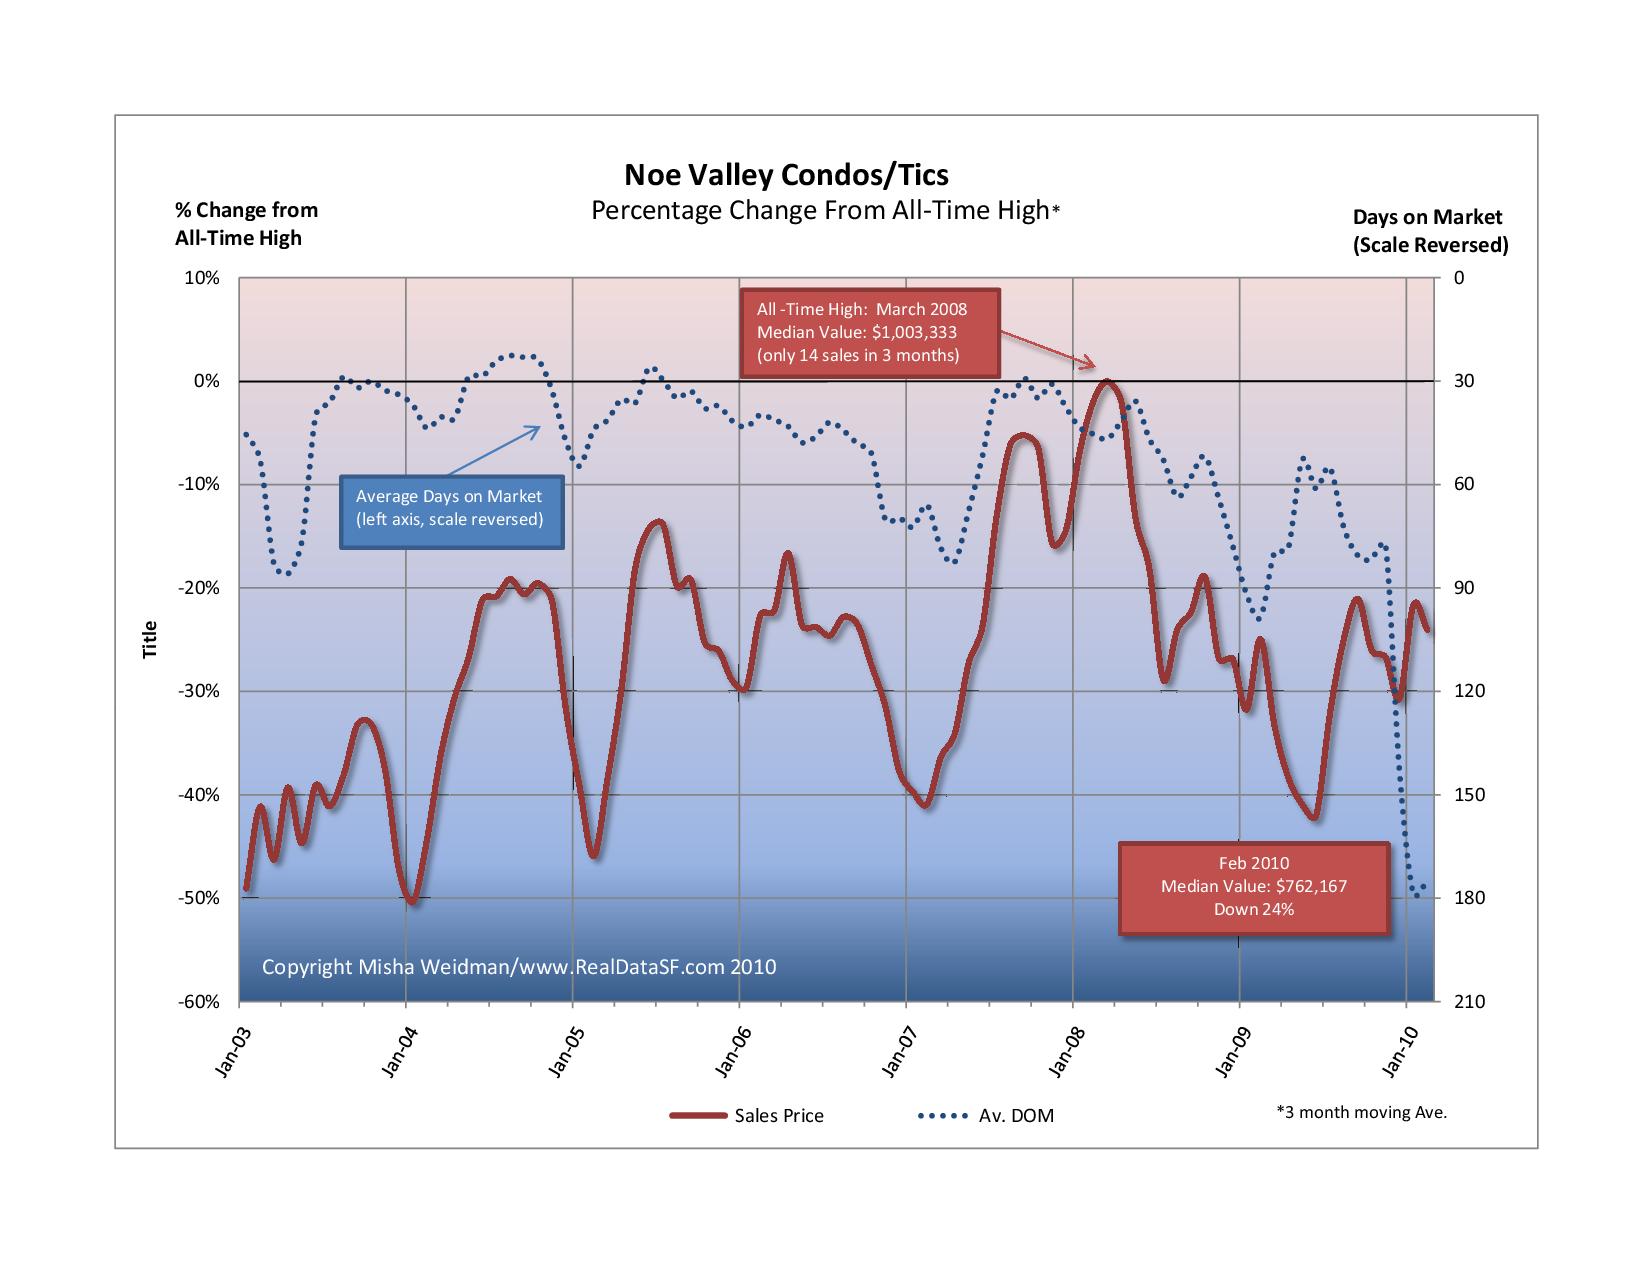
Here’s how condos and TICs have been doing as a combined group, versus their all-time highs.
That precipitous plunge (actually a huge increase since the scale is reversed) in DOM at the end of 2009 was also due to the lingering effects of 201 Hoffman.
For a shorter term view, prices through February 2010 are up 11% from January 2009 and are up a whopping 31% from the trough of June 2009. Since I use trailing 3 month averages, I think this is a belated reflection of the deep credit freeze of Spring 2009 when we thought the world might come to an end.
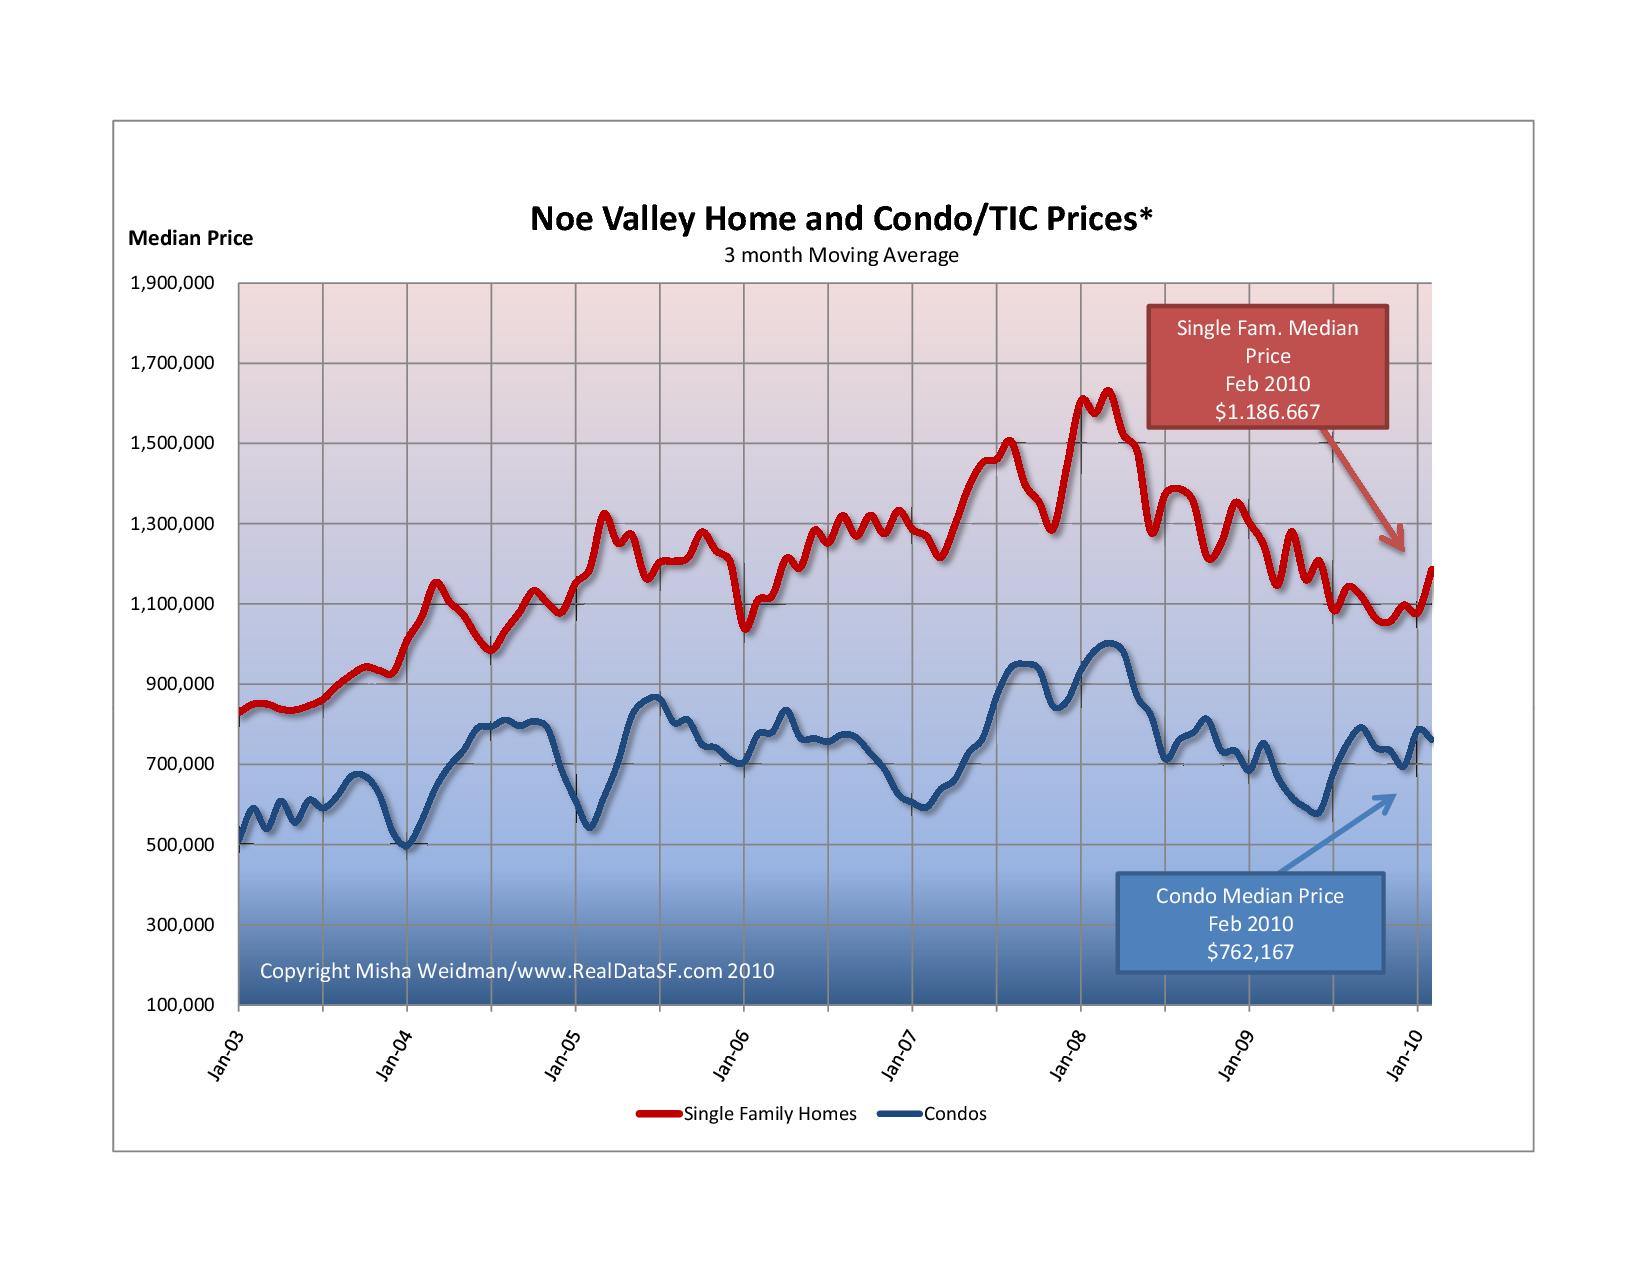
And here’s how condos and TICs stacked up against homes.
For what it’s worth, it feels like spring has really sprung. Nice-looking condos/tics are swarming with people and are moving fast — no kidding. Whether it will last is anybody’s guess.
Author: Jack French -- Used under Creative Commons Permission 2.0
Back in May 2009, I showed that Noe Valley was not immune from the slump in prices affecting the rest of the city, despite suggestions to the contrary from real estate agents, mavens and media.
Have things gotten any better? Well, no. And maybe.
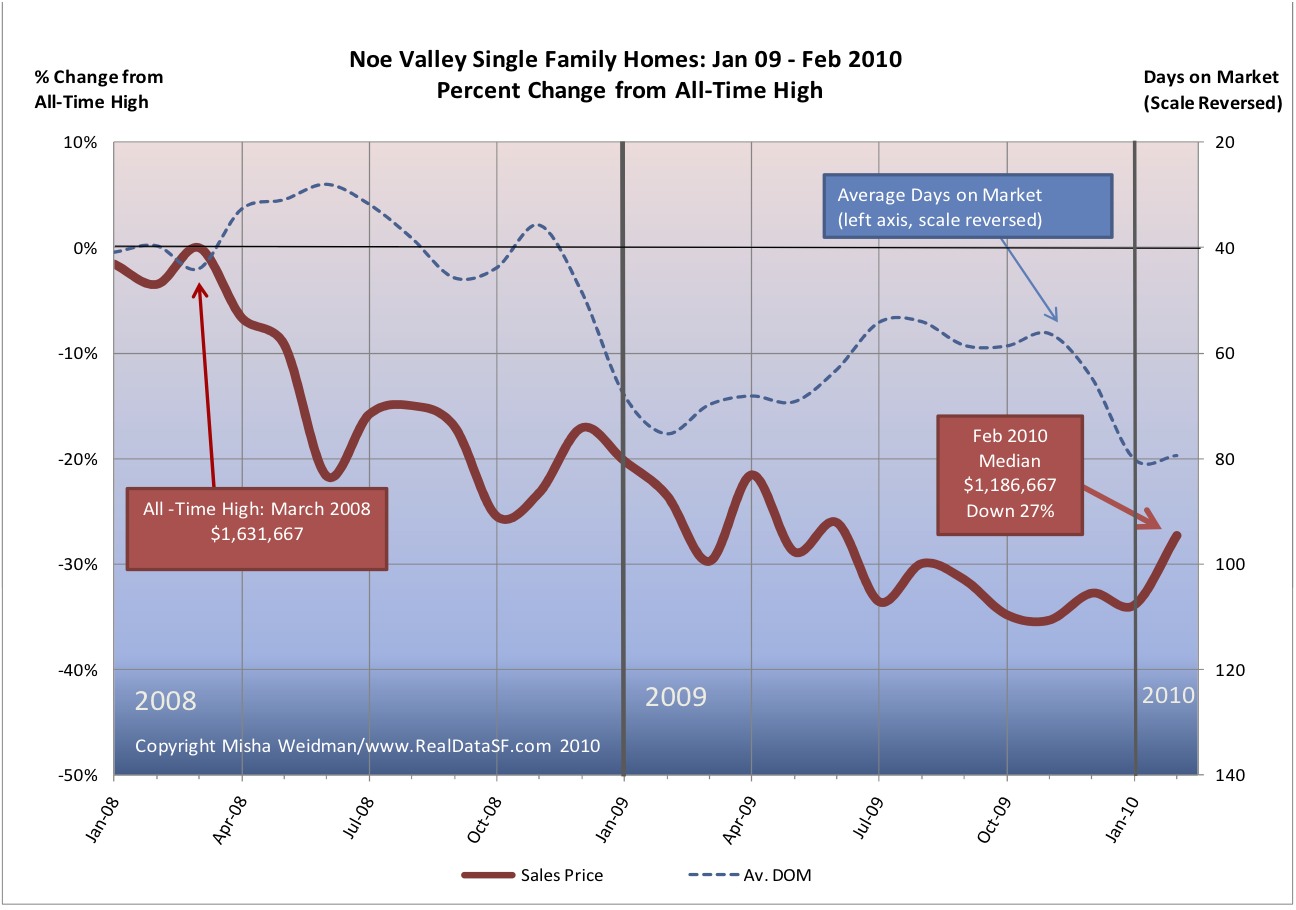
Here’s a chart showing percentage change in single family home prices for the last 14 months, relative to their all-time highs (click to enlarge). (All figures are 3 month moving averages.)
After reaching an all time high in March 2008, prices plummeted. Just a year later, in the midst of fears of a global Depression, home prices were down 30%. Did things get better? No, they got substantially worse. Despite an impressive city-wide recovery in 2009, with prices going from 30% down to around 18% down for single family homes at year’s end (see more detail here) , Noe Valley home prices continued to retreat. In October and November 2009, prices were down 35%. At year’s end, they’d barely clawed back two percentage points. Not surprisingly, days on market (DOM) remained stubbornly high for all of 2009.
Still, with cherry blossoms busting loose all over Noe Valley’s quiet streets, there certainly seems to be a change in the air. There are many more listings coming onto the market and there’s even the occasional feeding frenzy over a clean, well-priced home. These go in a matter of days, not weeks. Maybe that upturn in prices for January and February suggests a continued warming trend.
In the next few posts, I’ll look at Noe Valley in more detail, including how condos have fared.
Catching up on the endless paper-work the other night, I came across that rare thing: a property that sells twice in a relatively short time with no major renovations performed in the interim.
This “sales matching” technique is what the folks at Case-Shiller use to create their Indexes of property values across the country. Part of the reason they can is that their indexes are generated for large Metropolitan Statistical Areas with lots of house sales. And even so, they use a lot of fancy foot-work to “match up” properties.
So now comes 714 Duncan Street, a beautiful 2,000 sf view home on a steep hill with fantastic city views. Listed at a disarming $1,195,000, it sold for $1,415,000 in January 2008. That was pretty much the top of the market for Noe Valley. (You can see the chart here.)
Fast-forward 18 months. The same house sells for $1,095,000 in June 2009. That’s a drop of 22.6%. My analysis of all Noe Valley sales for the same period shows a drop of just under 25% for the same period.
There’s something of a “duh, so what” to this story. But I’ve seen enough nay-sayers (on other blogs, of course!) who argue that tracking statistical medians are meaningless that I thought it was worth posting this as a powerful—and sobering — case to the contrary.
Author: Jack French -- Used under Creative Commons Permission 2.0
As I mentioned in my previous post, I’ve had several questions about per square foot prices recently. There’s no doubt that it’s a very useful metric, for the obvious reason that it allows you to get closer to an “apples to apples” comparison of the value of two different properties that are different in size. Of course, that leaves all sorts of other variables — location, amenities, etc. But if, say, you’re looking to make an offer on a property, certainly you’d want to start by looking at what other properties in the same area have been selling for on a per square foot basis, and then use that to see if the property you’re interested in is in the ballpark.
Since I live in Noe Valley, I’ll readily admit that I tend to follow my neighborhood more closely than other areas. No great surprise there. So here, without further ado, is a chart showing the price per square foot for single family homes in “core” Noe Valley (click to enlarge).
Rather than run the chart as Percentage Change From All-Time High, as I usually do, this simply shows price per square foot as a 3 month moving average. I’ve added the “number of sales” per month, plotted on the right-hand axis as well. Note that low monthly sales volumes ( no surprise, given the small geographic area) will make the data less statistically reliable. In most months, there are less than 15 sales.
While we’re on the subject of sales volume, I recently read an advertisement in the local rag, The Noe Valley Voice, from a local real estate company touting how sales volume in Noe Valley is up, compared to San Francisco as a whole. So what? As I’ve stated before in the context of the luxury home market, I really haven’t found any correlation between volume and price. Though it may be a little difficult to tell from this chart, I don’t see it here either. For example, sales volumes were down and falling during the autumn months of 2007, but that’s when prices started climbing towards their all-time high in early 2008. Likewise, sales volumes were increasing through the first 6 months of 2008, even as prices were sliding.
The bottom line is that Noe Valley homes are still fetching north of $700 a square foot, and that’s after a protracted slide. Sure, the price per square foot is down substantially from the near- $900 a foot that they hit back in January 2008, but it’s a pretty well-heeled foot nonetheless.


