Scoping Out: Noe Valley

dxm7PKoLcU9pTqqOU3TRvGK7pKpKswaXcIf7fL7MiFY

We aren’t sure if winter will ever arrive, but while the forecast calls for mid- 60′s and partly cloudy skies, it’s perfect weather for strolling through one of your favorite San Francisco neighborhoods. Whether you’re jones-ing for a pick-me-up from Philz Coffee, looking for that perfect dress at Ambiance or just want to grab lunch and take it to a park, Noe Valley is just the place to enjoy our “not-so-winter” winter.

NV-Map2


Source : http://www.parascopesf.com/noe_valley

What’s Happening in San Francisco in 2014? A LOT!

Header

It’s hard to believe it’s already 2014! There’s such an abundance of events throughout the year in our amazing city, where does one begin? Well, we have something to help get you started. So before you book up your weekends, check out our handy event calendar to give you some inspiration. (CLICK ON THE IMAGE TO EXPAND).

Unknown

Source : http://www.parascopesf.com/whats-happening-in-san-francisco-in-2014-a-lot/

Real Data SF January 2014 Newsletter: The 2013 Real Estate Wrap-Up

1

Photo courtesy of  loicphoto.com

San Francisco Bubbles

Happy New Year one and all!  While much of the rest of the country was just beginning to come out of its long recessionary swoon, our little piece of heaven enjoyed its second full year of a booming sellers’ market, fueled in no small part by what appears to be a decisive shift in venture capital to our local zip codes.  Those much-despised Goo-hoo buses are no accident.  Take a look at this instructive chart from an August 2013 piece in The Atlantic entitled “Why San Francisco May Be the New Silicon Valley”:

2

The Atlantic, August 5, 2013

Add to those sparkling … er, bubbles… SF’s home-grown biotech and medical innovation companies, a resurgent financial sector, and several years of pent-up demand, and it’s no surprise that the Urban Land Institute placed San Francisco at the top of its list for places to invest for the second year in a row.  (You can download the full ULI report here.)

Taking Stock

Let’s begin with some perspective.  What does the San Francisco real estate market really look like?  Our venerable market guru put together this chart from a number of sources.

3

The numbers are approximate, but the chart shows that there are only about 125,000 housing units that are owned rather than rented.  That’s less than a third of SF’s total stock of around 425,000 units. Is it any wonder that renters are such a powerful force in San Francisco?

What People Bought

Now let’s look at what people bought last year.  The chart below shows that around 5,000 homes and condos traded hands, with condos leading the way by a few hundred units.  (These numbers don’t include “off-market” sales and sales of condos in new buildings, which sometimes are not reported through the MLS.Only 320 TICs changed hands.

4

As you’d expect in San Francisco, the vast majority of homes sold were built pre-1950, if not pre-1940.  For condos it’s the reverse.  What’s telling in both cases, however, is how little “brand new” construction there is, especially for single-family homes.There were just 16 sales of “brand new” homes reported through the MLS last year. It’s no wonder, then, that these homes fetch a premium.

5

You can find much more detail about what people bought in 2013, from average house size by neighborhood to the views they saw out their window, here at my blog.

Where?

Where did the sales occur?  Around 20% of all home sales were in District 10, a large geographic area of economically modest neighborhoods that fared the worst during the housing crunch.  By contrast only around 5% of home sales occurred in the toney northern districts that include the Heights and the Hills.    As a result, median home values for the city as a whole are likely to be skewed to the lower end of the scale.

6

For the rest of the city, the map shows sales pretty much occurring where you’d expect them to:  lots of condos downtown and South of Market; lots of single family homes in areas like District 4 with its “Terrace” neighborhoods (Ingleside, Balboa) dating back to the 1920’s; a mix in District 5, which includes the always popular Noe and Eureka Valleys and the Castro.

How Much?

City-wide, 2013 saw home and condo prices definitively exceed the pre-bust highs they’d reached in late 2007/2008.  There was a rapid run-up in the spring and summer, with a slow-down later in the year.  Some of the slowdown is undoubtedly seasonal; from what I’ve seen so far this year, there are a lot of people still chasing a very limited supply.

7

What these city-wide numbers don’t capture, however, is the huge rebound at the top end of the market.  If you define “luxury homes” as those selling for $2 million or more, that segment took off like a rocket at the start of 2012. I’d argue that this is where you see the effect of all those start-up upstarts that are now living and working in SF.

8

And I believe that the top end is pulling the rest of the market up with it.  As more and more people are being priced out of their first choice, other neighborhoods formerly perceived as less desirable are crashing through their previous price ceilings. One example:  Glen Park, a perennial second fiddle to Noe Valley, is suddenly studded with $2 million homes. Here’s a look at how a few neighborhoods have done.

9

For a comprehensive analysis of other neighborhoods and segments, take a look at the full 2013 wrap-up posted on my blog, where you’ll find no less than 17 charts.

The Crystal Ball

The economic news certainly seems more positive than it was a year ago.  Even if (I should say “when”) the Fed stops printing money and interest rates go up, people smarter than I am have said that it will likely have a minimal impact on the stock market.  The new high-rises that we see being built all over the city aren’t going to be online anytime soon and not everyone wants to live in a dowtown condo anyway.

The bottom line is that it’s hard to see any serious risk of a downturn in real estate values in the coming year.  What may happen, though, is that we will reach something of a plateau where prices stabilize for a while.  Have we reached that point yet?  Probably not. I’d say this sellers’ market  has a ways to run, albeit at a less frenzied pace.

As always, your comments and suggestions are much appreciated.  Please forward this email to anyone you think would enjoy reading it!

2014 – January Market Report

San Francisco Real Estate: Looking Back, Looking Ahead

The real estate market recovery started in earnest in 2012 and then went white hot in spring 2013, which resulted in a huge jump in home prices. In the last six months of the year, the market calmed somewhat and prices generally stabilized, but buyer demand remained very strong by historical standards. Economic conditions have continued to improve, household net worth has increased dramatically with rising stock and housing markets, rents remain very high, new construction is soaring and interest rates, after jumping in 2013, are still relatively low. Though it is impossible to predict the future, these factors typically form the foundation of a healthy, active housing market.

In the next few weeks, new listings will start coming on market, buyers will get back in home-search mode and the market will begin to wake up after the holiday hibernation. Then we’ll start to get an inkling of what the new year has in store.

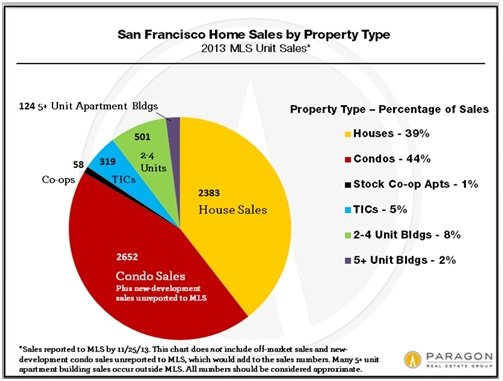
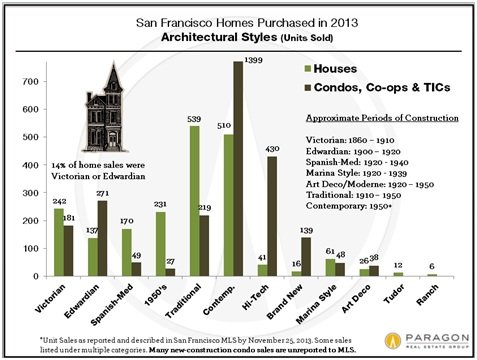
If you missed our survey of what San Francisco homebuyers bought in 2013, you can find it here: 2013 Market Survey. It was reported on by SFGate, KGO Radio and other major media.

1968-2010_US-CA-SF_Median_Price

This first chart above gives a longer-term overview of city, state and national real estate price trends. Though varying by neighborhood, San Francisco has generally made a complete recovery from the market decline suffered in 2007-2011. Some city neighborhoods surged to new peak values in 2013.


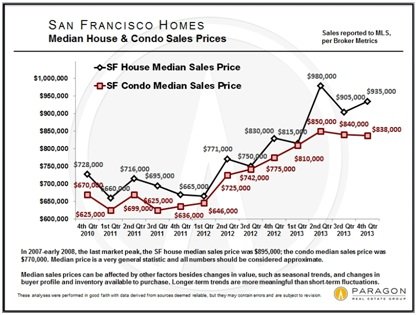
This chart below tracks San Francisco median prices by quarter, illustrating how the rebound in values progressed in steps since the recovery began.

Median_SFD-Condo_by-Qtr_Short-term

And below, home value changes for Bay Area higher priced homes are charted over the past 2 years according to the S&P Case-Shiller Home Price Index.

Case-Shiller_High-Tier_2011

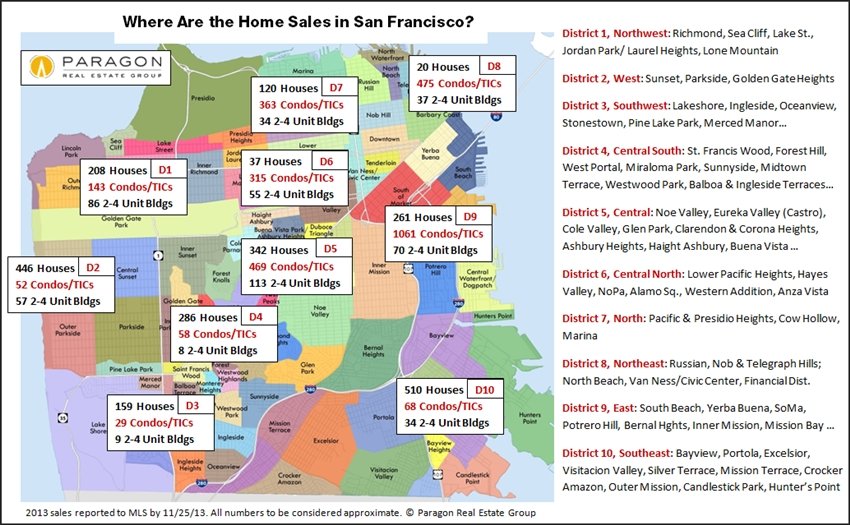
Total Home Sales by Year (below).

The quantity of sales in the past two years has been severely constrained by an inadequacy of inventory to meet demand. This, of course, is also a major factor behind price increases.

SF_Total_Unit_Sales_Since_1994

San Francisco Luxury Home Market

A major component of the recent recovery has been the terrific resurgence in luxury home sales. There are 3 main factors involved: firstly, the affluent have benefited most from the big surge in financial markets, which makes them feel even more affluent; secondly, our local high-tech boom has minted a large number of newly wealthy homebuyers; and finally, the simple increase in prices moves a certain number of home sales into the price categories we typically define as luxury ($1.5m and over for condos, co-ops and TICs; $2m and above for houses).

Lux-Homes_Units_Sold_by_YEAR

2013_LuxHome_Condos_by_District

2013_LuxHome_SFD_2000-4999_by-District

2013_LuxHome_SFD_5m_by-District

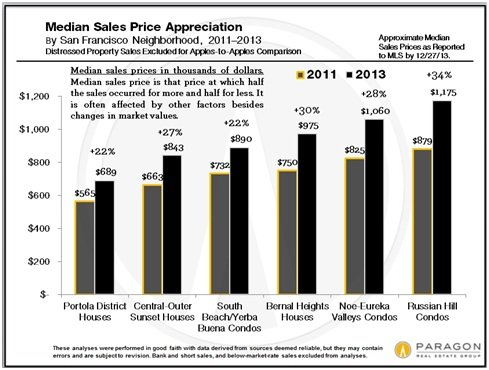
Home Price Appreciation by Selected Neighborhoods

This chart measures increases in median home prices over the past two years for a number of SF neighborhoods. Median price changes are not exact correlations of value changes, but give an approximate range of appreciation, in this case, about 25% to 30%. Distressed home sales were not included in this analysis as they typically do NOT reflect fair market value; if they had been included, several of these neighborhoods would show much greater percentage price increases since 2011.

2011-2013_Median_Price-Appreciation_Lw

And this chart below looks at median sales price appreciation in a few higher priced home segments. Here, we also added the change in dollar per square foot values (though not reflected in the chart columns). Note that appreciation rates between median prices and dollar per square foot can vary in the same neighborhood, which emphasizes that these are general statistics best used for indicating trends and delineating the range of value changes.

2011-2013_Median_Price-Appreciation_hgh

2013: Peak & Plateau

This chart is a bit complicated, but illustrates the differences in the heat of the market between 2011 and 2013, and, specifically, the peak of the market frenzy in the second quarter of 2013. In the second quarter, almost every statistical measure reflected the hottest market in recent memory: fewest price reductions and expired listings, lowest days on market, highest percentage of sales over list price, lowest interest rates in history, and so on. In the two quarters after, the market slowed and plateaued, but remained quite strong – as one can see by comparing them with 2011.

Percentages-Without_Reductions_Expireds-Comp

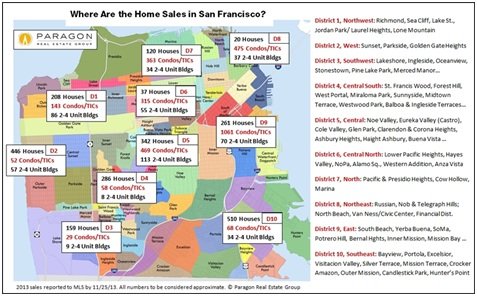
Selected 2013 Neighborhood & District Snapshots

SOMA-SB-YB-MB_Sales-by-Price

South Beach-SoMa-Yerba Buena-Mission Bay

Above is a look at the biggest condo market segment in the city, where the vast majority of new condo construction has occurred and is continuing to occur. Condos of every price range are found here, including a very substantial ultra-luxury component with extremely high dollar per square foot values (and typically with utterly spectacular views).

Potrero Hill, Bernal Heights and Inner Mission markets

Potrero-Bernal-Mission-Price-Range

Noe-Eureka-Cole Valleys District Snapshot

An overview of house, condo and TIC sales in this very hot central district of the city.

District_5-Price-Range

Pacific & Presidio Heights, Cow Hollow and Marina

The highest house prices in the Bay Area.

District_7_Sales-by-Price-Range

Russian, Nob & Telegraph Hills

Some of the most expensive condos in San Francisco are located in this district.

Russ-Nob-Tel_Condos_by-Price-Range

Mortgage Interest Rates

2014 started with a 30-year conforming interest rate of 4.5%, which is about a full percentage point above the historic lows one year ago. This affects the cost of homeownership significantly (if one is getting a loan), but the rate is still quite low in the context of the past 30 years.

Average_30-Year_Mortgage-Rates

San Francisco Housing Units: Inventory By Property Type

After investigating with the Departments of Planning and DPW, their inventory and pipeline reports, U.S. census data, MLS data, Andy Sirkin, NAHB and a half dozen other resources, we came up with the following estimates about San Francisco housing inventory:

Housing-Inventory_by_Property-Type

Additional findings:

  • 124,000 housing units are owner occupied. About 4% to 4.5% of San Francisco houses and 6.5% to 7% of condo, co-ops and TIC units are sold annually.
  • 222,000 housing units are rented out and 25,000+units are vacant at any given time

* These are very approximate estimates based on data from the U.S. Census, the SF Depts. of Planning & Public Works, MLS and other sources deemed reliable.

Source : http://bit.ly/1cDO22d

Great Dickens Christmas Fair – December 22, 2013

PG-DF09_0564_RVT_Salscouple

The Great Dickens Christmas Fair is a one-of-a-kind holiday adventure into Victorian London – an elaborate party with hundreds of costumed players performing and interacting with patrons in over 120,000 square feet of theatrically-lit music halls, pubs, dance floors and Christmas shops.

It’s a twilight evening in Charles Dickens’ London Town; a city of winding lanes filled with colorful characters from both literature and history. Enticing aromas of roasted chestnuts and hearty foods fill the air. Cries of street vendors hawking their wares ring out above the bustling crowd. Dozens of lamplit shops are filled to overflowing with Christmas gifts. The Dickens Christmas Fair is a treasured Bay Area tradition since 1970 and a splendid way to celebrate the holidays.

Four weekends including the Friday after Thanksgiving: November 29th through December 22nd, 2013 from 10:00 AM to 7:00 PM PST
Cow Palace Exhibition Halls, 2600 Geneva Avenue, San Francisco
General Admission, $25. Student/Senior/Military, $21. Children 5-11, $12. Children Under 5, Free. Groups of 15 or more, $17. Pickwick Club (Fair season pass), $60.

For more information go to www.dickensfair.com/

What SF Homebuyers Bought in 2013: A Survey

Penthouses, Mansions, Short Sales & Fixer-Uppers

What Did San Francisco Homebuyers Buy in 2013?

Views, prices, architecture, neighborhoods, property types and sizes, parking, probate sales and appreciation rates: We data-mined all of San Francisco’s 2013 sales reported to MLS through the end of November and charted the results below.


Sales as described in and reported to San Francisco MLS by 11/25/13. All data herein is from sources deemed (at least somewhat) reliable — i.e. the information input by listing agents regarding their own listings — but may contain errors and is subject to revision. These charts do not include sales unreported to MLS, such as the sale of many so-called “pocket listings” and many of the new-development condo sales that occur.