Signs of a Slowdown? The Economist Doesn’t Think So.

The chart below appeared recently in The Economist along with an article describing a new prediction model that they’re trying out (you’ll have to have a paid subscription to see the article). They point out that globally, in most countries, homes have made back most of their losses sustained in the Great Recession. That’s true of the U.S.

Nor are they predicting a major correction during the next year or so. Their conclusion: “The most likely scenario is that the rally has room left to run.”

Here’s the news locally in San Francisco according to our latest market report (text or email me for a complete copy): “High stock markets, low interest rates, surging luxury home sales, limited inventory, a spring full of unicorn IPOs, and San Francisco – once again – hits new highs in median home sales prices.” The median house sales price was $1.7 million in Q2 2019.

At the same time rates of appreciation have stuttered a bit in recent quarters. Whether this is because we are reaching a “top” or whether these backward-looking statistics are simply reflecting the hangover from the stock market turmoil that occurred in Fall 2018 is anyone’s guess. Stay tuned.

Which San Francisco Neighborhoods Have Appreciated the Most?

A client of mine recently opined that he thought that Pacific Heights and other luxury neighborhoods were “overdue for a bump” in home prices. He thought that well-heeled Millennials and Gen-Z-ers were neglecting the north side of the city in favor of hipper locations like Mission/Valencia Street, Duboce Triangle, Hayes Valley and, of course, the perennial favorite Noe Valley.

As someone who has lived and worked in SF for over 30 years, I’ve witnessed my share of cycles where people bid up the “up and coming” neighborhoods (Bernal Heights is the poster child) as they get priced out of their “A-list” neighborhoods. However, when the market turns down, those same neighborhoods tend to get hit hard as buyers shift their attention back to their first choice. So, my hunch was that over the long-term, neighborhood appreciation rates would be about the same.

It turns out that I’m mostly right. The chart below shows both total appreciation and compound annual appreciation for various neighborhoods in the city within their MLS (Multiple Listing Service) Districts over the last 20 years.


While the Inner Mission and Bernal Heights have in fact appreciated more and faster than elsewhere, most city neighborhoods are right at around a 7.5% increase year over year. This fits with my general view that you could buy a single family home pretty much anywhere in the city and do alright over the long-term.

Why? First and foremost, SF is always going to be a popular place to live – notwithstanding its challenges. Secondly, single family homes are a shrinking part of the housing market. “Land,” as Will Rogers famously said, “they ain’t making any more of it.” The city’s stock of single family homes is constrained by geography – but demand continues to grow.

In fact, as I’ve described elsewhere, sales inventory is actually falling as more and more people choose to “age in place” for financial and lifestyle reasons.

But back to our first chart and rates of appreciation. The big exception is the cluster of luxury neighborhoods in MLS District 7: Pacific and Presidio Heights, Cow Hollow, and the Marina. Here, the rate of appreciation is significantly lower than elsewhere. Why? Well, consider that the base starting price is significantly higher. Back in 1998, you needed $1.6 million to buy a house in those neighborhoods – three to five times what you needed for other neighborhoods. I’m no economist, but I suspect that these neighborhoods will always approach the upper limit of what people are prepared to pay for a home. There’s simply less headroom for them to move up in price.

It’s also worth remembering that cumulative appreciation over a long period can obscure short-term fluctuations, as the following chart shows. That’s why I generally counsel my clients not to buy a home if they’re not planning on holding onto it for at least 5 to 7 years.

Here’s a comparative look at median home price trends in select neighborhoods, updated through 2018.

And while I believe that it is folly to base an offer on statistical averages for “list” to “sale” prices, the following chart does reflect which neighborhoods are seeing a lot of buyer interest. Here’s the takeaway: just as you’d expect in a mature “up” market, it’s the more affordable neighborhoods that are seeing the highest level of interest as buyers are priced out of the more expensive ones.

I have a comprehensive table of median home prices by neighborhood and bedroom count for every MLS District in the city, updated through May 2019, as well as a similar table for condos.  Unfortunately, there’s no easy way for me to display it in my newsletter.  If you’d like a PDF of the table or are curious about a specific neighborhood, please email me and I’ll be happy to send it to you.

As always, your questions, comments and referrals are much appreciated!

Misha

235 Berry Street #112 | “Just Sold”: Listed $1.45, Sold $1.6

235 Berry Street #112

Exceptional Mission Bay Town-Home

Come take a look at this rare and fabulous 2BR/2.5 BA town-home before it “goes live” on MLS! Enter through your private south-facing gated patio right off the quiet walkway that runs between Berry Street and the Mission Creek Esplanade. On the main level, you’ll find new broad-plank, natural finish engineered wood floors. Bright new w/w carpet upstairs. Freshly painted throughout. Custom closets in the both bedrooms and peek-a-boo views of the creek from the second bedroom. Plus full-sized, in-unit W/D; extra closet space; and a convenient assigned parking space located near the unit.

Enjoy all the pleasures of one of SF’s newest, most thriving, and commuter-friendly neighborhoods. Walk your dog along the Esplanade. Get your coffee at Phil’s. Shop at Guss’s market. Imbibe some of the best weather SF has to offer and cosy up to Giants and Warriors!

“Just Sold”: Listed $1.45, Sold $1.6

Please visit: 235berry-unit-112.com

Spring has Sprung: How about the SF Housing Market?

First, let me thank everyone for their positive feedback on my last newsletter regarding Unicorns, IPO’s, big press headlines, and the likely effects of all of that on San Francisco home prices.  With Lyft down 30% from its opening price, Uber looking less “über alles”, and the stock market gyrating on news of a trade war – or just, um, war – we are already in the realm of larger forces potentially swamping whatever IPO effect was so breathlessly anticipated. 

That said, after a very slow start to the typically strong spring season – and by “strong” I mean heavy buyer demand and higher prices – the residential market has notably recovered from the “weakness” of the last half of 2018.  (For more on that, check out my 2018 Real Estate Wrap-Up.)

And let’s be clear about what I mean by “weakness.”  Real estate sales typically cool during the winter months after Thanksgiving anyway.  In 2018, the “cooling” might have started a little earlier in the autumn  — exacerbated by a volatile stock market – and continued longer into the new year – perhaps as a result of all the rain we’ve had — but overall the last couple of quarters don’t look significantly different from a year earlier.  Median house prices reached an all-time high of $1.7 million in February 2018; we haven’t surpassed that point for a year now, but with March and April results hovering at around $1.65, we are not far off either.  And to put this into further perspective, Spring of 2018 was one of the hottest Spring markets in SF history.

The table below shows the same thing broken down by many key metrics.  “Negligible change” seems to be a fitting description.

“Word on the street” suggests a mostly positive environment, especially at the more affordable end, and especially for single family homes, which are an increasingly small share of the market.  Open houses are well-attended; those properties that “check the boxes” are receiving multiple offers, though more frequently by the handful than by the dozen as was the case a few years ago.  At the more expensive end of the market – let’s say above $4 million for single family homes — properties are sitting a little longer and listing agents are complaining that buyers are increasingly picky – they want a “move-in” ready home.  For $4+ million you can hardly blame them.

Below are some general metrics on various neighborhoods grouped by MLS District for both single family homes and condos. Note that these are for the preceding 12 months so they do not reflect any short-term movements.

As always, your questions, comments and referrals are much appreciated.  And please consider following me on Facebook, LinkedIn, Twitter and/or Instagram as I intend to post short pieces on items of interest on a more frequent basis than this once-a-month newsletter.

All the best,

Misha

The IPO Thing: Will Lyft and Uber take Real Estate Prices for a Ryde?

I don’t think I have ever been pinged so often as I was shortly after the New York Times published “When Uber and Airbnb Go Public, San Francisco Will Drown in Millionaires.” In the Styles Section, no less.  Certainly, the idea that San Francisco, where so many IPO companies are headquartered, could see upward pressure on home prices makes sense.  As the NY Times article notes, there were only about 5,600 home sales in San Francisco in 2018 and less than half of those were single family homes.  So it makes intuitive sense that a few thousand newly minted millionaires could move the market with their new-found fortunes. (I made the same point months before the NY Times article but sadly they didn’t quote me.)

The reality may be more nuanced than the attention-grabbing headlines.  In February, Zillow published its own analysis of what it described as “the Facebook Effect.”  It tracked home price increases back in 2012 after FB went public in census tracts with an unusual number of FB employees and found that “every 10 Facebook employees living in a given census tract at the time of Facebook’s IPO in May 2012 were associated with an additional 1.6 percentage points of home value increase over that year.”   Bay Area wide, census tracts with a particularly heavy presence of FB employees saw home price increases of 21% vs the non-FB heavy tracts of 17%  between March 2012 and March 2013.

That 4% difference is nothing to be sneezed at, and I can see people rubbing their hands as they point out that the Uber IPO alone will dwarf FB’s, not to mention the effect of all the other smaller IPOs (see below).  And they could be right, particularly if, as is likely, so many more of the IPO companies have concentrations of employees in the tiny geographical area called San Francisco than was the case with FB’s IPO back in 2012.

But Zillow’s takeaway is notably cautious:

“While we still expect this year’s tech IPOs to impact the local housing market, it may be more about easing the fall than acting as a springboard for accelerated future growth.”

And that’s approximately where I come out.  While the significant new influx of money cannot be ignored, it is just one factor at play among other forces.  Those include:

  • What happens to the value of those IPO stocks after they go public?  (Lyft opened at $88.60 and closed today at $67.40 –  a drop of 24%.)
  • What’s happening to the economy and employment generally?
  • What’s happening to interest rates?
  • What’s happening in the real estate market overall?

I’d venture to say that while the fate of the IPO stock price may most directly affect both the pocket-book and, equally importantly, the confidence of the new home-buying millionaire, the other three factors will have a much broader influence on home prices over the course of the next few years. 

Here’s a hypothesis for you (and please post your thoughts here to continue the conversation):  If the market warms up again after going a bit cold at the end of 2018 (see my last newsletter), the IPO effect will accelerate price growth in the city, as the nouveau riche have the means and confidence to buy up what they want.  However, if the market continues to slow,  the IPO effect may soften the decline but not by much.

Why?  When a property is perceived as being over-priced, people just don’t want to overpay.  Nobody wants to be taken for a chump — even when they can afford to be.

And, speaking of young and upwardly mobile, take a look at this great new townhome in Mission Bay that I will be bringing to market this week-end. Absolutely perfect 2BR/2.5 BA pad, right off Mission Creek, in one of the hippest, most vibrant neighborhoods in the city: www.235berry-unit-112.com.

As always, your questions, comments and referrals are much appreciated!

Misha

“What Goes Up Just Might Be Coming Down.” The 2018 San Francisco Residential Real Estate Wrap-Up

Off to the Races

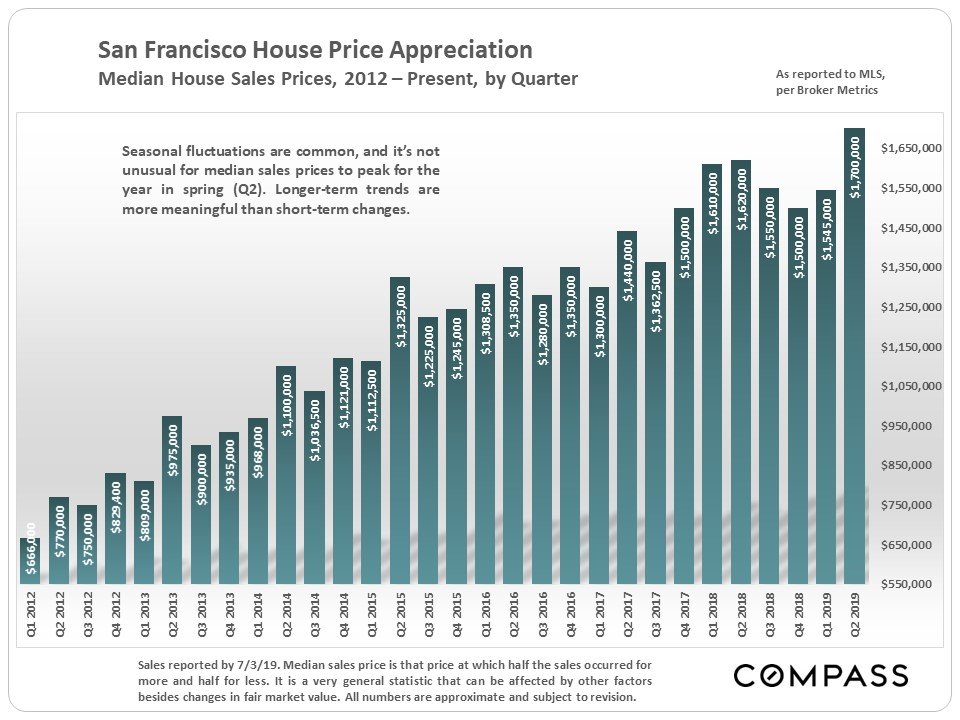
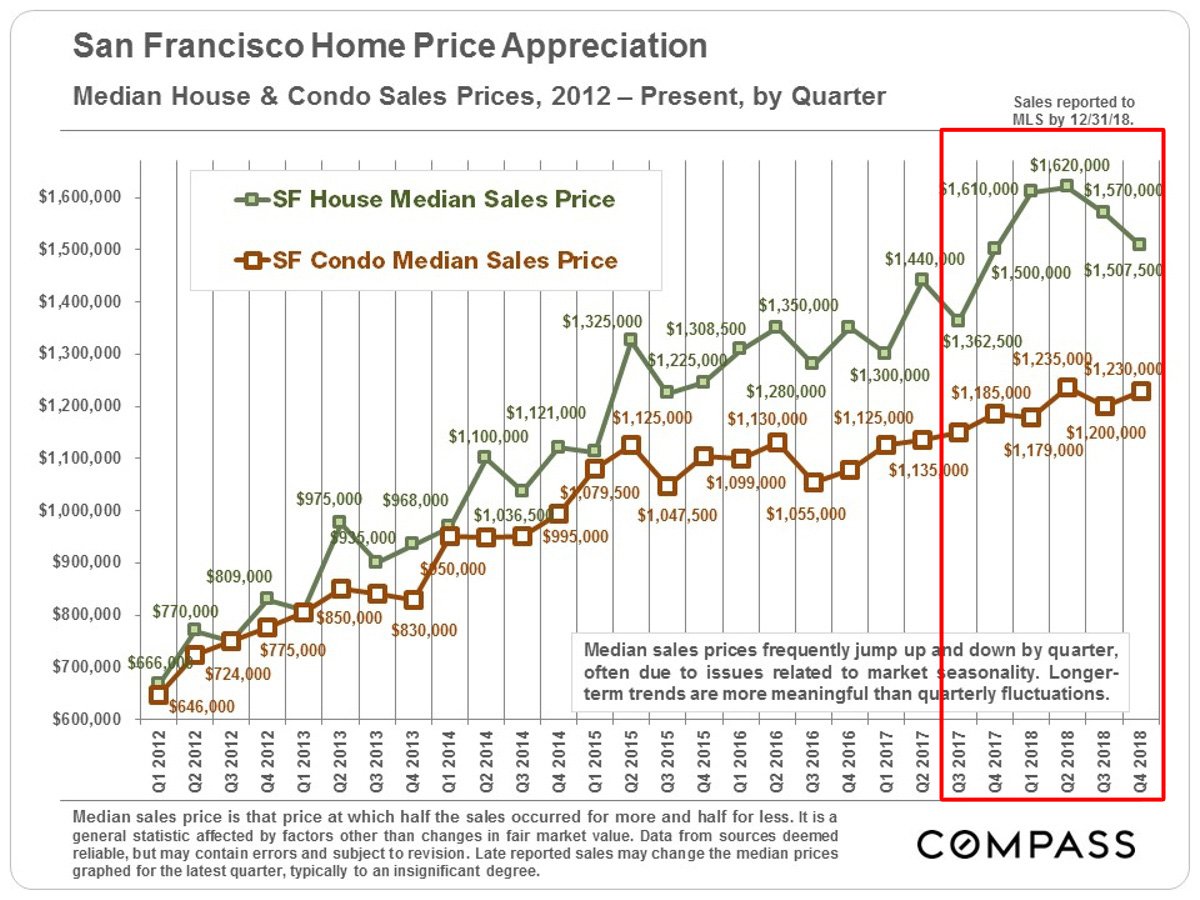
In 2018, San Francisco’s median house sales price was $1.6 million.  That’s an increase of 13% over the previous year.  Meanwhile, the median condominium sales price increased about 5% to $1,210,000.

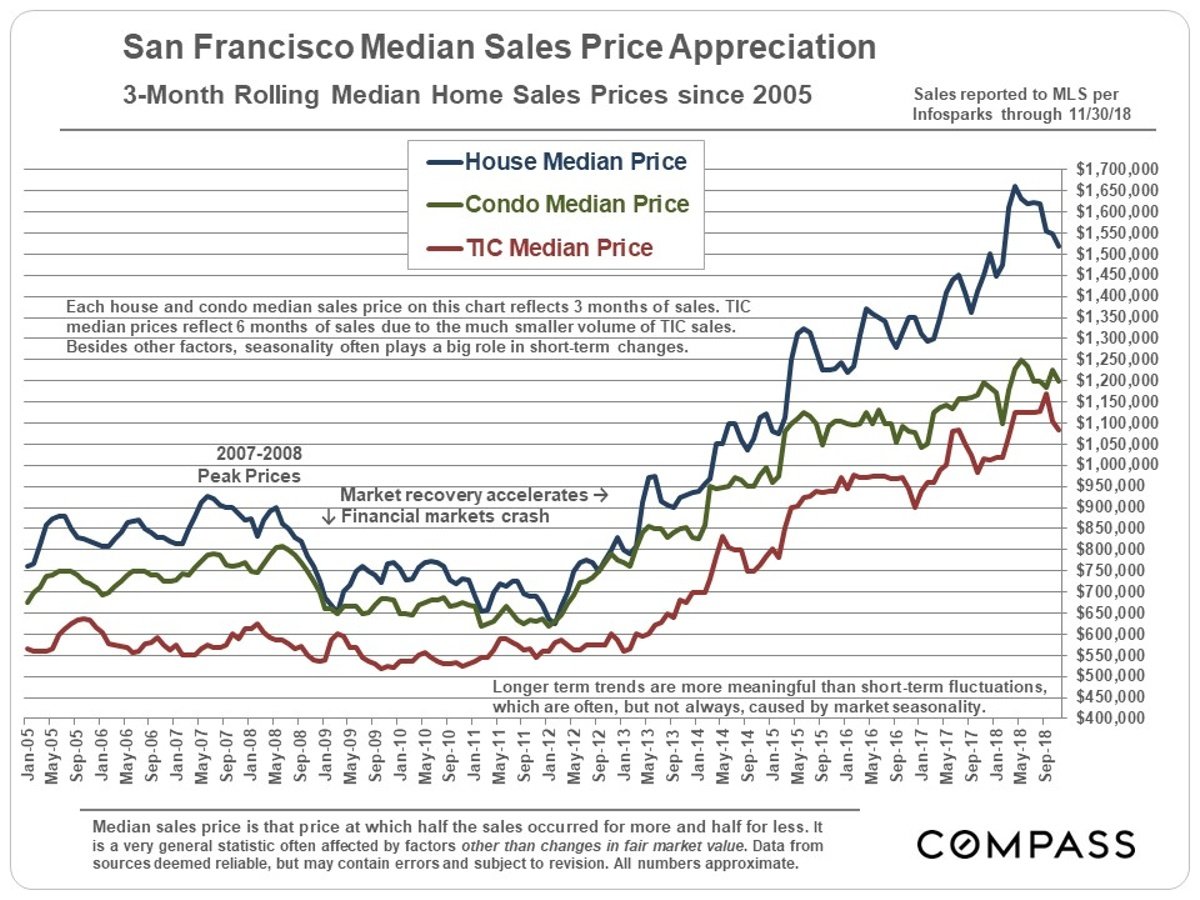
If the chart above was the only one you consulted on SF real estate, you could be forgiven for thinking that since the 2012 recovery from the Great Financial Crisis, the city’s real estate prices have been rocketing inexorably upward. 

Slow Finish

But you’d be wrong.  As Mark Twain said, quoting Benjamin Disraeli: “There’s lies, damn lies, and statistics.”  In 2018, the year had two very distinct halves.  And if you don’t look at the statistics for those two halves, you’ll miss the real story here – which is that single family home prices fell precipitously over the last two quarters. The chart below shows price changes by quarter.

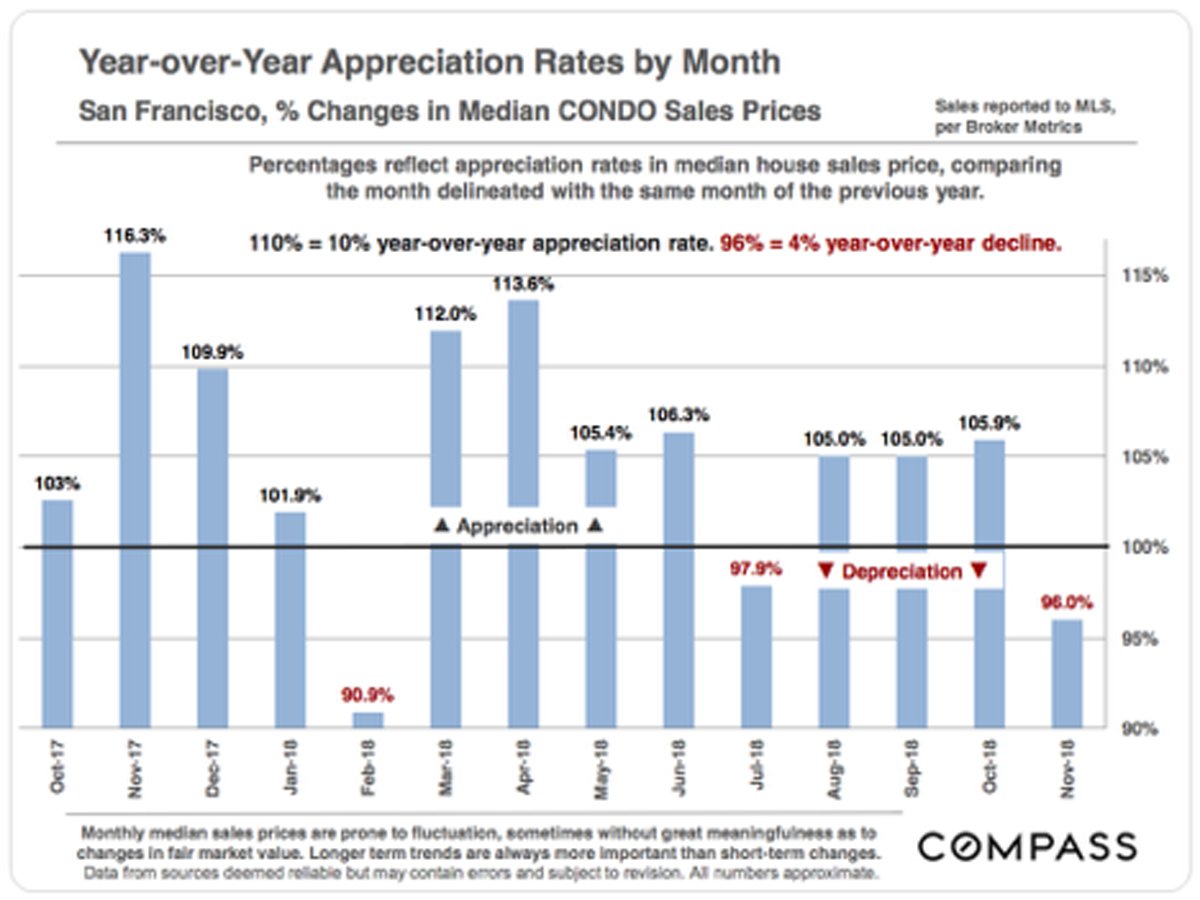
In a nutshell, the median price of a single family home in the last quarter of 2018 was essentially the same as it was a year earlier – $1.5 million.  Homes lost $120,000 in 2 quarters.  That’s a 7% drop in value.  (Condos, meanwhile, remained basically flat.)

While our Chief Market Analyst, Patrick Carlisle, judiciously hedges his bets by pointing out that quarterly fluctuations are not unusual and also reflect seasonal variations, other data also supports the notion that we may – operative word, “may” – have reached some sort of inflection point. 

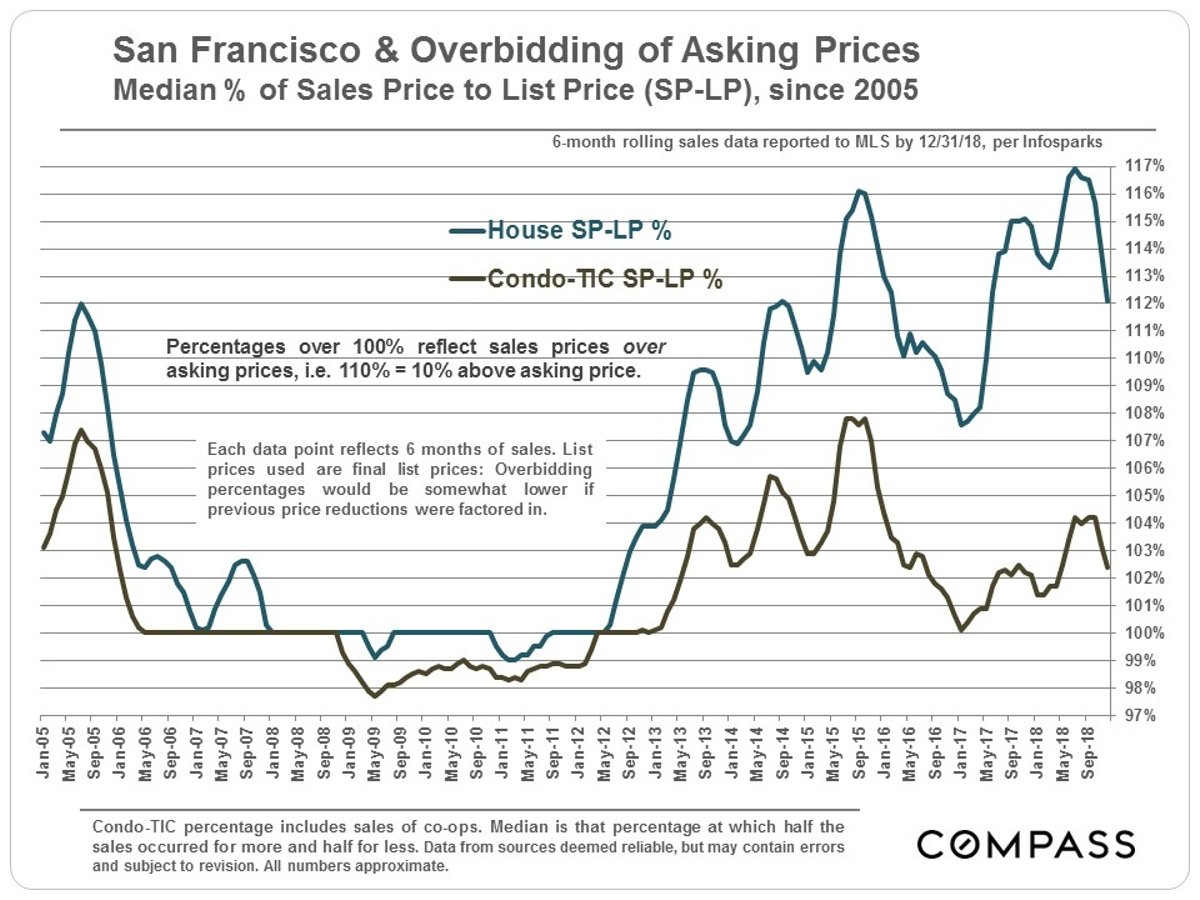
Less Frenzied Over-Bidding

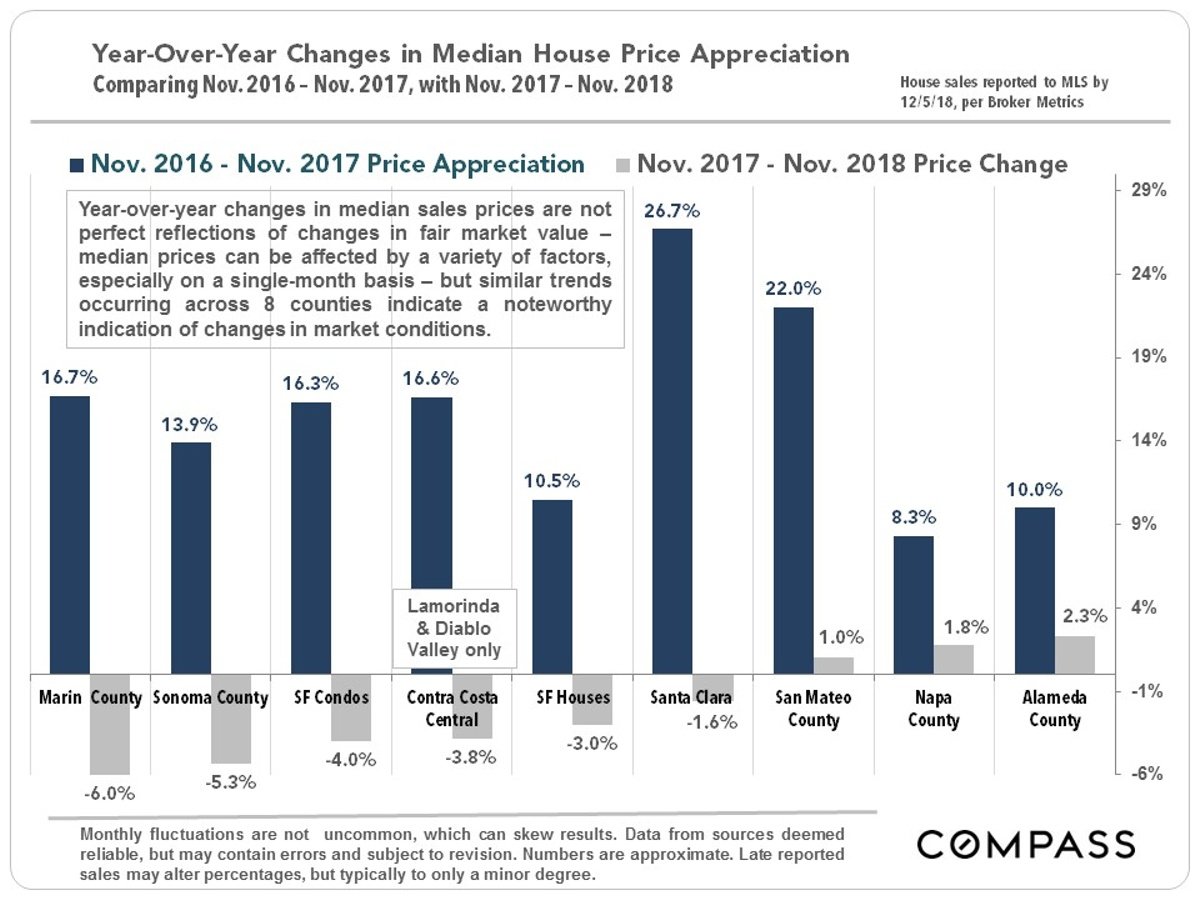
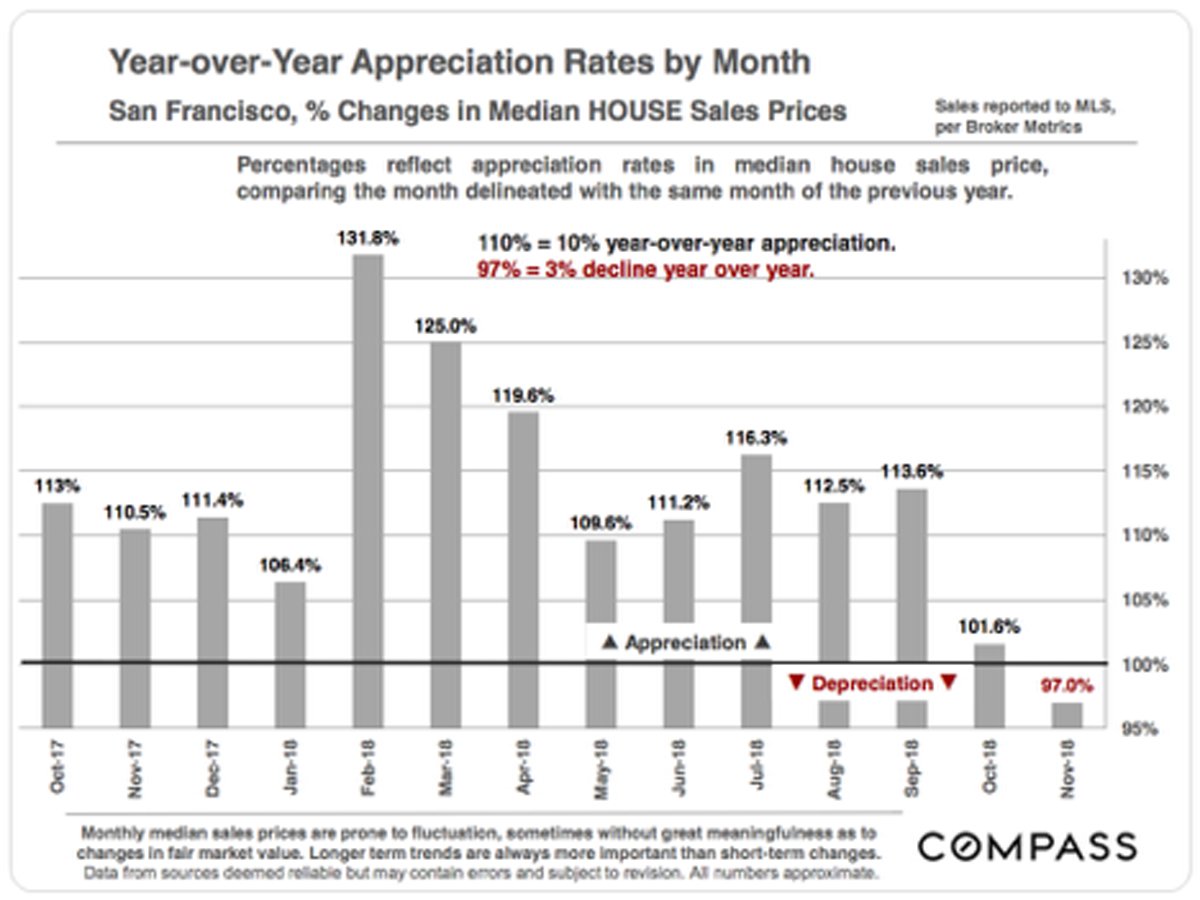
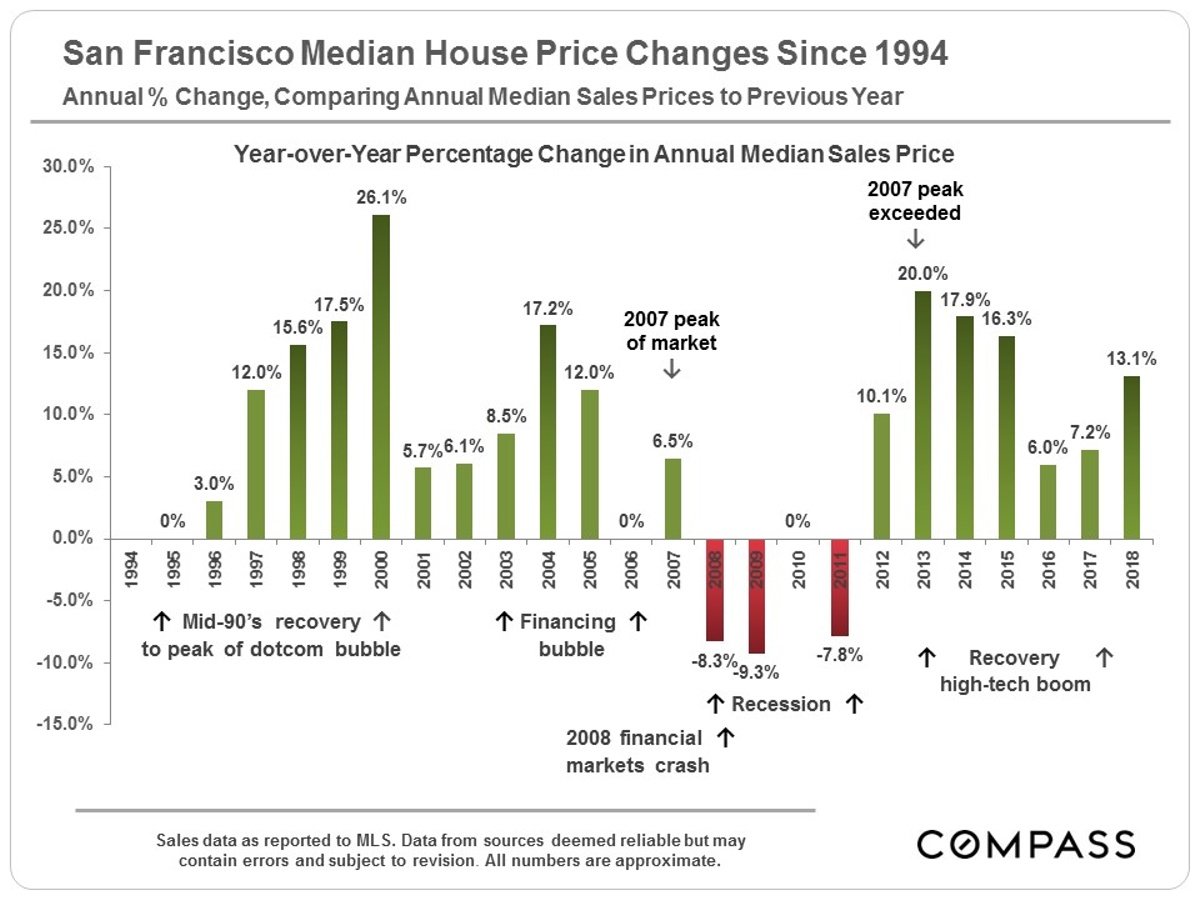
For example, “overbidding” – the difference between the list price and the ultimate sale price – dropped dramatically for single family homes in the last half of the year, even though it remains at high levels.  Interestingly, the last time overbids declined significantly was from late 2015 through 2017; that may correlate with the massive drop in annual appreciation for 2016 and 2017 to single digits, whereas the previous three years’ returns were between 16 and 20% (see second chart below).

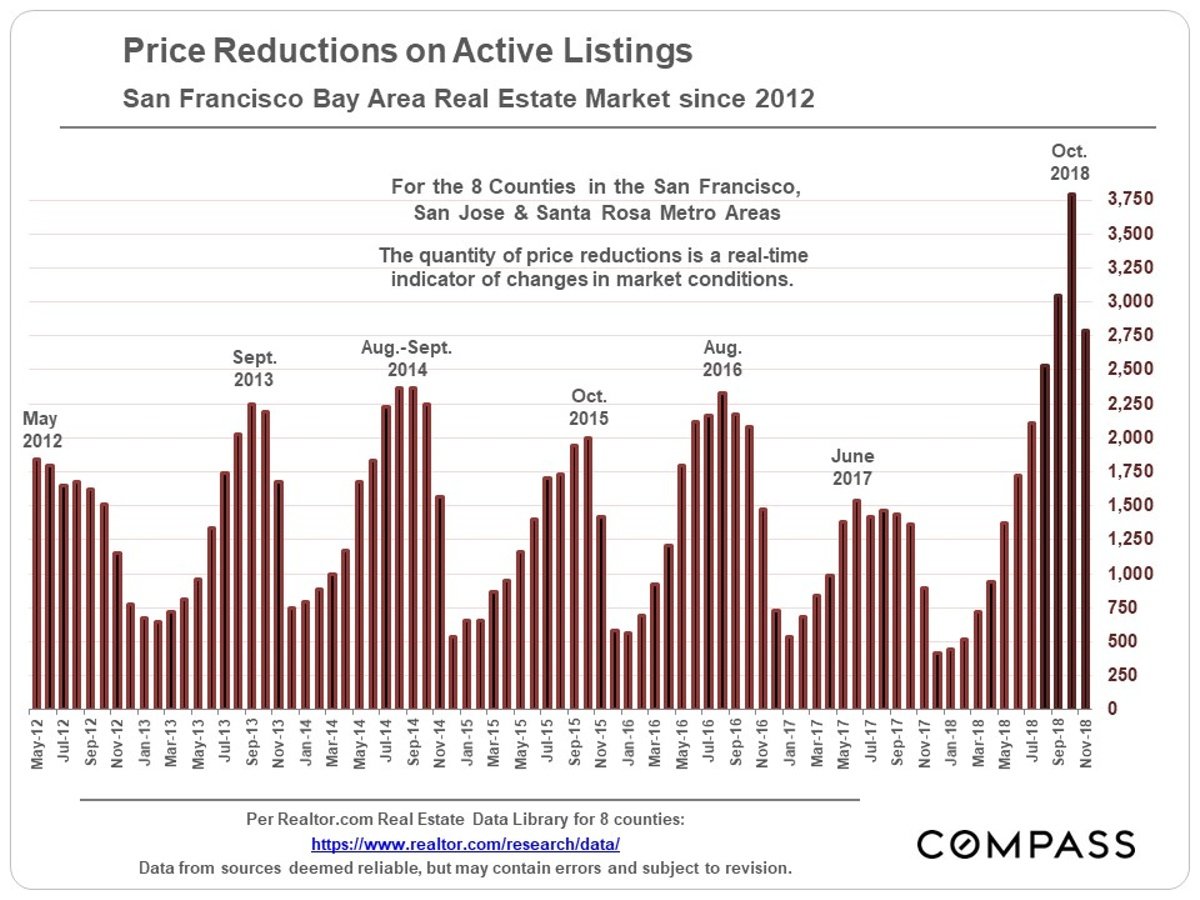
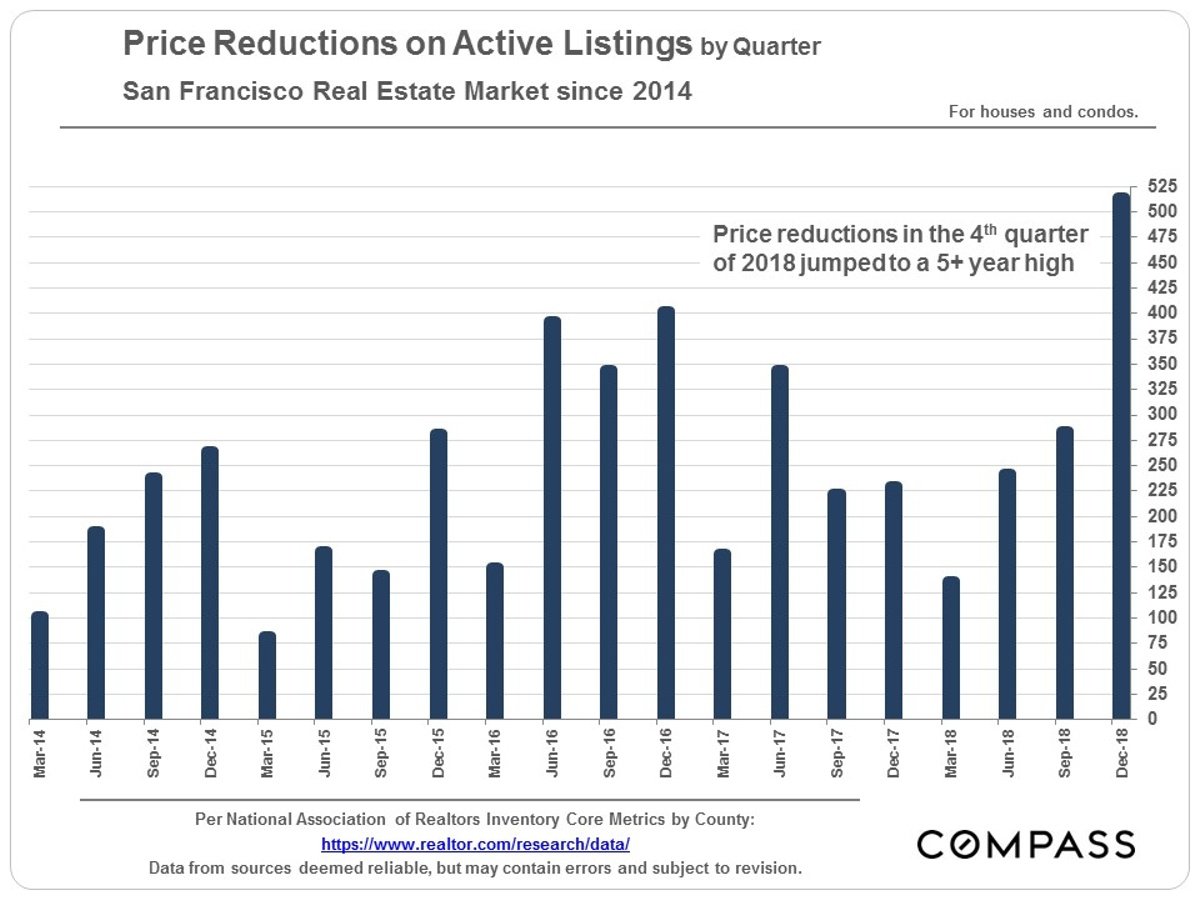
More Price Reductions

Another indicator: Price reductions in the fourth quarter hit their highest levels in over five years.

Still, Mixed Signals

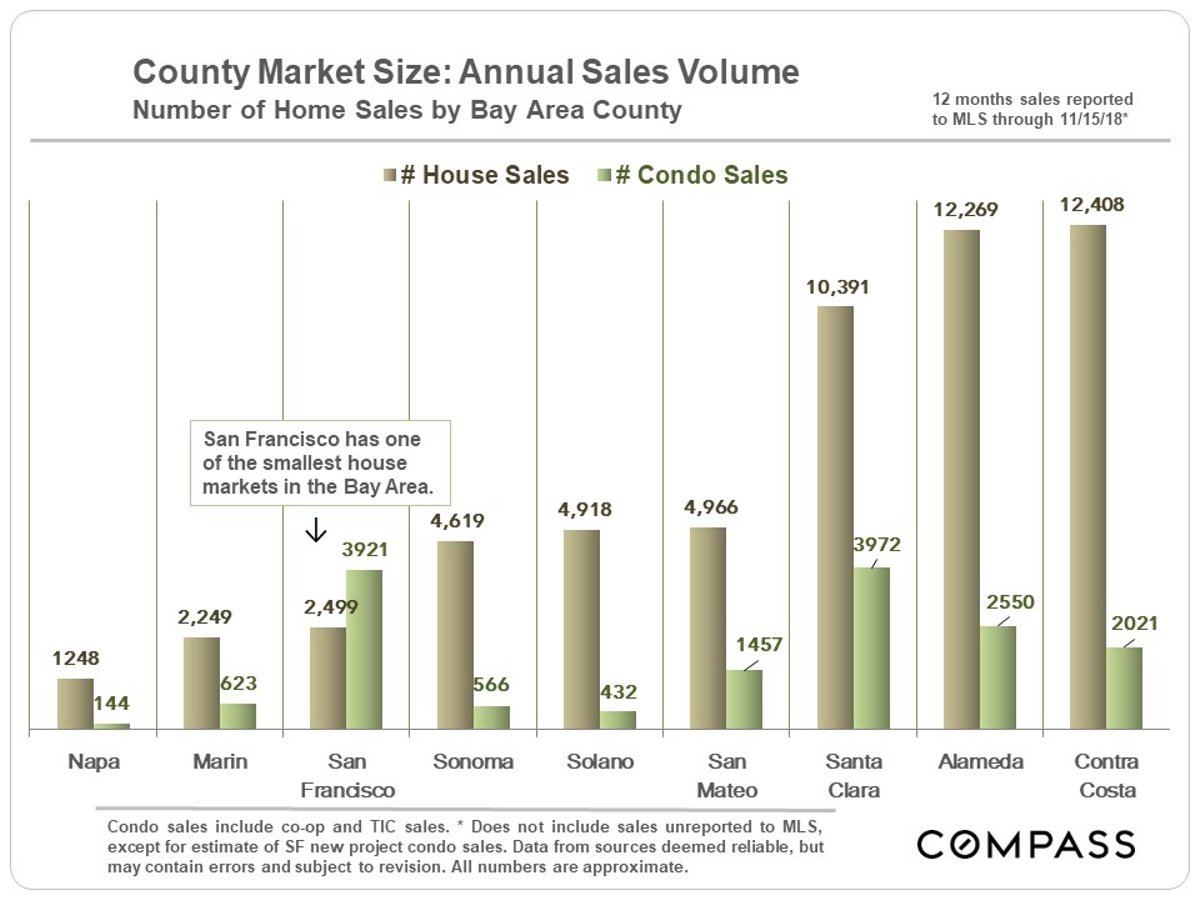
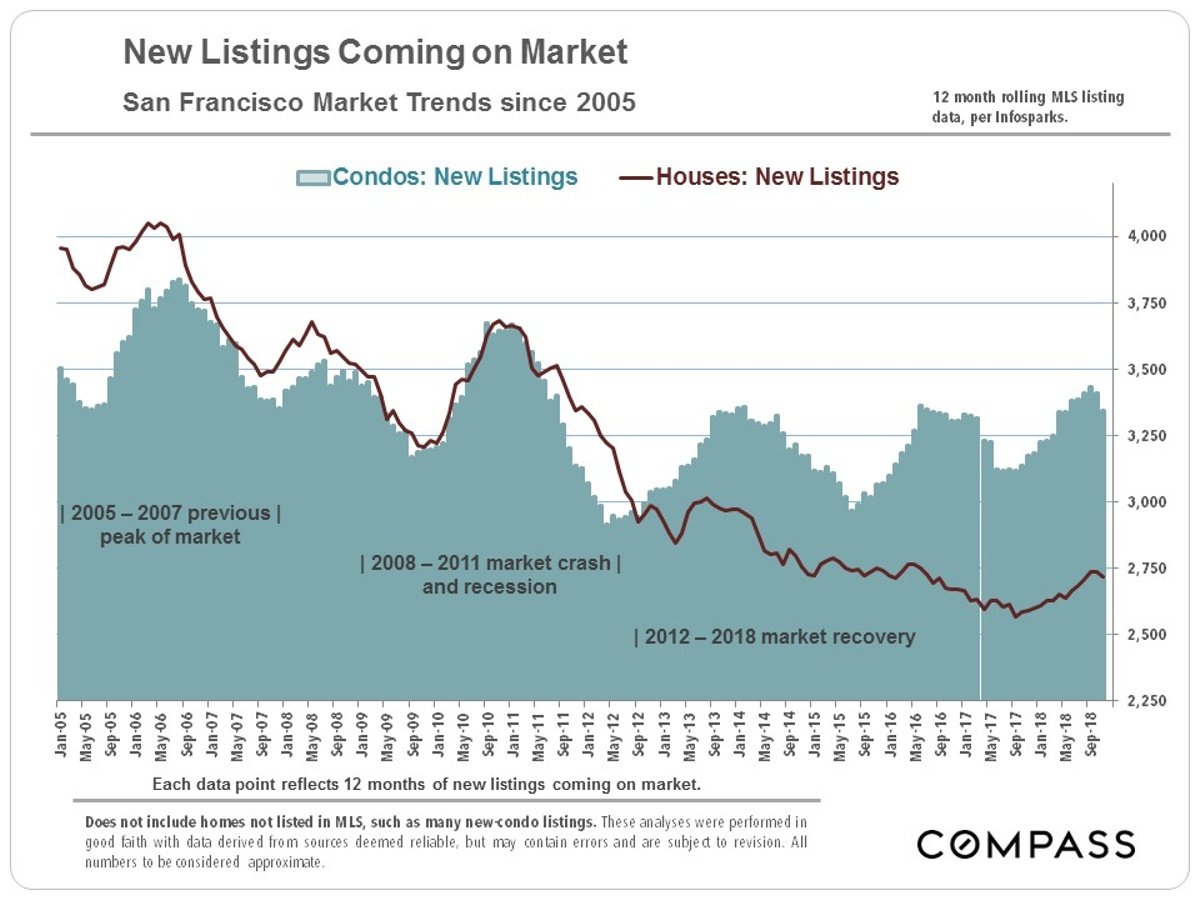
Not all the statistics point clearly to a softening market.  For starters, supply remains constrained and at historically low levels.  I’ve described this elsewhere as a secular shift, reflecting, perhaps, an aging population that chooses to age in place rather than to move.

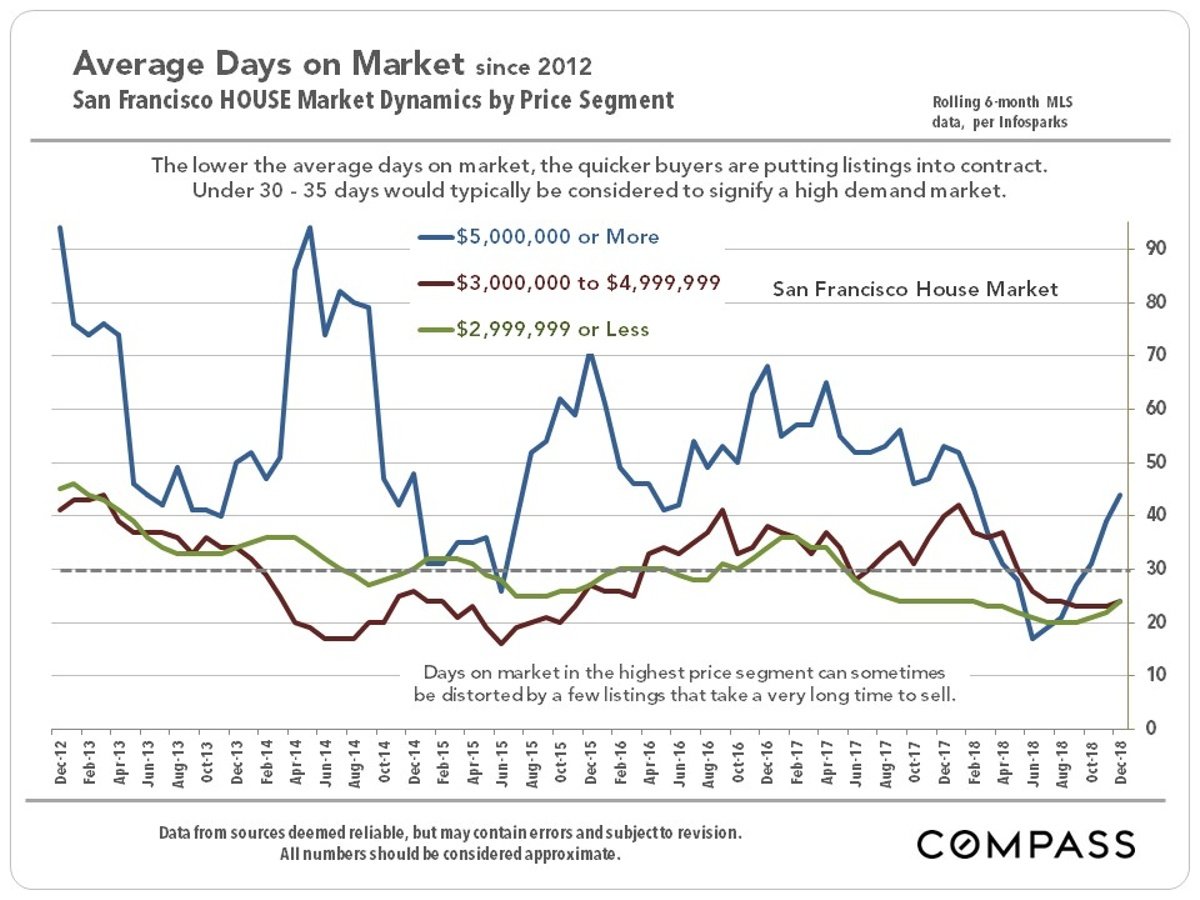
In addition, Average Days on Market (DOM) remains very low for most single family homes as the following charts shows.  While DOM for the most expensive homes rose significantly in the last two quarters, there are so few sales in this segment that statistics tend to be volatile anyway.

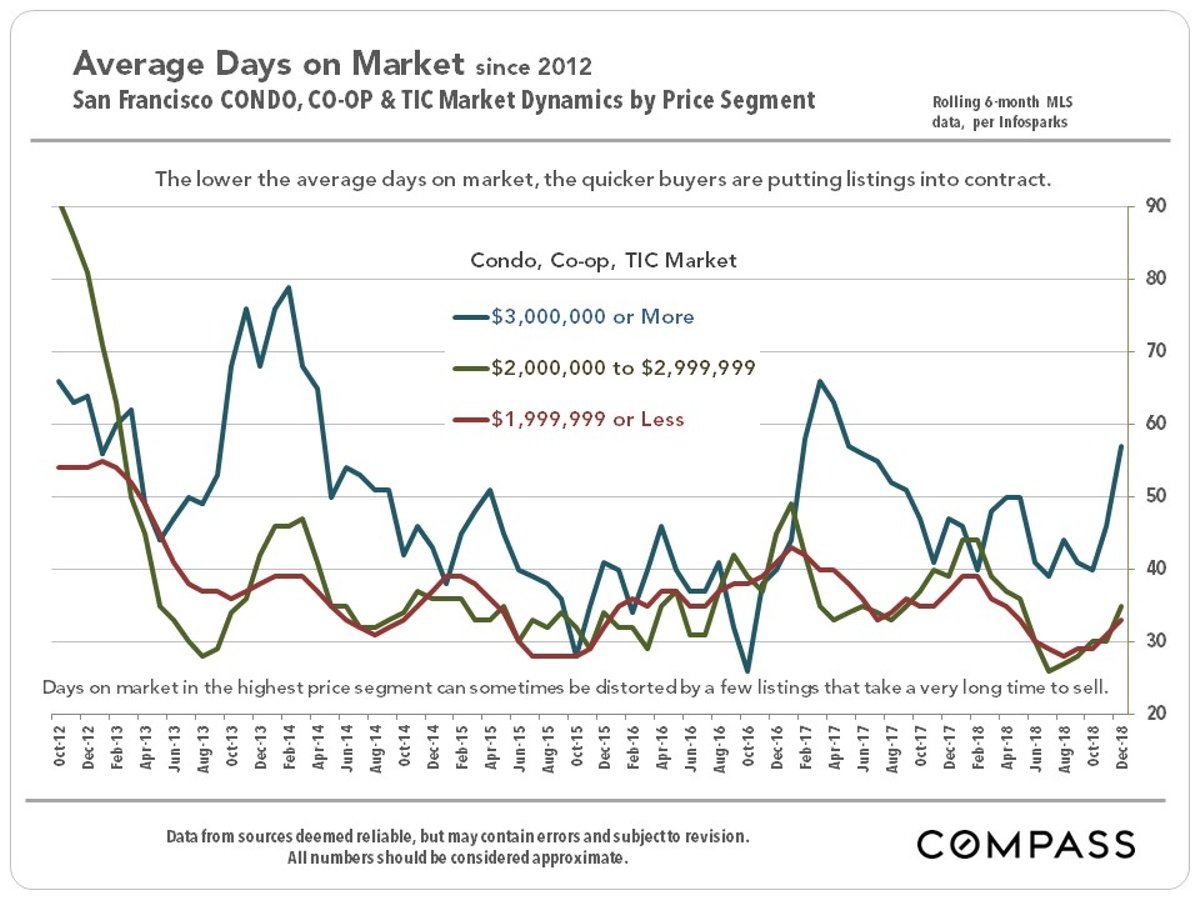
If we see any current weakness in the market, however, it’s in high-end condos ($3+ million) where new construction in recent years has created oversupply. The next chart shows that DOM for this segment has been between 40 and 60 days for two years.  Most other markets would love to have a DOM statistic of 60 days.  In San Francisco, that’s considered l-o-n-g.

Bay Area Perspective

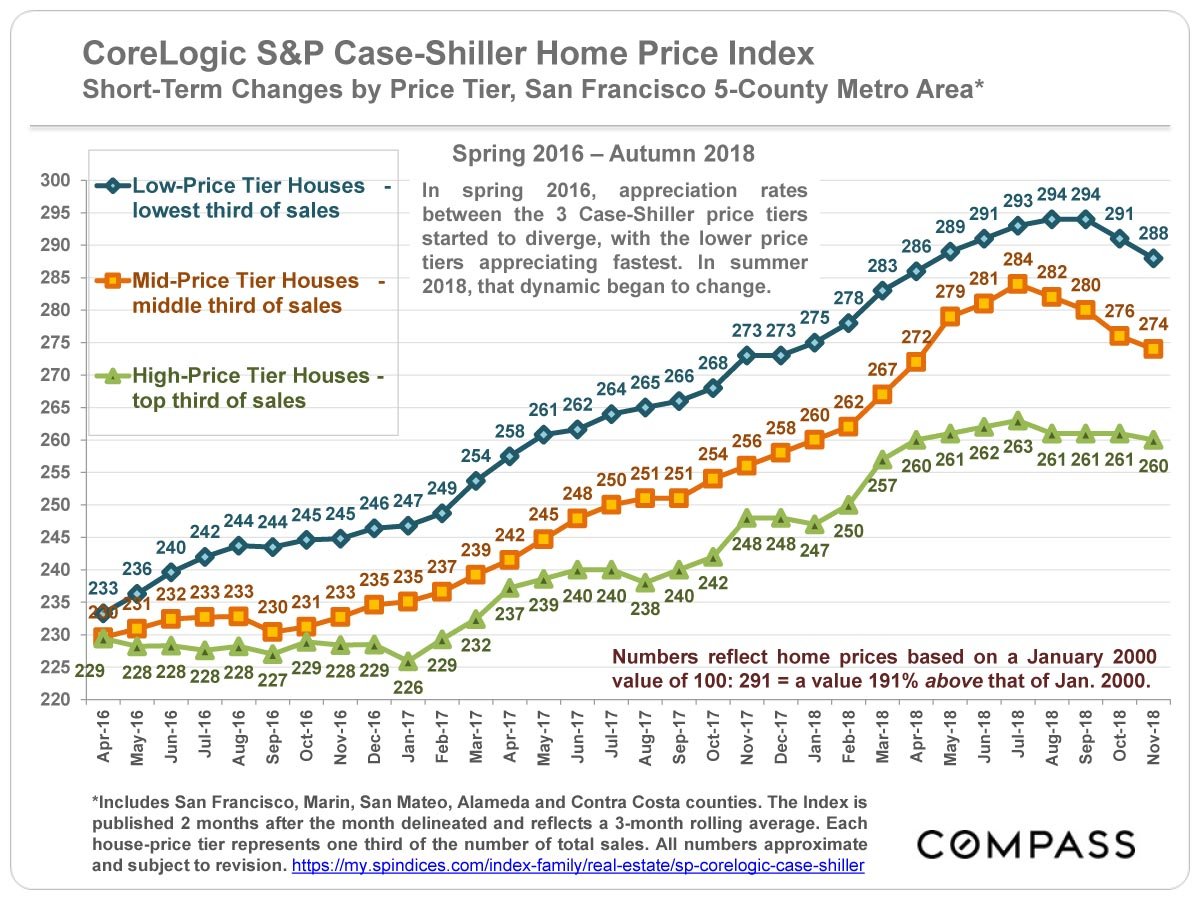
For a broader perspective we can look at the Case Shiller Index for the SF Metro Area.  It aggregates data for five Bay Area counties:  San Francisco, San Mateo, Alameda, Contra Costa and Marin.  San Francisco represents a tiny part of that index – only 7% of all sales.  And virtually all of those sales would fall within the “high price tier” of the Index.  Still, if there’s one thing we should have learned by now it’s that SF is not immune from broader market trends.

The first chart below confirms how, Bay Area wide, there was price slippage in all price tiers starting in the summer months of 2018. The second chart, with a longer perspective, shows how lower and mid-priced homes generally appreciate faster during run-ups and then drop faster and further during slowdowns.  The same phenomenon applies to SF itself.  As people get outbid on homes in their “A” list neighborhoods, they bid up prices in neighborhoods deemed less desirable.  When the market drops, buyers focus again on the “A” list neighborhoods and avoid the B-List , thus exacerbating the decline in the latter.

Caveats, IPO’s, and Wild Cards

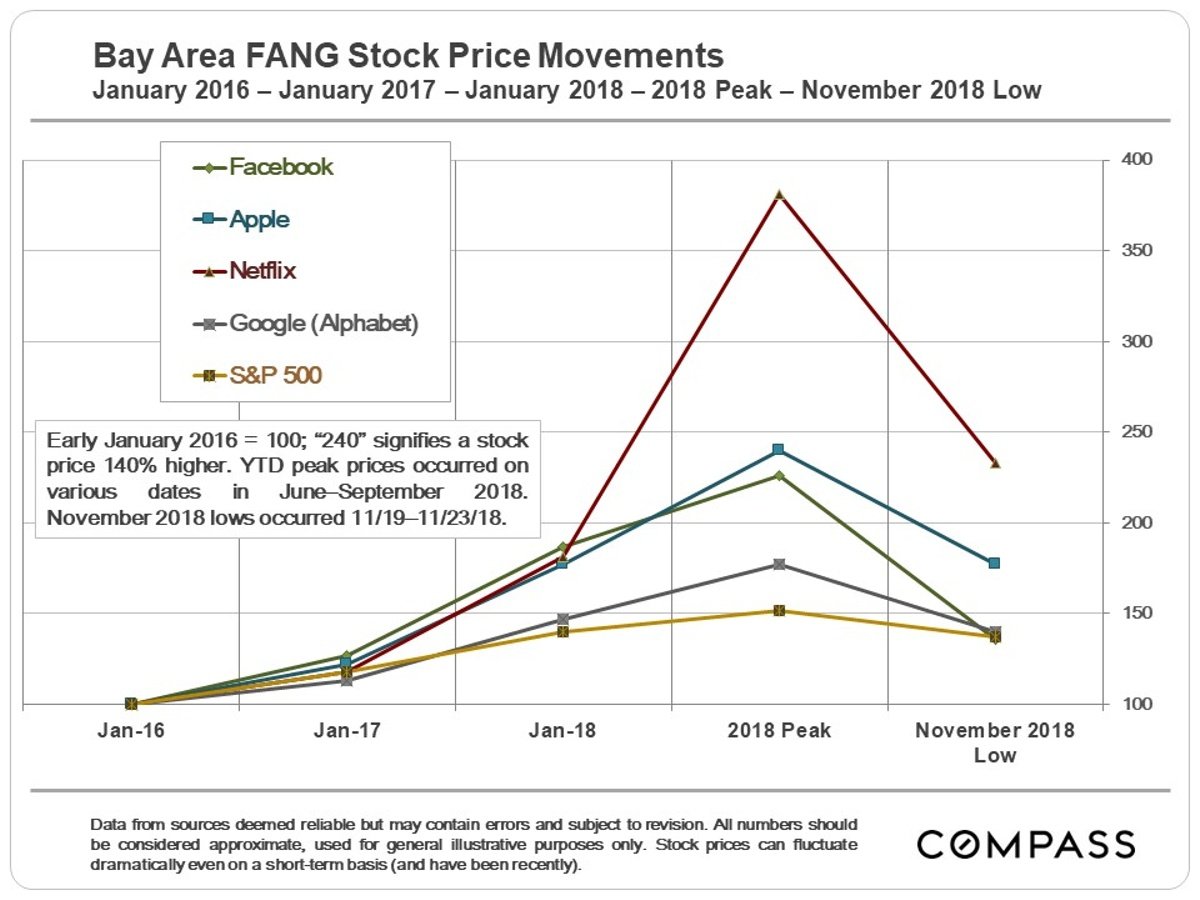
It’s worth remembering that the end of 2018 saw one of the most volatile stock market rides in recent history.  That, in itself, could have contributed significantly to the weakness we saw in the real estate market in the second half of the year.  If the stock market stabilizes and returns to its bullish ways, maybe that end-of-year weakness will be just a blip. 

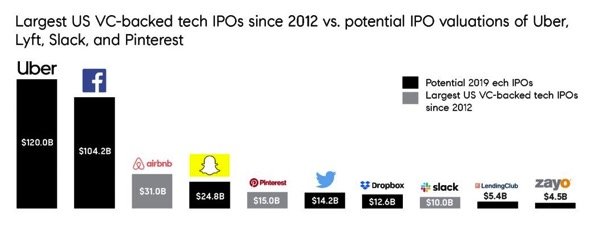
With a handful of high-profile Bay Area unicorns going public (including Lyft, AirBnB, and Uber), there’s speculation that the resulting crop of newly minted millionaires will bid up the market as they look for homes.  As I’ve written previously, in a market as small as San Francisco, that’s a plausible theory.  However, three studies report in a recent article in the SF Chronicle suggests that if there’s an effect at all, it’s limited.

Then there’s Brexit, Venezuela, North Korea, a trade war with China, and the possibility of another government shut-down, not to mention Robert Mueller and a certain volatile public figure who is the subject of his inquiry.

As the Chinese proverb says:  “May you live in interesting times.”  Happy New Year!

As always, your comments, questions and referrals are greatly appreciated!

Misha


Three Studies Suggest a Mild IPO Effect on Residential Real Estate

A February 5 article in the SF Chronicle discusses three recent studies on whether IPO’s actually affect residential real estate prices. None of the studies focus specifically on the San Francisco market; only one, by Zillow, suggests that the IPO effect on neighborhoods populated by employees who benefited from an IPO, might have seen a substantial increase in prices as a result.

Nevertheless, with San Francisco home prices cooling at the end of 2018 and with AirBnB, Uber, and Slack among others, all poised to go public this year, it will be interesting to see if all the newly minted money will add some “spring” to the spring market. Stay tuned.

Where is Bay Area Housing Headed?

In my last newsletter in late October, I suggested that despite data indicating the possibility of a slowing real estate market, it was too soon to tell.  It may still be too soon – but the evidence is mounting.

Notably, we’re seeing evidence of a slowdown across the Bay Area and, indeed, nationally.  The December 1 issue of The Economist describes a national “housing wobble”, citing declining new construction  and higher interest rates as among the contributing factors.  Nationwide, sales of existing homes were down 5.1% from the year previously and sales of new homes were down by 12%.  (interestingly, the article suggests that declines in residential purchases and homebuilding are a leading indicator of recessions, rather than the other way around.)

The message was much the same at the UC Berkeley Real Estate Symposium which I attended last month, where keynote speaker Ken Rosen — advisor to billion dollar REITs and foreign governments – opined that “we are late in the cycle.”   Locally, he thinks that we’ll need to wait till the Spring to see if higher interest rates, lower tax deductions, and an increasing number of people who are looking to move out of the Bay Area because they’re fed up with congestion and high prices will lead to a meaningful “correction” in home prices.

As the chart below shows, there’s been price erosion in most Bay Area counties over the last year.

And in San Francisco, home prices had a big bump in the Spring, but have fallen back since then.  Note that the chart below tracks three month rolling averages, so I’d expect further price declines to show up as we move past the seasonally strong months of September and October.

Meanwhile, price reductions on active listings in the last couple of months are up well above previous years and so seem to be showing more than the usual seasonal increase we expect towards year’s end.

Let’s be clear, however:  2018 has been a very good year for San Francisco home sellers, with solid year over year price increases until very recently, especially for single family homes (see charts below).  So it remains too soon to predict whether we are witnessing a “wobble,” a seasonal pause, or the start of a meaningful decline in home prices.


In addition, with a handful of Unicorns (Uber, AirBnB, Lyft) moving up their timelines for going public, there could be several hundred newly minted millionaires vying for higher end homes.  In a market where we estimate there are only about 2,500 single family home sales per year, these buyers could provide substantial support for home prices.

At the same time, with the recent hard decline in the stock market  — and in Bay-Area tech stocks in particular – many people may be feeling a lot less wealthy.

How all these vectors ultimately intersect is anybody’s guess.  Personally, I think a market balanced more evenly between buyers and sellers would be a good thing.  Sure, maybe sellers would prefer the breathtaking price acceleration and frenzied multiple offer market of recent years to continue, but, as we saw in the Great Recession of 2007/2008, that sort of market tends to end up with an equal and opposite effect down the road.  I’ll take a slowdown over a crash any day.

As always, your comments, questions and referrals are much appreciated!  And Happy Holidays to all my readers!

Misha