Hanger Steak

And now for something completely different. What’s even closer to my heart than real estate?  Food.

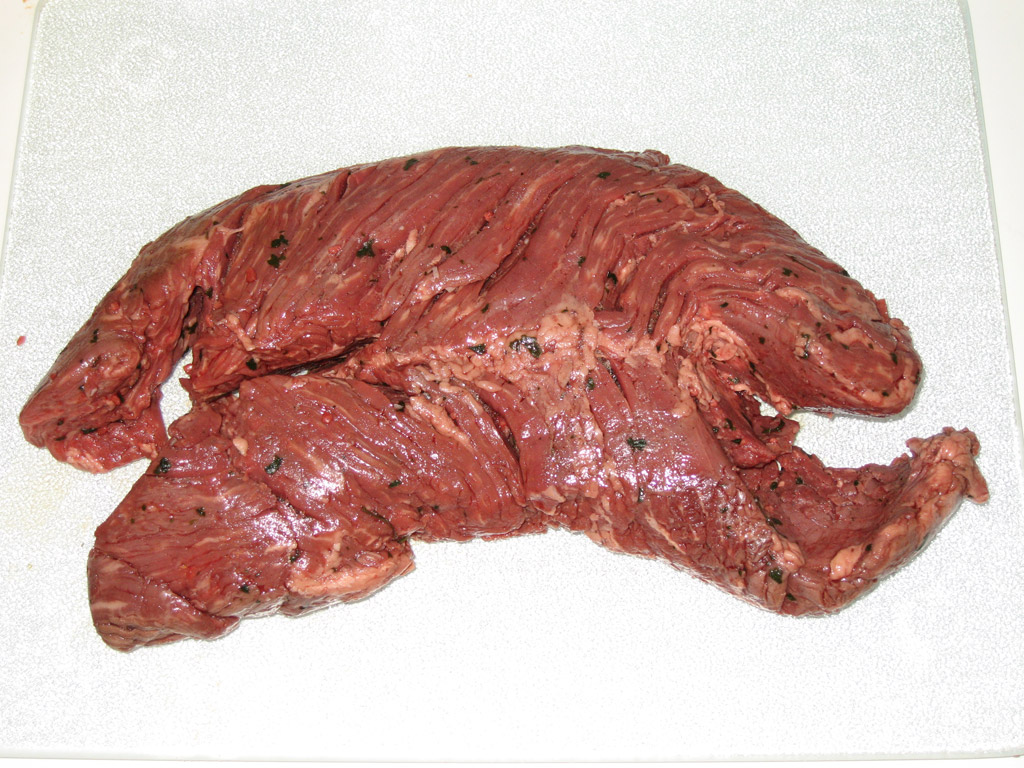
A hanger steak is a cut of beef steak which is said to “hang” from the diaphragm of the steer.[

That’s a meaty description. There’s only one per steer and since it “hangs” close to the kidneys, it’s said to be particularly flavorful.

But cook it for a minute too long and it gets as tough as the hide from which it was parted.

These days, it’s becoming easier to find.  I picked some up at Whole Foods in Noe Valley for around $8.99 a pound.

French bistros serve hanger steak — onglet —  with a shallot sauce, pommes frites, and a pichet of rot-gut red.  My version takes about 10 minutes from refrigerator to table.  The challenge is to really believe it’s cooked after just 90 seconds per side.

Hanger Steak with Shallots

Ingredients (serves 2)
6 oz of hanger steak, in one or two pieces
1 large shallot, finely chopped
balsamic vinegar
¼ tsp beef concentrate
1/3 cup of water
2 or 3 tbs butter, cut into 3 pieces
non-virgin olive oil, salt and freshly ground pepper
a few slices of French or Italian batard

Warm a couple of plates in the oven. Season the meat with salt and pepper. Add around a tablespoon of oil to a heavy non-stick pan and heat until almost smoking.  Add the meat and count to 90 – slowly.  Flip and do the same on the other side. Take out the warm plates, put on the slices of bread and place the meat on top of the bread.  Return to the oven. Lower the heat to medium, toss the shallots into the dry pan and stir constantly for about minute until the shallots are just soft and not burned.

Add a long splash of balsamic vinegar to the shallots and stir quickly. The sauce should get sticky almost immediately.  Add the water and beef concentrate and continue stirring for a minute or two while the sauce reduces.  Lower the heat and stir in the pats of butter one by one.  Pour over the meat and serve.

Case-Shiller Sounds a Cautiously Positive Note

Last week, Case-Shiller released January data for its closely watched national housing index.  Nationally, things are looking up – well, make that flat.  And that’s good news. In the wonderfully backward language of the report, the index’s year over year rate of decline “improved.”  Basically, we are back to where housing values were a year ago.

Since for most of us our homes represent our biggest asset, that’s pretty good news when you consider how bleak things looked back in March of 2009.  Just think of how you were feeling about your 401(k)s.

But before you break out the champagne, consider that national home prices have now “recovered” to levels last seen in Autumn 2003.  That’s over six years of appreciation wiped out.

The San Francisco Metropolitan Statistical Area (that’s 5 of the 9 Bay Area Counties, folks) is up 15.2% from its trough value. Case-Shiller does not break out San Francisco proper from the much larger MSA.  However, I calculate that median prices in January were up just 10% from the lows reached in March 2009.  (I use 3 month moving averages, which approximates the seasonal adjustments the CS Index uses.)  To see how SF did through 2009, check out my blog and charts here.

Noe Valley: The Condo/TIC market

At long last, here’s the promised data on Noe Valley condos and TIC’s.

First, a look back (in anger?) at the make-up of Noe Valley sales in 2009.

Note that there were more than twice as many condos sold as TICs, and more homes sold than condos and TICs put together. (What’s a TIC?  — Check out my series of posts on Tenancy-In-Common Interests, starting here.)

Also, that absurdly long DOM for TICs was distorted by 3 TICs at 201 Hoffman that took 410 days to sell.  Still, without those sales, DOM for TICs (tired of the acronyms yet?) was still 99 days.  And I’d be somewhat skeptical of the whopping difference in price between TICs and condos as well:  TICs sales often don’t have a price per square foot listed, so there are very few data points — and there are very few sales to begin with.

Here’s how condos and TICs have been doing as a combined group, versus their all-time highs.

That precipitous plunge (actually a huge increase since the scale is reversed) in DOM at the end of 2009 was also due to the lingering effects of 201 Hoffman.

For a shorter term view, prices through February 2010 are up 11% from January 2009 and are up a whopping 31% from the trough of June 2009.  Since I use trailing 3 month averages, I think this is a belated reflection of the deep credit freeze of Spring 2009 when we thought the world might come to an end.

And here’s how condos and TICs stacked up against homes.

For what it’s worth, it feels like spring has really sprung.  Nice-looking condos/tics are swarming with people and are moving fast — no kidding.  Whether it will last is anybody’s guess.

Is Now a Good Time to Buy?

In an article entitled Great Time to Buy (Famous Last Words), last Sunday’s New York Times took a swipe at perennially optimistic real estate agents who have never seen a time that wasn’t a good time to buy a house.  Fair enough.  Self-interest and magical thinking are not limited to the real estate profession.

For the record, I’ve never suggested to anyone that buying a home is a good “investment.”  You can do much better in the stock market and probably even in bonds.

However, I am beginning to think that if you’re going to shackle yourself to a home, now may not be a bad time to buy.  And I think the NY Times article supports my position.

Why do I think so?  Most of the articles I’ve been reading suggest that the worst is over in terms of price declines, this article included.  That doesn’t mean that prices couldn’t drop another 5 to 10%.  But it’s a fool’s errand to try to predict the bottom (or top) of any market.

At the same time, the consensus seems to be that interest rates have nowhere to go but up, given the huge stimulus that the government’s been giving to prop up the economy.  One can argue whether and when the government should choke off the spigot of easy credit, but when it does, rates are going to have to go up.

Here’s the takeaway from the NY Times article:

“Instead of betting on home prices, you make a bet on whether money will become cheaper or more expensive, allowing you to buy more or less house.”

Now  it’s true that increasing interest rates ultimately lead to declining prices as tighter credit drives down demand.  That’s the theory anyway.  But after the huge declines we’ve already seen, it’s anybody’s guess as to when, where, or how that will happen.  As the article says, “don’t go there. Maintain your focus.”

Here’s a graph from mortgage-X.com on historical blended (ie. fixed, arms, etc.) mortgage rates.  Should make people who can qualify for a mortgage in this still-crazy market feel pretty good, no?

Noe Valley Still Goin’ Down?

Author: Jack French -- Used under Creative Commons Permission 2.0

Back in May 2009, I showed that Noe Valley was not immune from the slump in prices affecting the rest of the city, despite suggestions to the contrary from real estate agents, mavens and media.

Have things gotten any better?  Well, no.  And maybe.

Here’s a chart showing percentage change in single family home prices for the last 14 months, relative to their all-time highs  (click to enlarge).  (All figures are 3 month moving averages.)

After reaching an all time high in March 2008, prices plummeted.  Just a year later, in the midst of fears of a global Depression, home prices were down 30%.  Did things get better?  No, they got substantially worse.  Despite an impressive  city-wide recovery in 2009, with prices going from 30% down to around 18% down for single family homes at  year’s end (see more detail here) , Noe Valley home prices continued to retreat.  In October and November 2009, prices were down 35%.  At year’s end, they’d barely clawed back two percentage points. Not surprisingly, days on market (DOM) remained stubbornly high for all of 2009.

Still, with cherry blossoms busting loose all over Noe Valley’s quiet streets, there certainly seems to be a change in the air.  There are many more listings coming onto the market and there’s even the occasional feeding frenzy over a clean, well-priced home.  These go in a matter of days, not weeks. Maybe that upturn in prices for January and February suggests a continued warming trend.

In the next few posts, I’ll look at Noe Valley in more detail, including how condos have fared.

Looking Back at 2009: Condos/TICs

Pretty much everything I said about how single family homes fared in 2009 also applies to the condo/TIC market.   (TIC’s, aka Tenancy In Commons are similar to condos.  For more information on TICs, see my three-part series starting here.)

Condo/TICs hit their all-time highs about a year later than homes did — in July 2008.  But they’ve fallen from their highs almost exactly as much as homes have.  Condos/TICs were down 17%, just one percent better than single family homes.

For those who prefer their data on a per square foot basis, the picture is pretty much the same.  The all-time high was $711 — reached in November 2008 and the price per square foot stood at $592 at year’s end, also a drop of 17%.

While condos/TICs ended the year at the same point, the pattern has not been the same. Condos/TICs have been stuck near the bottom of their 2009 range after bouncing up in the first quarter. Homes, on the other hand, appear to have bounced up and stayed up.

What’s in store for 2010 remains anybody’s guess, but on the streets it certainly feels like spring is in the air.  There are more listings coming onto the market and more people looking at them.  Will that translate into sales and higher prices?  That’ll depend on macro-economic trends I’ve discussed elsewhere, but one thing’s pretty clear:  interest rates are heading higher, as evidenced by the Fed’s recent increase in the discount rate. If the economy continues to strengthen, that trend will continue.  And, for many people, that will result in less buying power and reduced affordability.

Looking Back at 2009: Half-Empty or Half-Full?

Less than two months into the new year and a brand new decade and already 2009 may seem as far away as a bad dream – assuming you still have a job.

It’s hard to remember just how close to the brink of catastrophe we seemed to be just a year ago.  Major financial institutions – failed.  Credit – impossible to get. Sales—anemic.

With the benefit of hindsight, not to mention survival, some are now criticizing Paulsen, Bernanke, et al., for their haste in rescuing the financial system, but I, for one, will reserve my scorn for the appalling judgment of the likes of Morgan and Goldman and their obscene bonuses.

How did the San Francisco market do?  Here’s where we are for single-family homes (click to enlarge).

We ended the year still down 18% from our all-time high of June of 2007.  That puts us at around the price levels of the spring of 2005.  Not great, but during those scary first months of the year when there was no bottom in sight, we were down to price levels not seen since early 2004.

It’s also interesting to see how Days on Market (DOM) inversely correlates with price, at least over longer periods.  In addition to the very regular seasonal dips in price every December/January, it’s easy to see that as DOM lengthens over time, prices decline.  While DOM remained less than 40 days, prices stayed high.  The correlation isn’t perfect – and certainly not on month-to-month time-scales — but it looks pretty good to me.

So for the “half-empty” crowd, the bottom line is that we’re still down 18% from our all-time highs.   The story looks much more positive, however, if you look at 2009 in isolation.

Now a 23% gain for the year ought to be making people feel pretty good.  Note that median prices have been in the $700,000 to $800,000 bandwidth for the last three quarters.  The dip in the waning months of the year can be attributed to seasonal factors.

I can already hear the nay-sayers arguing that looking at year end numbers is arbitrary  or, worse, distorts the picture.  (These are the same people who don’t believe in celebrating their birthdays!).

I’m certainly not arguing that happy times are here again.  But , if nothing else, that 23% increase confirms just what a wild ride the last two years have been.

As for 2010, I confess I’m beginning to feel a bit more optimistic than I was a few months ago.  Manufacturing seems to be continuing to expand.  There are some signs of job growth.  Still, Europe is now looking shaky and, closer to home, one should never discount the ability of our politicians to screw up the recovery.

All things considered, though, I’ll take my glass half-full please.

Forget Statistics: 714 Duncan Loses 23% in 18 months

Catching up on the endless paper-work the other night, I came across that rare thing:  a property that sells twice in a relatively short time with no major renovations performed in the interim.

This “sales matching” technique is what the folks at Case-Shiller use to create their Indexes of property values across the country.  Part of the reason they can is that their indexes are generated for large Metropolitan Statistical Areas with lots of house sales.  And even so, they use a lot of fancy foot-work to “match up” properties.

So now comes 714 Duncan Street, a beautiful 2,000 sf view home on a steep hill with fantastic city views.  Listed at a disarming $1,195,000, it sold for $1,415,000 in January 2008.  That was pretty much the top of the market for Noe Valley.  (You can see the chart here.)

Fast-forward 18 months.  The same house sells for $1,095,000 in June 2009.   That’s a drop of  22.6%.  My analysis of all Noe Valley sales for the same period shows a drop of just under 25% for the same period.

There’s something of a “duh, so what” to this story.   But I’ve seen enough nay-sayers  (on other blogs, of course!) who argue that tracking statistical medians are meaningless that I thought it was worth posting this as a powerful—and sobering —  case to the contrary.