

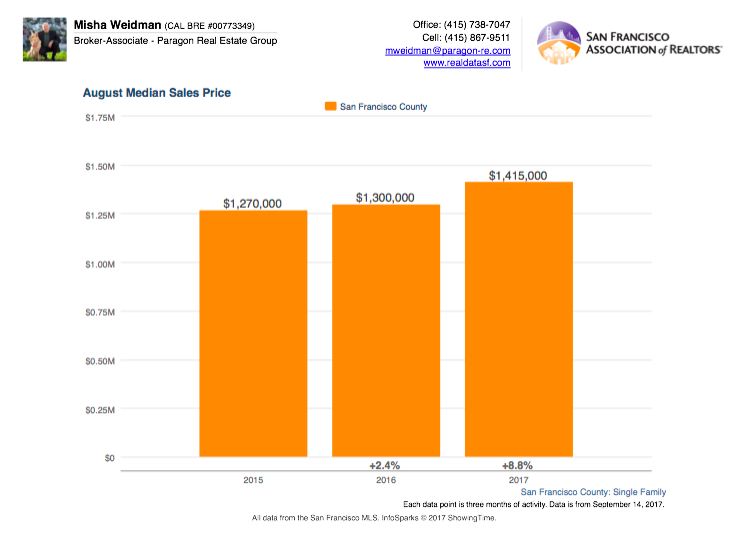
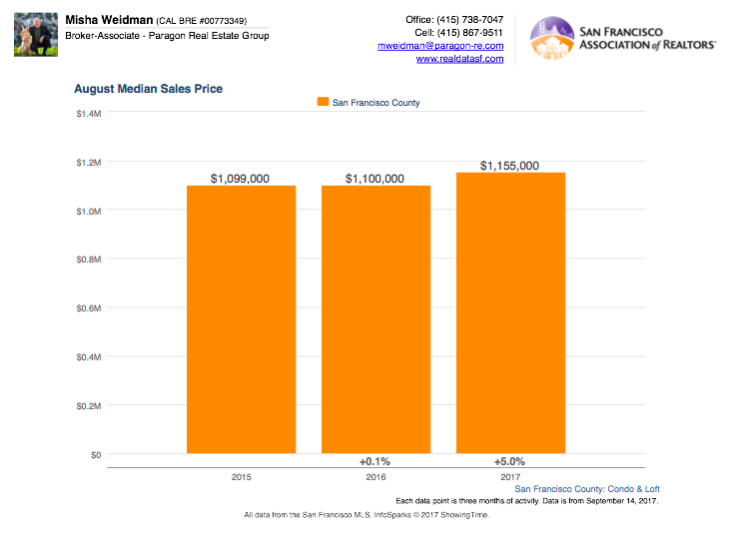
As I was getting ready to send out yet another newsletter showing further year over year gains in home prices(see first two charts below for single family homes and condos, respectively), I took a closer look at a chart that focuses on the supply side of the supply/demand equation.
“New Listings Coming On the Market” is the simplest indicator of how many homes are being put up for sale in any given time period. Take a look at the chart below, which tracks new listings (homes, condos, etc.) on a rolling 12 month basis.
Continue reading “Here’s What’s Really Sustaining the San Francisco Real Estate Market”


