The Case-Shiller Index for August for the 5-county San Francisco Metro Statistical Area was released today. It showed a small improvement from July’s reading and is now at its highest point since December 2008.


The Case-Shiller Index for August for the 5-county San Francisco Metro Statistical Area was released today. It showed a small improvement from July’s reading and is now at its highest point since December 2008.
The June S&P Case-Shiller Index report released today continued to reflect the surge in Bay Area home values. Remember that Case-Shiller measures house values in a 5-county area and generally reflects the heat of the market 4-6 months ago. So far in 2012, the city of San Francisco itself is outperforming the 5-county area.


Our full report on Case-Shiller is online here: http://www.paragon-re.com/Case_Shiller_Index_Deciphered_for_SF
The May reading for the S&P Case-Shiller Index, released today, substantiated what we’ve known for quite some time: the SF home market (though the Index is for the 5-County Metro Area) is rapidly accelerating. Since the Index is a rolling 3-month average and published 2 months after the title month, it is always 3-4 months behind what is actually occurring in the market between buyers and sellers.
Our entire report on the Case-Shiller Index is on the Paragon Market Dynamics section here: http://paragon-re.com/Case_Shiller_Index_Deciphered_for_SF


As promised, here are a few tidbits from Leslie Appleton-Young’s presentation to the conference sponsored by UC Berkeley’s Fisher School of Real Estate and Urban Economics. Ms. A-Y is the California Association of Realtors’ Chief Economist.
Most of the data covers the state as a whole, and even when it’s broken down by county, Ms. A-Y stressed that there can be huge differences when you get more “granular” with the details. (I made the same point in my 10/27 post discussing how misleading the much-quoted Case Shiller Index can be.)
Continue reading “The View from Space — Part 3: Above California”
The day after I posted my take on the Case-Shiller Index, they came out with July’s report (they’re always trailing three month averages) showing a continuing decline in the San Francisco MSA. Wait for it: down 27.3% from July 2007. Are we worried? Not that much. Why not? Read my October 27 blog: “San Francisco” means most of the Bay Area when it comes to the Case-Shiller Index.
You want scary? Median prices are down 45% year over year in Contra Costa County.
Yup, that’s right folks. According to the well-known and well-respected Case-Shiller Index published by Standard and Poor’s, San Francisco home prices in July 2008 were down a whopping 24.8% from a year previous. How can this be, when you read right here that median prices were down YOY (year over year) a “mere” 11.3% in September (see Oct 23 blog below) and just 5.5% YOY for July 2008 — see my market trends archive.) More realtor fluffery, you huff, designed to make the credulous public believe that things are not so bad.
Actshooly (actually), the reason’s simple. As is often the case when widely quoted indexes talk about a city, what they’re really referring to is a Metropolitan Statistical Area (MSA), a much larger geographical area. So “San Francisco” doesn’t mean our little piece of heaven, no. It means… all of Alameda, Contra Costa, Marin, and San Mateo COUNTIES as well as San Francisco county.
According to the latest release from Dataquick, median home prices in Contra Costa County were down a whopping 45.6% YOY for September 2008. No great surprise considering that it includes ground-zero overbuilt subdivision train-wreck areas like Pittsburgh and Antioch. Take a look:
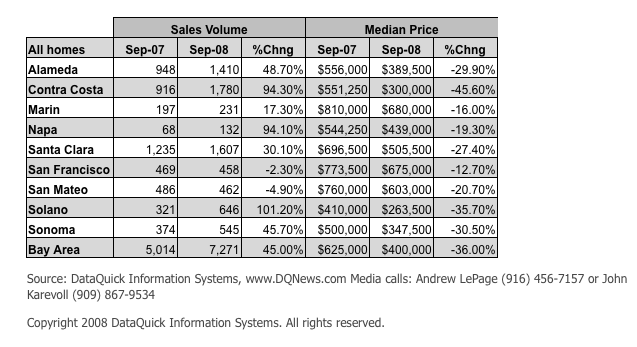
With Alameda County down 30% and even Santa Clara County down 27.4%, it’s clear how the other counties in the San Francisco MSA are dragging the “San Francisco” index down. Feel better now?
And a PS. Dataquick shows San Francisco County as down 12.7% for September versus my 11.3%. I get my numbers from a service that pulls them directly from the MLS, then I use their spreadsheets to dig deeper when necessary. I’m looking into why there’s a discrepancy between my numbers and Dataquick’s.