Real Data SF August Newsletter: Summer Doldrums or A Change in the Weather?


The other day I was talking to a business-savvy fellow who has been looking to get into the real estate market since 2009. Back then, he recounted, everyone thought he was crazy to want to buy something. Ultimately he didn’t. Recently I introduced him to some clients of mine who were looking to partner up with someone on a “fixer” project. Surveying the $1 million prices “fixers” seem to be going for, he used the words “bubble” and “frothy” to describe what’s going on in SF right now.
Is he right? Let’s leave aside the question of whether we should consider homes “investments,” as we do stocks. (In general, I don’t think we should: click here for U.S. long-term home appreciation stats prior to the housing recovery.) Instead, let’s simply focus on whether, after 18 months of breath-taking price increases here in SF, we are already in a new housing market bubble.
Continue reading “Real Data SF – July 2013 Newsletter: Of Bubbles and Froth”
July 2013 San Francisco Market Report
If you prefer, you can skip the following analysis to go straight to the charts and maps following.
Many adjectives are used to describe San Francisco, but normal isn’t a common one – and the same can be said about our real estate market. Even taking into account its tendency to be unusual in one way or another, this past spring’s market was overheated by virtually any definition. Surging consumer confidence and huge buyer demand chased a deeply inadequate supply of homes for sale, abetted by interest rates so low that loans – factoring in inflation and mortgage interest deduction – were almost like free money. All this led to an extreme seller’s market, a feeding frenzy and dramatic price appreciation.
But not, in our opinion, a bubble. The Economist, one of the first to sound the alarm for the last bubble, sees no sign of a U.S. housing bubble, basing its conclusion upon historical comparisons of home prices with rents and incomes. Also, it is not unusual for the market to go somewhat crazy following a 4-5 year down cycle after all the repressed demand bursts forth – this happened in 1996-1997 too. Besides which, we are only about 18 months into the current recovery. Though real estate is susceptible to sudden economic and political shocks, in past cycles, recoveries have typically lasted at least 6-8 years before peaking. That doesn’t mean there won’t be any short-term market adjustments, up or down, for one reason or another, along the way.
There are some signs of a normalizing market. After a year of declines, the number of new listings in the 2nd quarter was a little higher than the 2nd quarter of 2012. Though this inventory was quickly gobbled up and overall supply remains very low, it’s a good sign more sellers are entering the market. Median prices may be leveling off after spring’s big pop – it’s still too soon to be sure, but summer often sees a cooling down. It’s not welcome news to buyers, but interest rates have increased from extreme lows – though remaining very low by any historical scale. (See below: The Sky is Not Falling.) The distressed home segment, which always distorts markets, is disappearing in the city and declining everywhere. And new-home construction continues to increase: even though we won’t see much of this new inventory until 2014 and later, it’s a very positive sign.
We have updated our home value maps to reflect spring’s recent sales:
San Francisco Neighborhood Values
 San Francisco Median Home Prices
For both houses and condos, the second quarter saw jumps well above previous peak values. Median sales prices are affected by other factors besides changes in value – seasonality, inventory, buyer profile, big changes in the distressed and luxury home segments – but the dramatic increases do reflect rapidly climbing home values in the city. Though all SF neighborhoods have been experiencing striking appreciation, this does not mean that all have now exceeded previous peak values.
 Sales Over & Under Asking Price
This chart illustrates the enormous percentage of listings selling for over – and sometimes far over – asking price. 25% of house sales in June sold for 20% or more above list price: At San Francisco prices, 20% above asking often equals hundreds of thousands of dollars.
Price reductions: 89% of second quarter sales sold quickly without price reductions at an overall average of 8% over list price – a clear indication of overheating. Still, not every listing sold without a price reduction and some didn’t sell at all, but ended up withdrawn from the market:
Price Reduction Chart
 San Francisco Luxury Home Sales
No market segment has been affected more dramatically by the recovery than luxury homes. In an inventory constrained environment, it has far out-performed the general market in unit sales.
This link goes to our luxury market report that also delineates the neighborhoods which dominate high-end house and condo sales in San Francisco:
Paragon Luxury Report
 Interest Rates: The Sky Is Not Falling
Not to diminish legitimate concerns regarding rising mortgage rates and their effects on housing costs, but this graph puts recent increases in context. At any time before 2011, the current interest rates, even after their recent big percentage jump, would be reason for conga lines of celebration in the streets. Rates had to rise from their historic and artificial lows – how far and fast this may continue is unknown to us, but we don’t presently expect big shocks to the real estate market in the near future.
Distressed Home Sales: this link goes to a chart illustrating the rapidly dwindling distressed home market in San Francisco. In most neighborhoods, the effect of these sales has disappeared altogether.
Distressed Home Sales
 Months Supply of Inventory (MSI)
Even with the increase in new listings in the second quarter, inventory as compared to demand remains drastically low.
Average Days on Market (DOM) have also hit historic lows for virtually every property type in the city:
Average Days on Market
 What Sells Where
What district of San Francisco has more house sales than any other? Which area has far more condo sales? You may be surprised at the answers.
The pundits are making dramatic, even doom-laden pronouncements about what is going to happen with interest rates (and the housing market), though they’ve been wrong so many times over the past few years, these “expert” predictions might be taken with salt-shaker’s worth of salt, perhaps with lemon and a nice shot of tequila.
Obviously, interest rates are an important component of the real estate market. But this chart gives a little context to what has occurred recently: the blue column is the average 30-year interest rate for the first 5 months of 2013, when everyone was dancing with glee at how low the rates were; the black line at the end represents the interest rate on Friday, June 6th, though it is true that it briefly hit 2 tenths of a percentage point higher earlier in the week (so if you like, add the tiniest smidgeon more to the black line).
I don’t know where interest rates will go, though they will probably rise over time—and perhaps there will be an upcoming interest-rate shock. But terror seems a bit premature.

Pretty much everything I said about how single family homes fared in 2009 also applies to the condo/TIC market. (TIC’s, aka Tenancy In Commons are similar to condos. For more information on TICs, see my three-part series starting here.)
Condo/TICs hit their all-time highs about a year later than homes did — in July 2008. But they’ve fallen from their highs almost exactly as much as homes have. Condos/TICs were down 17%, just one percent better than single family homes.
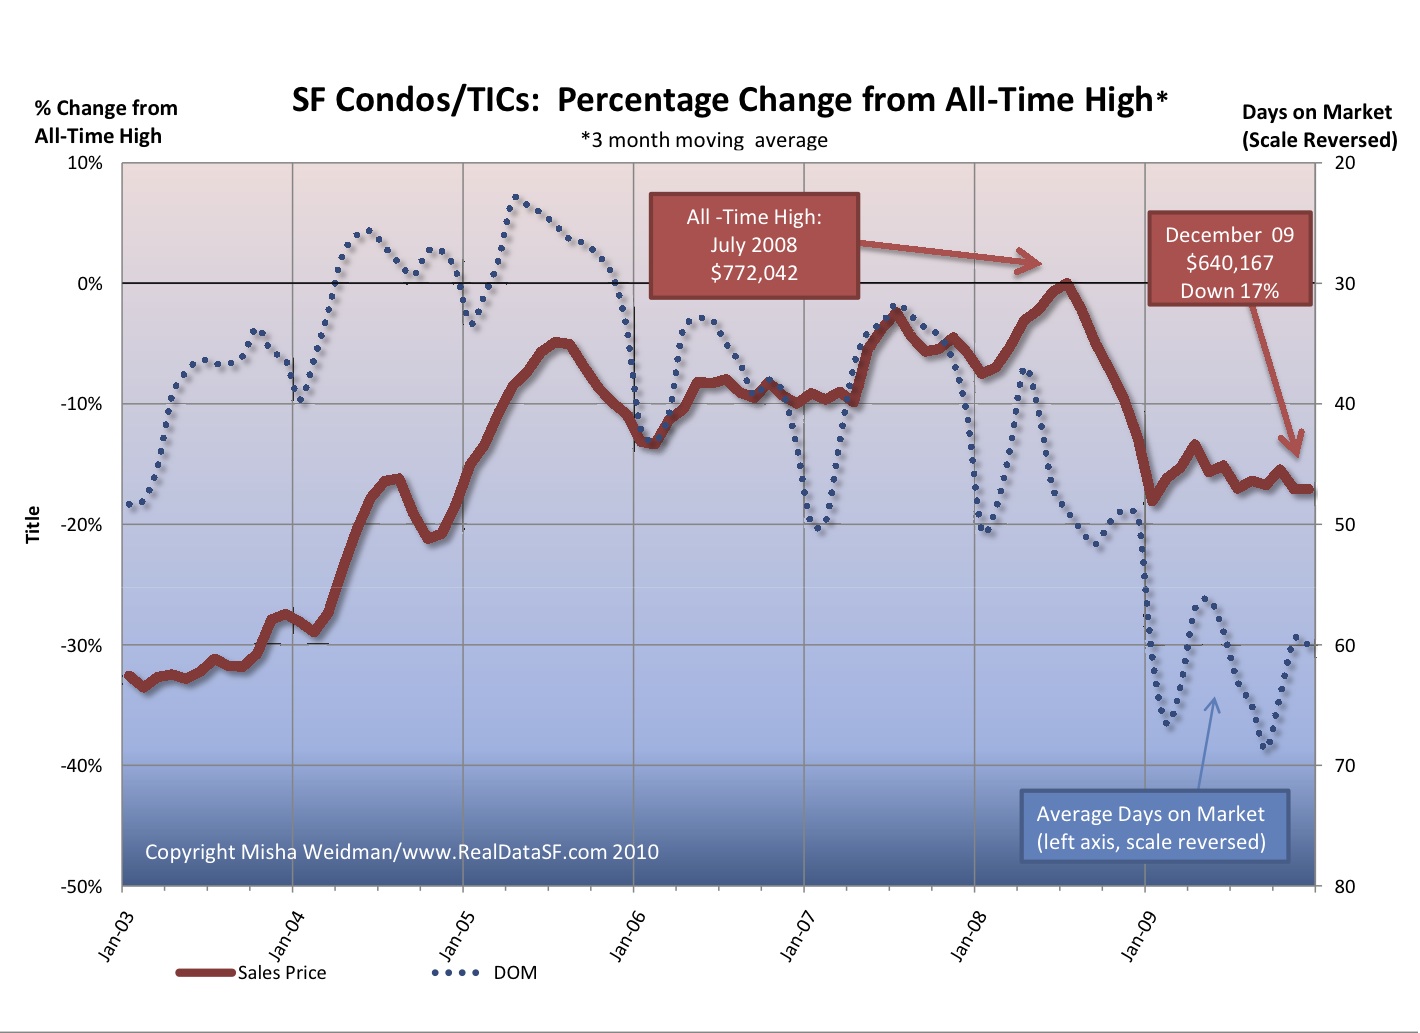
For those who prefer their data on a per square foot basis, the picture is pretty much the same. The all-time high was $711 — reached in November 2008 and the price per square foot stood at $592 at year’s end, also a drop of 17%.
While condos/TICs ended the year at the same point, the pattern has not been the same. Condos/TICs have been stuck near the bottom of their 2009 range after bouncing up in the first quarter. Homes, on the other hand, appear to have bounced up and stayed up.
What’s in store for 2010 remains anybody’s guess, but on the streets it certainly feels like spring is in the air. There are more listings coming onto the market and more people looking at them. Will that translate into sales and higher prices? That’ll depend on macro-economic trends I’ve discussed elsewhere, but one thing’s pretty clear: interest rates are heading higher, as evidenced by the Fed’s recent increase in the discount rate. If the economy continues to strengthen, that trend will continue. And, for many people, that will result in less buying power and reduced affordability.