Surprise! Condos are Holding Up Better Than Homes

For the quarter century (gulp!) that I’ve been involved in real estate, the conventional wisdom has always been that condo values generally do worse in down markets than homes.  Why?  To be honest, I’m not sure, but I think it’s because it’s easier to overbuild the condo market than the single family home market.  It goes back to that famous quote:  “Buy land – they aren’t making any more of it.”  Just take a look at Miami, Chicago – or downtown San Francisco.  One new high-rise can hold hundreds of condos in the sky.  Try building just one new home in SF, let alone hundreds – it aint happening.Of course, more supply  + less demand in a down market means prices fall.  Has that been the case in San Francisco?

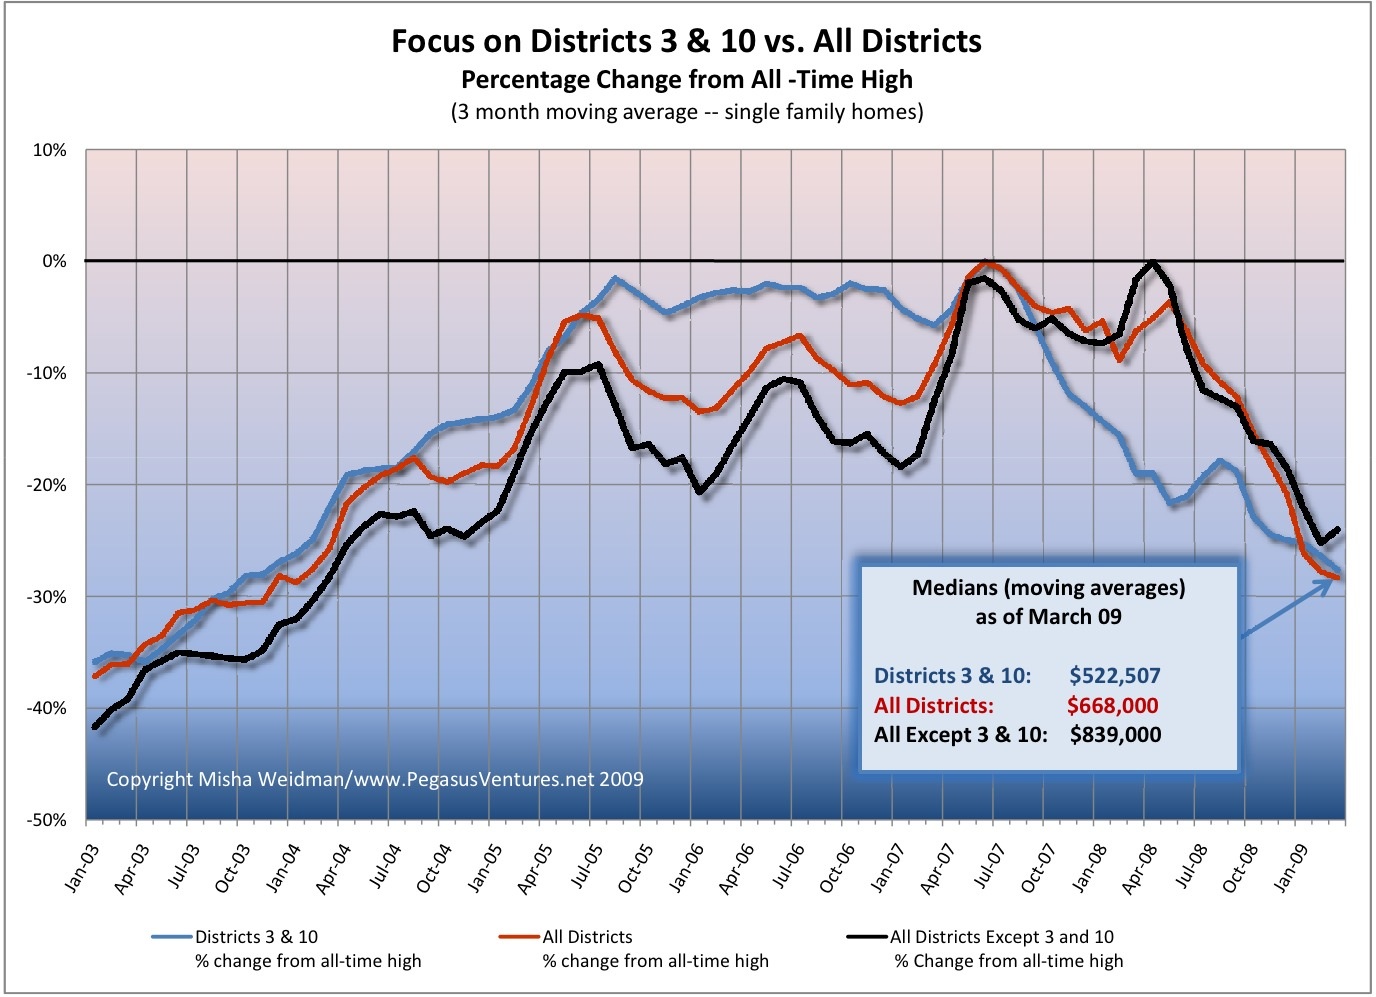
I looked at percentage change from all time highs for condos and single family homes (sfd’s) since January 2003 and here are the results for the city as a whole.

Condos vs. SFDs All Districts Chart

Until June 2008, condo and home prices were in lock-step in terms of price appreciation and decline.   Thereafter, homes fell first and further. (Do I hear a lithp?) In March 2009, the delta between condos and home prices was a whopping 13%.  Since then, however, home prices have recovered smartly:  as of June, homes are about 4.5% further off their all-time highs than condos.

What does this all mean?  First of all, I wouldn’t take too much consolation just yet in the upward spike in both condo and home prices since the beginning of the year.  If you take a look at the chart, this happens every Jan/Feb when people start buying out of the winter doldrums.  I wouldn’t predict a bottom until we see what happens this winter.

Secondly, given the woeful condition of the economy and the credit markets, together with the fact that San Francisco is not a badly overbuilt housing market, it sort of makes sense that condos are holding their value relatively well as people are finding themselves priced out of more expensive single family homes.

Still, the current delta of only $100,000 between median condo and median home prices seems rather small.  If people are just begging to know what the historical average is, let me know and I’ll find out.

Focus on Cole Valley

Noe Valley has its 24th Street shops and cutesy cafés. Cole Valley has, well, its Cole Street shops and cutesy cafés. The two neighborhoods have been engaged in a friendly battle for the hearts of San Francisco homeowners for as long as I can remember.

After doing a guest post on Noe Valley price trends at theFrontSteps a few weeks ago, Alex, tFS’s friendly editor, suggested that I do a side-by-side comparison of sales trends in Cole Valley and Noe Valley.

Great idea, I thought! Trouble is, Cole Valley sits within a tiny subdistrict of the MLS  (see the pink area below?) and as a result, there very few transactions from month to month.

district-5-omnimap

That makes data crunching hard.  Maybe even meaningless. Check out the white bars in this chart (click). They represent the number of single-family home sales per month back to January 2003.  (Number of sales is tracked on the right side of the chart; percentage change from “high” is tracked on the left side.)

cole-valley-monthly-sales-chart

You can see that there are many months where only one or two houses sold. There are some months where there were no sales at all. It’s tough to extrapolate monthly sales trends under those circumstances and dangerous to assume that an “all-time high” is meaningful when it’s based on only one or two data points.

So instead of running percentage changes off of median monthly values, as I had done for Noe Valley, I ran the percentage changes off the “95th Percentile” value of all sales occurring between January 2003 and April 2009. The 95th Percentile value represents a “high”, while excluding the potentially aberrational top 5% of sales.  Aren’t you glad you asked? (Special thanks to my wife, Nina, who looks over my shoulder at a lot of my statistical analyses — she’s the one with the one with the PhD in data-crunching.)

After looking at this chart, I sort of threw up my hands.  With only 179 sales in over 6 years, it’s not sensible in my view to draw conclusions about monthly trends in Cole Valley, let alone to compare them to Noe Valley, where the “core” area alone — Subdistrict 5C — had over 900 sales during the same period.

So I re-ran the numbers and calculated medians based on annual sales.  The second chart (click) shows the results.

cole-valley-annual-sales-chart1

I think this is much easier to understand.  Again, with so few sales, one should be careful about drawing any conclusions, and with only 5 sales in 2009 so far, I think it’s too early to conclude that the apparent drop in median prices for 2009 will continue to be accurate.  Rather, I’d say that Cole Valley seems to have been holding up pretty well.

Stay tuned.  I can’t help myself.  Coming up, Cole Valley and Noe Valley go head to head.

Noe Valley Postscript: Median Price Chart

I’ve been having an interesting discussion with a regular reader of theFrontsteps, where I first posted my chart on Noe Valley Percentage Change from All-Time High.  He disputes the fact that Noe Valley has fallen by 30% from its all-time high (reached in March of 2008) because he claims — I think — that March was aberrational.  I’ve looked again at the data for that month and I disagree.  What’s more I think that if you look simply at median prices (moving averages), they show a pretty extended upward trend from the beginning of 2006 through March 2008, with the exception of a dip during the Fall of 2007.  Here’s the chart (click to enlarge).  Enough said.  I’m moving on to another subdistrict.

noe-valley-median-prices

Districts 3 and 10, R.I.P.

The Excelsior, Bayview, Hunter’s Point, Oceanview, Ingleside:  these are some of the neighborhoods included in the San Francisco Association of Realtors’  MLS (Multiple Listing Service) Districts 3 and 10.  It’s been suggested here and elsewhere  that perhaps these non-“core” San Francisco neighborhoods have been pulling down San Francisco’s home prices disproportionately.  The theory, plausible enough, is that these more modestly-priced neighborhoods would be feeling the effects of the economic slowdown more than the tonier “core” neighborhoods, whose denizens’ bank accounts might provide a little more padding against hard times.
I recently published a chart that compared the percentage change of Districts 3 and 10 from their all-time highs to that of the city as a whole.  Some readers of theFrontSteps expressed an interest in seeing what the chart would look like if you excluded those districts from the data set for the city as a whole.  (Districts 3 and 10 make up over 20% of the city’s single family home sales for the 5 year period covered by the chart.)  I aim to please, so I ran the numbers again and here are the results.
focus-on-dists-3-and-10-vs-all-dists

The chart confirms, once and for all, that however you want to cut it – with or without Districts 3 and 10 – home values for the the “core” San Francisco Districts have fallen almost as far as those for the outer Districts.  They just took a little longer to start falling, that’s all.

Bottom line:  We don’t have Districts 3 and 10 to kick around any more.  I’m going to start rolling out comparisons of specific districts and neighborhoods to the city as a whole (ie.  “All Districts”), starting with some that have supposedly weathered the market reasonably well.  I think you’ll find the results surprising.  I know I did.

Just How Bad Is It? (Answer: depends)

I’ve been digging a bit deeper into the raw data that’s used to generate the beautiful graphs you can find here and which I used to generate the MLS District graphs in my blog of a few days ago.

So I thought I’d check how September 08’s median home prices (condos will come later) compared to their all-time highs and to the median prices of a year ago, both by MLS District and for all of San Francisco.  I didn’t include District 8 (North-east) because it doesn’t have enough data to be useful, and I also didn’t include the southern-most districts of SF (3 and 10) because to be honest I don’t follow them closely. Here’s the result:

So clearly prices are down from their all-time highs across the board.  (Most districts were still hitting highs or near-highs well into 2007, by the way, and District 5, which includes Noe Valley had its top 3 highs in 2008!) )  But where the drops are really big (Districts 6 and 7 for example), that could simply be due to the fact that the all-time high was aberrational.

The percentage change from a year ago are interesting because you can see how some districts seem to be doing quite well.  Half up, half down.  Once again, though, with sales volumes down across the board, there are less data points and that can skew the numbers.  But it certainly seems like the tonier districts (1, 5 and 7) are holding up better than the others.  (Take a look at my graph from a coupla days ago to see how the districts compare over time.)

Bottom line(s)?

San Francisco single family homes are down over 11% from a year ago.

The more expensive neighborhoods seem to be doing ok.