Noe Valley Still Goin’ Down?

Author: Jack French -- Used under Creative Commons Permission 2.0

Back in May 2009, I showed that Noe Valley was not immune from the slump in prices affecting the rest of the city, despite suggestions to the contrary from real estate agents, mavens and media.

Have things gotten any better?  Well, no.  And maybe.

Here’s a chart showing percentage change in single family home prices for the last 14 months, relative to their all-time highs  (click to enlarge).  (All figures are 3 month moving averages.)

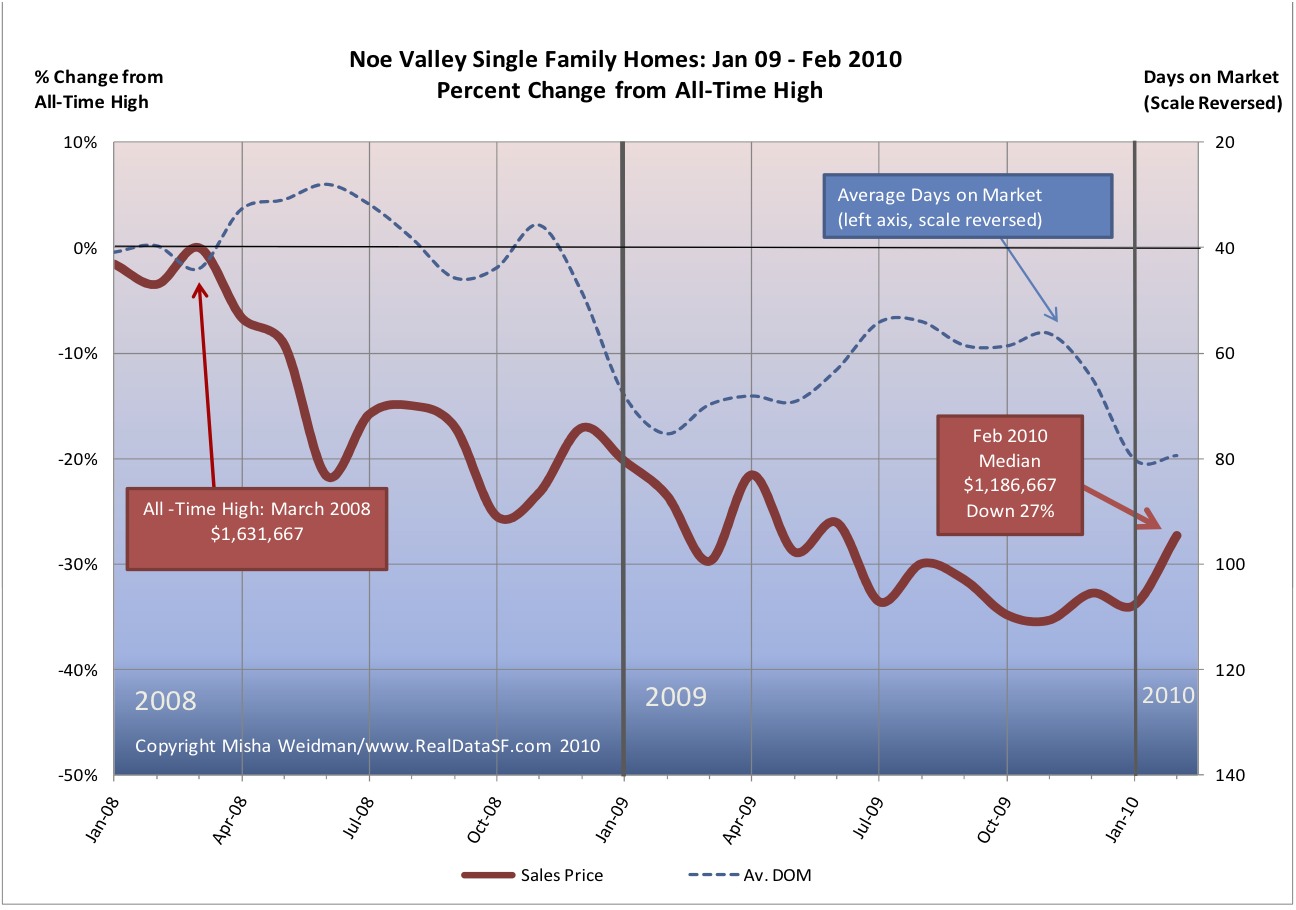
After reaching an all time high in March 2008, prices plummeted.  Just a year later, in the midst of fears of a global Depression, home prices were down 30%.  Did things get better?  No, they got substantially worse.  Despite an impressive  city-wide recovery in 2009, with prices going from 30% down to around 18% down for single family homes at  year’s end (see more detail here) , Noe Valley home prices continued to retreat.  In October and November 2009, prices were down 35%.  At year’s end, they’d barely clawed back two percentage points. Not surprisingly, days on market (DOM) remained stubbornly high for all of 2009.

Still, with cherry blossoms busting loose all over Noe Valley’s quiet streets, there certainly seems to be a change in the air.  There are many more listings coming onto the market and there’s even the occasional feeding frenzy over a clean, well-priced home.  These go in a matter of days, not weeks. Maybe that upturn in prices for January and February suggests a continued warming trend.

In the next few posts, I’ll look at Noe Valley in more detail, including how condos have fared.

A Faltering Housing Market?

George may have left office a year ago, but there appears to be a growing consensus that the likely shape of the recovery will be a “W.”  How appropriate, if you believe that we are reaping the bitter fruit of his administration’s policies.

A front page article in the Business Section of last Wednesday’s New York Times, grimly entitled An Upturn in Housing May be Reversing,” pulls together recent and contradictory data from various sources, including Case-Shiller, Moody’s, and The National Association of Realtors.  The conclusions are sobering.

There is a growing consensus that the positive national sales data that we’ve seen over the last few months is faltering.  Much of the recent activity, for example, was stimulated by the anticipated expiration of the “First Time Home-buyer Tax Credit,” originally set to expire in November, and now extended through April of next year.  Essentially, this means we’ve “borrowed” from future sales.

Also, despite some positive economic news and decent sales volumes, there’s been little improvement in sales prices because inventory levels – read “foreclosed properties” – remain so high.   Mary Maitland, VP of the S & P Index that publishes the Case-Shiller Index foresees a “W” pattern for the housing market, with prices this winter testing the lows we saw earlier in the spring.  Am I allowed to say “I told you so?”

The NY Times article has a cool interactive chart for specific MSA areas including “San Francisco” — remember this covers 5 of the 9 Bay Area Counties.