
Before we get deep into the numbers, let’s review some of the year’s milestones and, um, millstones.
Continue reading “The 2023 Real Estate Wrap-Up: Down from the Heights!”

Before we get deep into the numbers, let’s review some of the year’s milestones and, um, millstones.
Continue reading “The 2023 Real Estate Wrap-Up: Down from the Heights!”
 (Photo courtesy of Henri Borius @ IG_Henri_Borius_Photos)
Noe Valley, where I live, is supposed to be sunny. But I can tell you that – until this July 4 week-end’s delightful respite — I was getting tired of waking every morning to another milky white sky and a temperature reading that seemed stuck on 50º. It’s not just the weather that’s been gloomy. One article after another seems to take delight in enumerating San Francisco’s travails. The Economist, among other magazines, opines that downtown San Francisco may risk falling into a “doom loop.” The San Francisco Chronicle followed up with a list of major retail vacancies after Westfield gave up its flagship property on Market Street. And the Financial Times, in an article titled “Defaults Raise Alarm Over Stability of San Francisco’s Commercial Property,” quoted the chief executive of the company that owned two major hotels given back to their lenders as saying “San Francisco’s path to recovery remains clouded and elongated by major challenges” including “concerns over street conditions”.
Indeed. Downtown San Francisco resembles what I remember it looking like in 2001 after the dot.com bust. More broadly throughout the city, you’re lucky if you can find a restaurant whose kitchen stays open after 9:00 pm. And homelessness continues to plague the city, just as it does the state more generally. The Benioff Homelessness and Housing Initiative’s recently released report found that over 171,000 people experienced homelessness daily in California. That’s more than 30% of the nation’s homeless population.
Shall we talk about interest rates (see below)? With 30 year fixed mortgages going for around 6.5%, we are back at rates last seen right before the 2007/2008 Financial Crisis brought the party to a close. For anyone who’s counting, that was fifteen years ago. And the speed of the increase has been breathtaking: rates were at 3.25% just 18 months ago (second chart). Fed policy may not have succeeded in taming inflation yet, but it’s certainly had its effect on the housing market. No one should be surprised.


Happy New Year everyone! It’s been nearly three years since the Covid pandemic hit the world. Back in March 2020, as San Francisco’s streets became eerily quiet, it might not have been wrong to predict an apocalyptic end to the modern world and city life in particular à la Station 11, ( I highly recommend the Amazon Prime series). As people fled the city and its density, predictions for SF’s real estate collapse propagated faster than new Covid variants.
Fast forward to mid-2022: both house and condo prices hit records of $2 and $1.3 million respectively. For the full year, the median house price ended down just 1% from the all-time high set in 2021; condos ended down just 2% from the previous year. Covid, Schmovid, you might say.


A quick reminder that Property Taxes are technically deemed delinquent if received after 5 pm on December 10. Since that falls on a Saturday this year, you’re probably ok if they receive payment by Monday at 5 pm or your payment is postmarked before that time. At least that’s the case in Sonoma County and Santa Clara County. Of course, San Francisco’s website chose not to be that clear. You always have the option of paying online.
Continue reading “Property Tax Reminder and Two Charts on the State of the Market”

If I simply posted our most recent charts on the San Francisco residential real estate market, you could be excused for shrugging and concluding “another crazy month in San Francisco.” The median price of a single-family home hit $2.050 million in April, just $10,000 down from its all-time high of the previous month. The median price of a condominium in April was $1.365 million, an all-time high. Single family homes were on the market for an average of 11 days; 15 for condos. Both were near record lows. To put things in perspective, take a look at the table below to see how things compared to April 2020, just after the pandemic hit, and last month.
Continue reading “San Francisco’s Red-Hot Residential Market: The Times, Are They A-Changin’?”

A very happy New Year to my loyal readers and apologies for the long delay between my last newsletter and now. Between a death in the family and a very busy end-of-year, my newsletter got put on the backburner, if not taken off the stove altogether.
But enough of that. Let’s dig into the data!
The Executive Summary
For those that want the big picture fast, the table below summarizes key metrics for the market as a whole.

While the price data may be interesting, what really strikes me is the absolute explosion in Dollar Sales Volume ($13.55 billion), which must have been driven by a combination of (a) a massive increase in condo sales (4590 units), (b) a very healthy increase in house sales (3075 units), and (c) huge increases in the number of properties that sold for $3 million or more (766 units at over $3 million; 203 at over $5 million).
Houses: Still As American as Apple Pie
Despite the breathless predictions (once again) of the bottom dropping out of the San Francisco real estate market as locals fled to cheaper, cleaner, more suburban areas during or because of the pandemic, 2021 saw the city hit its highest median price for single family homes ever ($1.8 million), a 12% increase over 2020. In fact, the last year houses had a decline in prices was in 2011 at the end of the Great Financial Crisis (second chart).


As we’ll see with condominiums, these broad metrics disguise some interesting trends. Perhaps unsurprisingly, given how well those at the top of the socio-economic levels have done notwithstanding the pandemic, luxury home sales (which we define as homes selling for $5 million or more) skyrocketed last year to more than double their pre-pandemic levels, though these remain a small fraction of overall sales (first chart below). At the same time, median sales prices for this lofty price tier actually fell by 7.5% (second chart below). “Months Supply of Inventory” (MSI), which is a rough ratio of available inventory to demand, returned to pre-pandemic levels for both luxury and non-luxury homes, (third chart below). However, the luxury segment had seen an enormous increase in MSI during 2020. Since a higher MSI suggests a “cooler” market, its return to an MSI of around 8 in 2021 might signal better price performance for luxury homes in the future.


Houses in Your Neighborhood
Here’s a table with key metrics for houses selling in various neighborhoods. If your neighborhood isn’t included, or if you’d like a more specifically mapped area, please contact me.

Condominiums – Still a Mixed Story
I’ve previously posted about how condo prices suffered during the pandemic as their generally younger techie owners or tenants moved to areas with more outdoor space and took advantage of “remote work” opportunities. Still, as the first chart below shows, condo prices overall suffered only a 1% decline in 2020. And in 2021, prices were up 3% over the previous year, an increase in line with the 2% to 5% annual rates of increase we’ve generally seen since 2017.

However, as also noted in my previous newsletter, both the 2020 decline and the 2021 increase disguise a more complex picture of what’s going on with the condo market. In a nutshell, newer mid- and high-rise neighborhoods like Mission Bay and China Beach where most new condo buildings are concentrated, were hit harder in the pandemic than the city as a whole and those same neighborhoods are recovering more slowly (first chart below). And “luxury” condos (defined as selling for $2 million or more) appear to be seeing substantially better price improvement (2.7%) than those selling for under $2 million (1.3%) (second chart below). Finally, though luxury condos, like luxury homes, represent a small fraction of total condo sales (about 13%), their sales in 2021 nearly doubled their pre-pandemic levels. Non-luxury condo sales also increased significantly over pre-pandemic levels, as the third chart below shows.


Condominiums in Your Neighborhood
Here’s a table with key metrics for condos selling in various neighborhoods. If your neighborhood isn’t included, or if you’d like a more specifically mapped area, please contact me.

Pandemic? What Pandemic?
The pretty robust market we’ve seen in San Francisco is, if anything, even more robust throughout other areas of California. In the California Association of Realtors’ most recent survey, the amount of real estate activity throughout the state is exceptional. I’ve highlighted some of the major takeaways in the slide below. Perhaps the most astonishing of all: 60% of all offers were non-contingent (no appraisal, financing or inspection contingencies!).

Predictions. Not.
Patrick Carlisle, Compass’s oft-quoted Chief Market Analyst, is our “secret sauce” and one of the most sophisticated residential real estate analysts working today. Most of the charts I use for my newsletters are the results of his research. (For those wanting even more charts, you can see Patrick’s SF Report, without commentary, here.) Patrick is generally loath to make predictions, and, while I’ll call it the way I see it and risk being wrong, right now I don’t see a clear long-term direction for the market. In the short term, I think this Spring is going to be a very strong buying season as anticipated interest rate increases push people into the market out of FOMO. Similarly, a strong rebound in rental rates might cause renters to re-evaluate. And, of course, if the silver lining to the Omicron variant is to turn Covid into an endemic that we can live with, a return to something like normal life should reinvigorate the city’s appeal.


Longer term, a suddenly shaky stock market and uncertainty about the mid-term elections, the next Covid variant, Ukraine, and inflation may cause a shift that no one sees coming. As the 8-ball says, “Ask Again Later.”
As always, your questions, comments and referrals are much appreciated! Best wishes to all for a healthy, safe, and rewarding year to you and yours from me and mine.
Misha


In my previous posting, we looked at how well the single family home market held up during 2020 and continues to do so, particularly at the luxury end. The story for condominiums is more complex, with prices for those located in highly urban neighborhoods like South of Market/South Beach/Mission Bay, still below their previous highs but with levels of activity suggesting that a rebound is either underway or imminent. Read on for details!
Condominiums in the Doldrumiums?
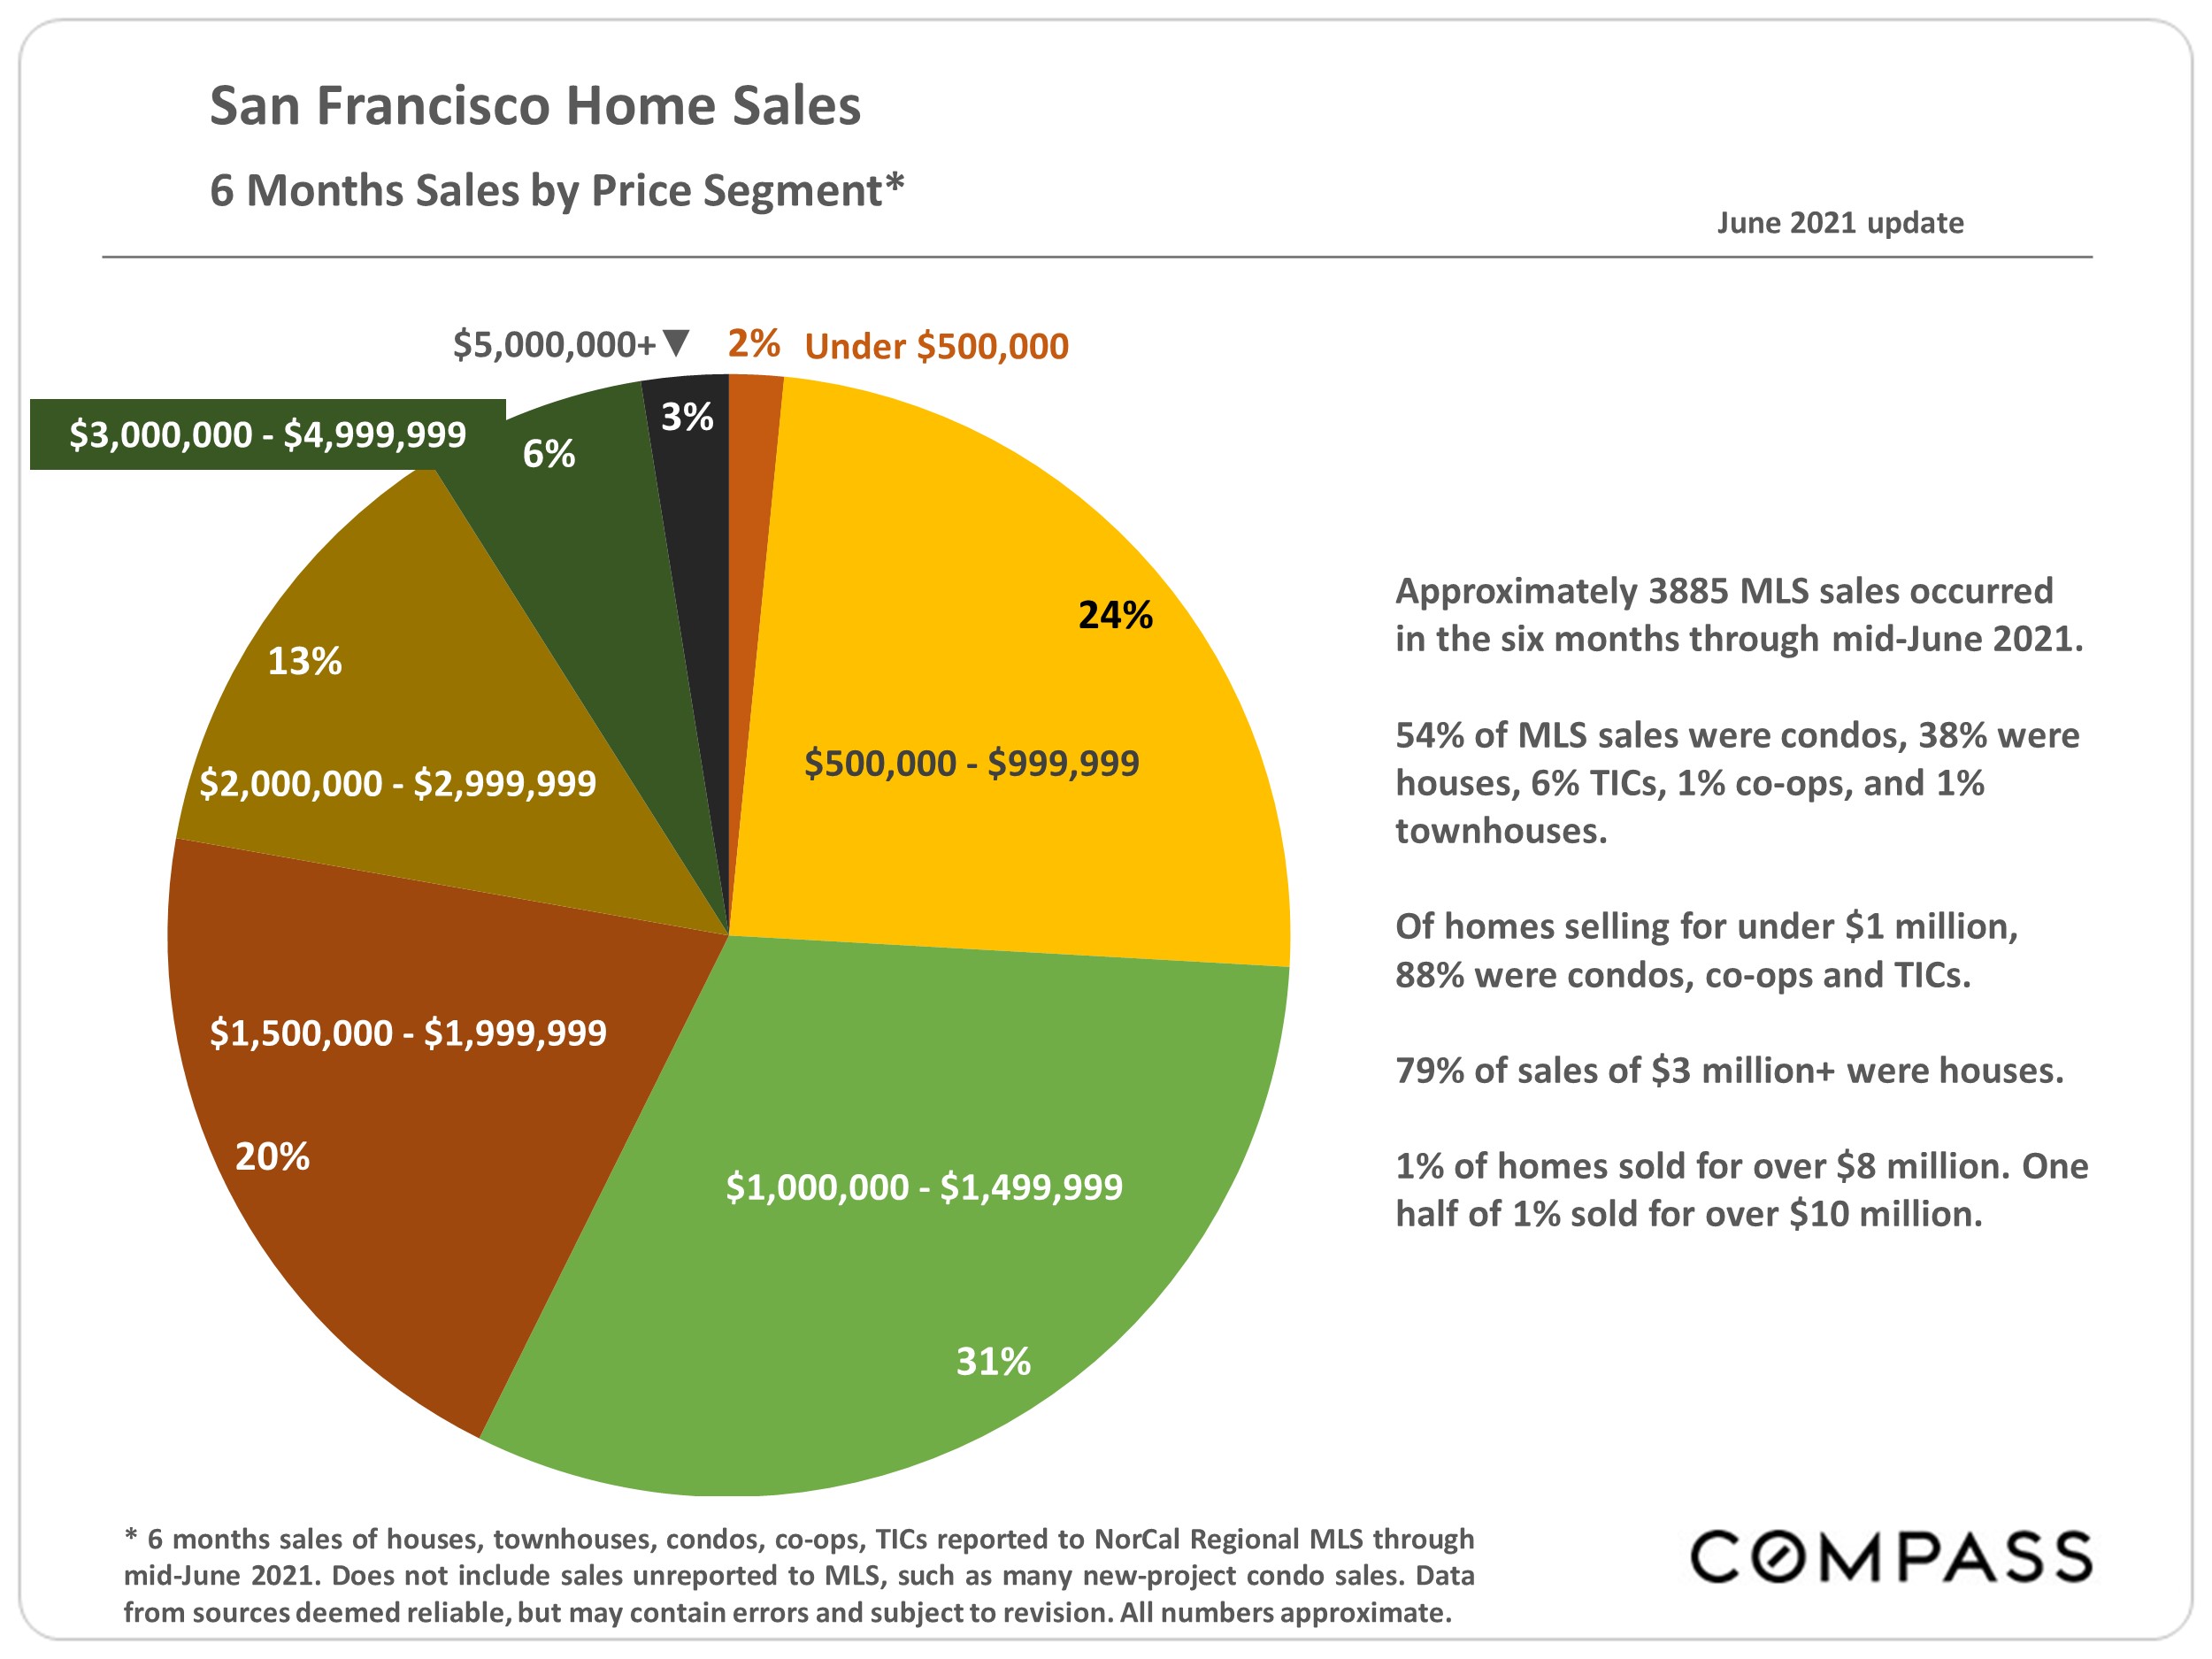
Condominiums and their ilk have comprised a majority of all residential sales for about two decades. The reason is simple: most of the new homes created since then are condos – just look at the SF’s skyline. They also comprise 88% of sales under $1 million (see side bar in pie chart below).
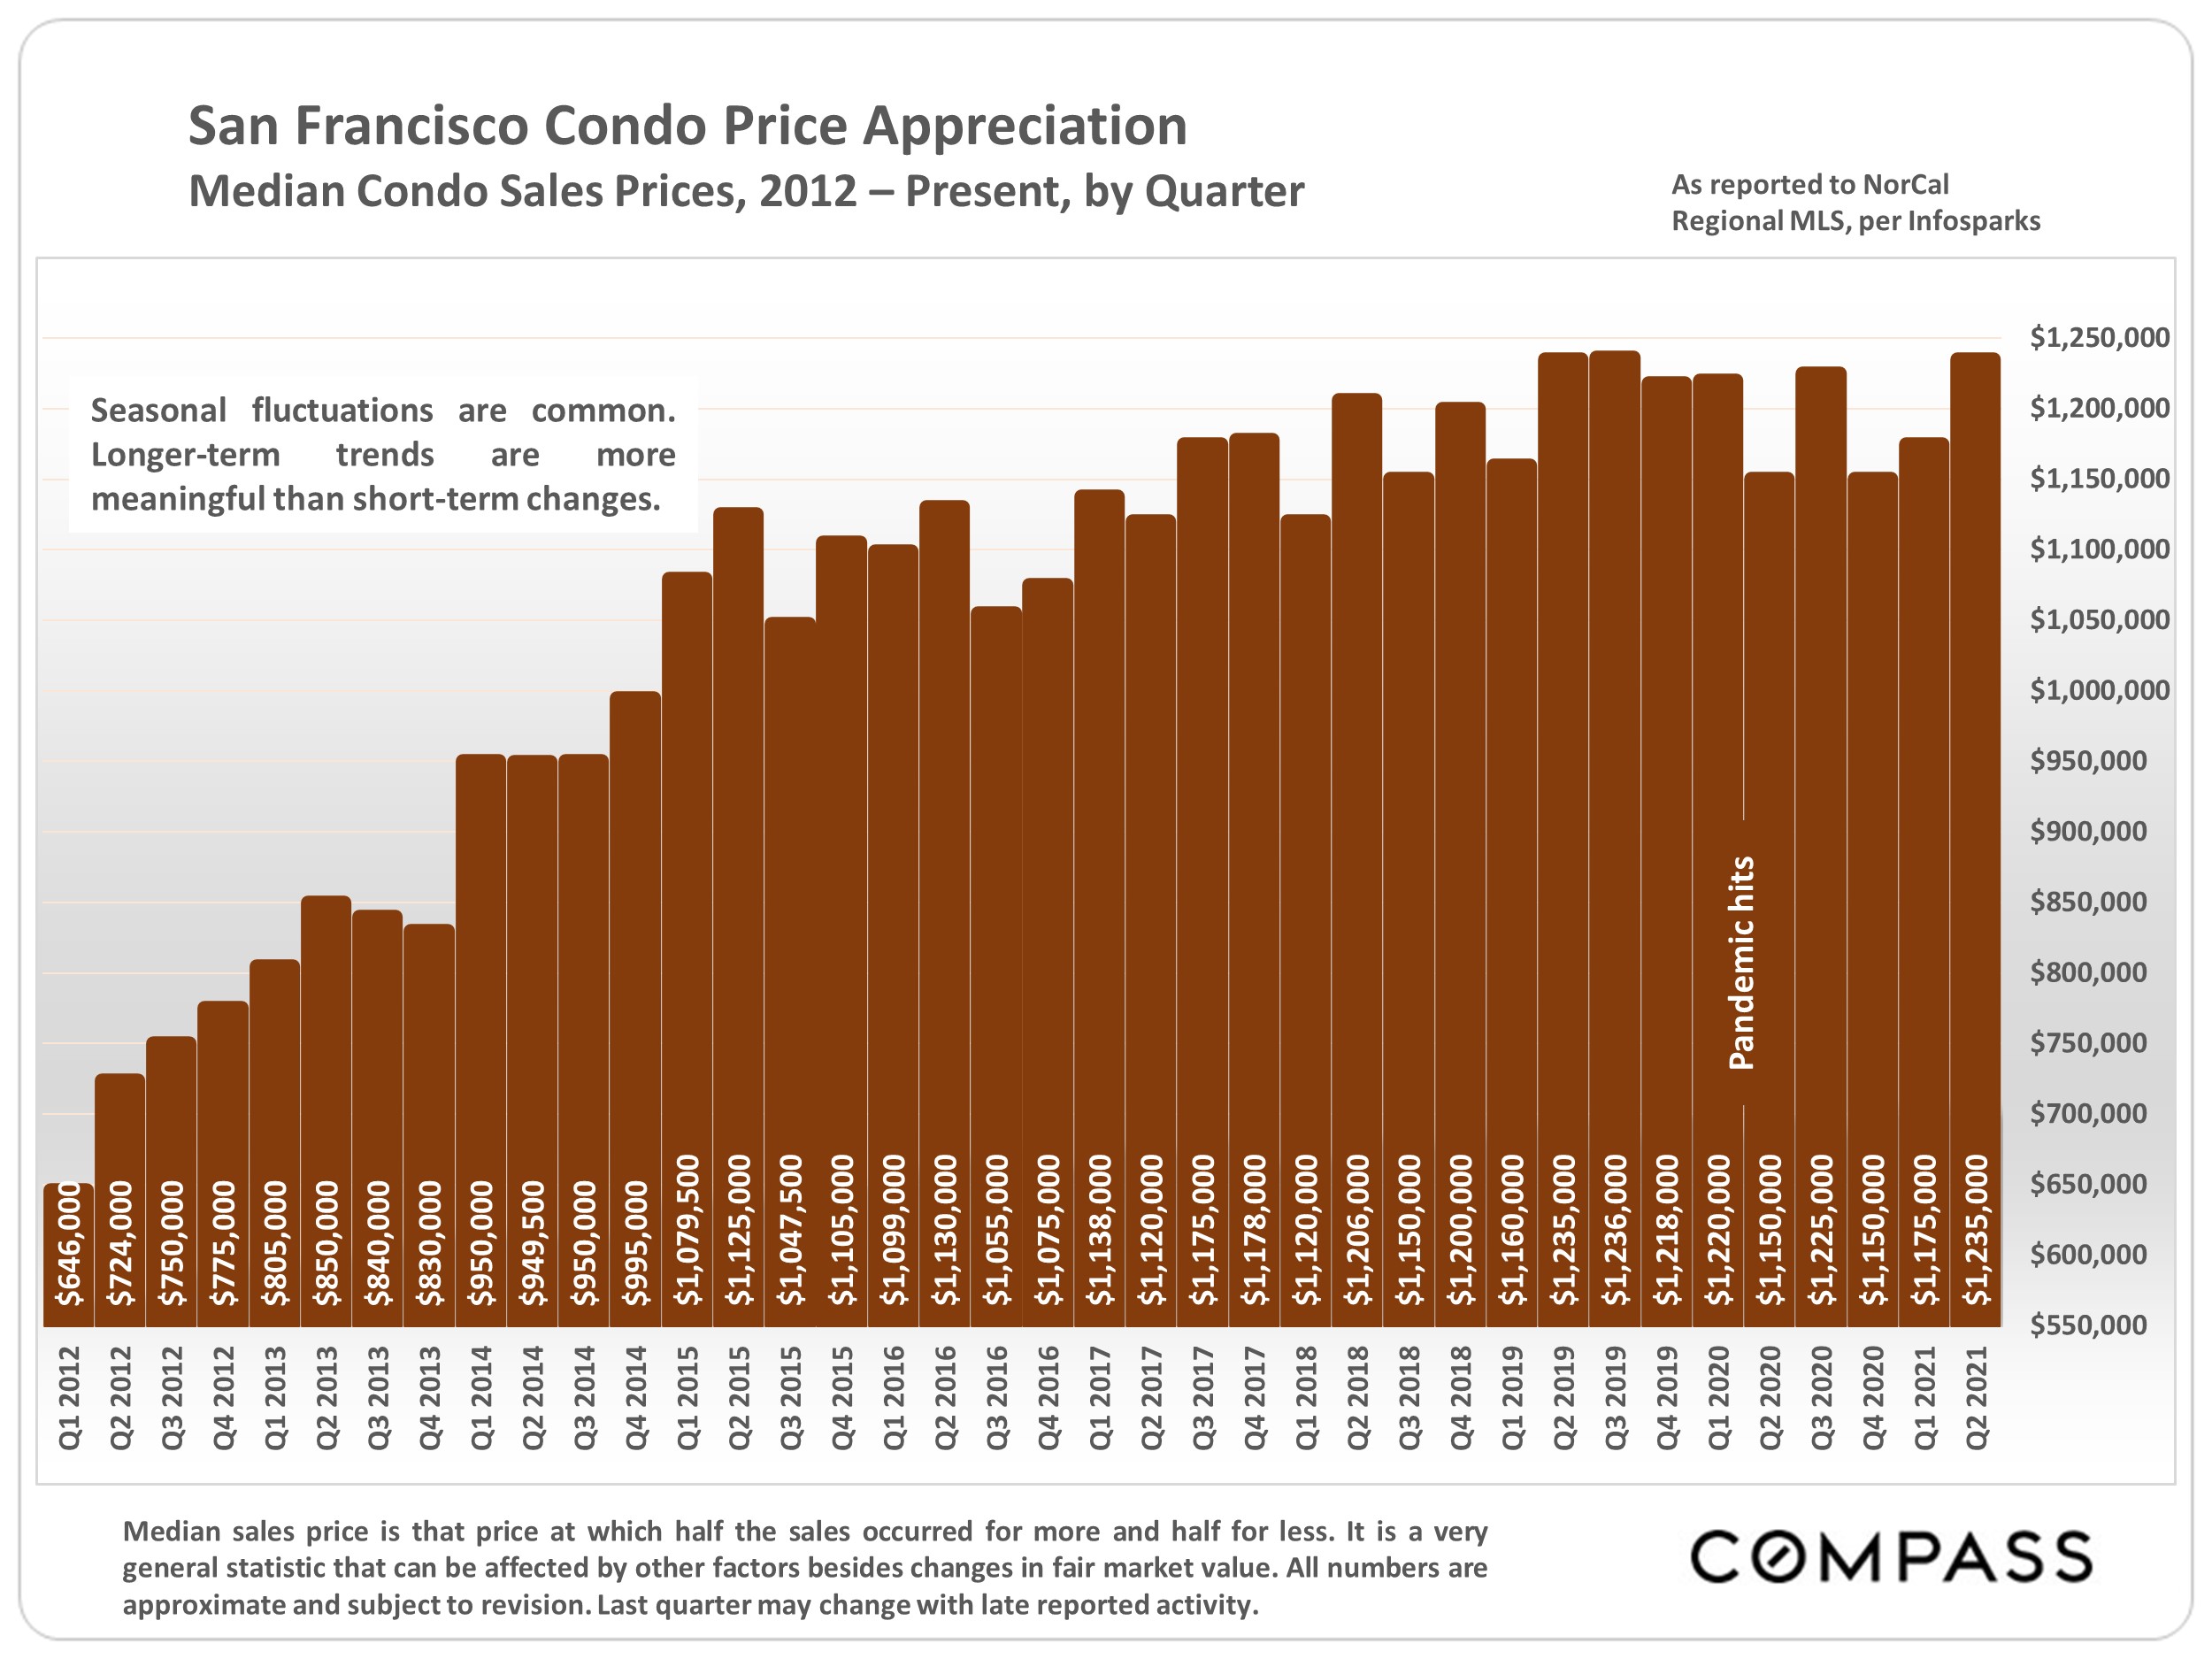
With the concentration of condominiums in downtown SOMA areas, it’s no surprise that, as a category, their prices suffered during the pandemic – for all the reasons discussed in my previous post: lack of outdoor space for socializing; the closure of bars, restaurants, and gyms; and the ability of many young tech workers to work remotely. And, indeed, while condo sales have snapped back since the start of the year, median prices are still where they were pre-pandemic.
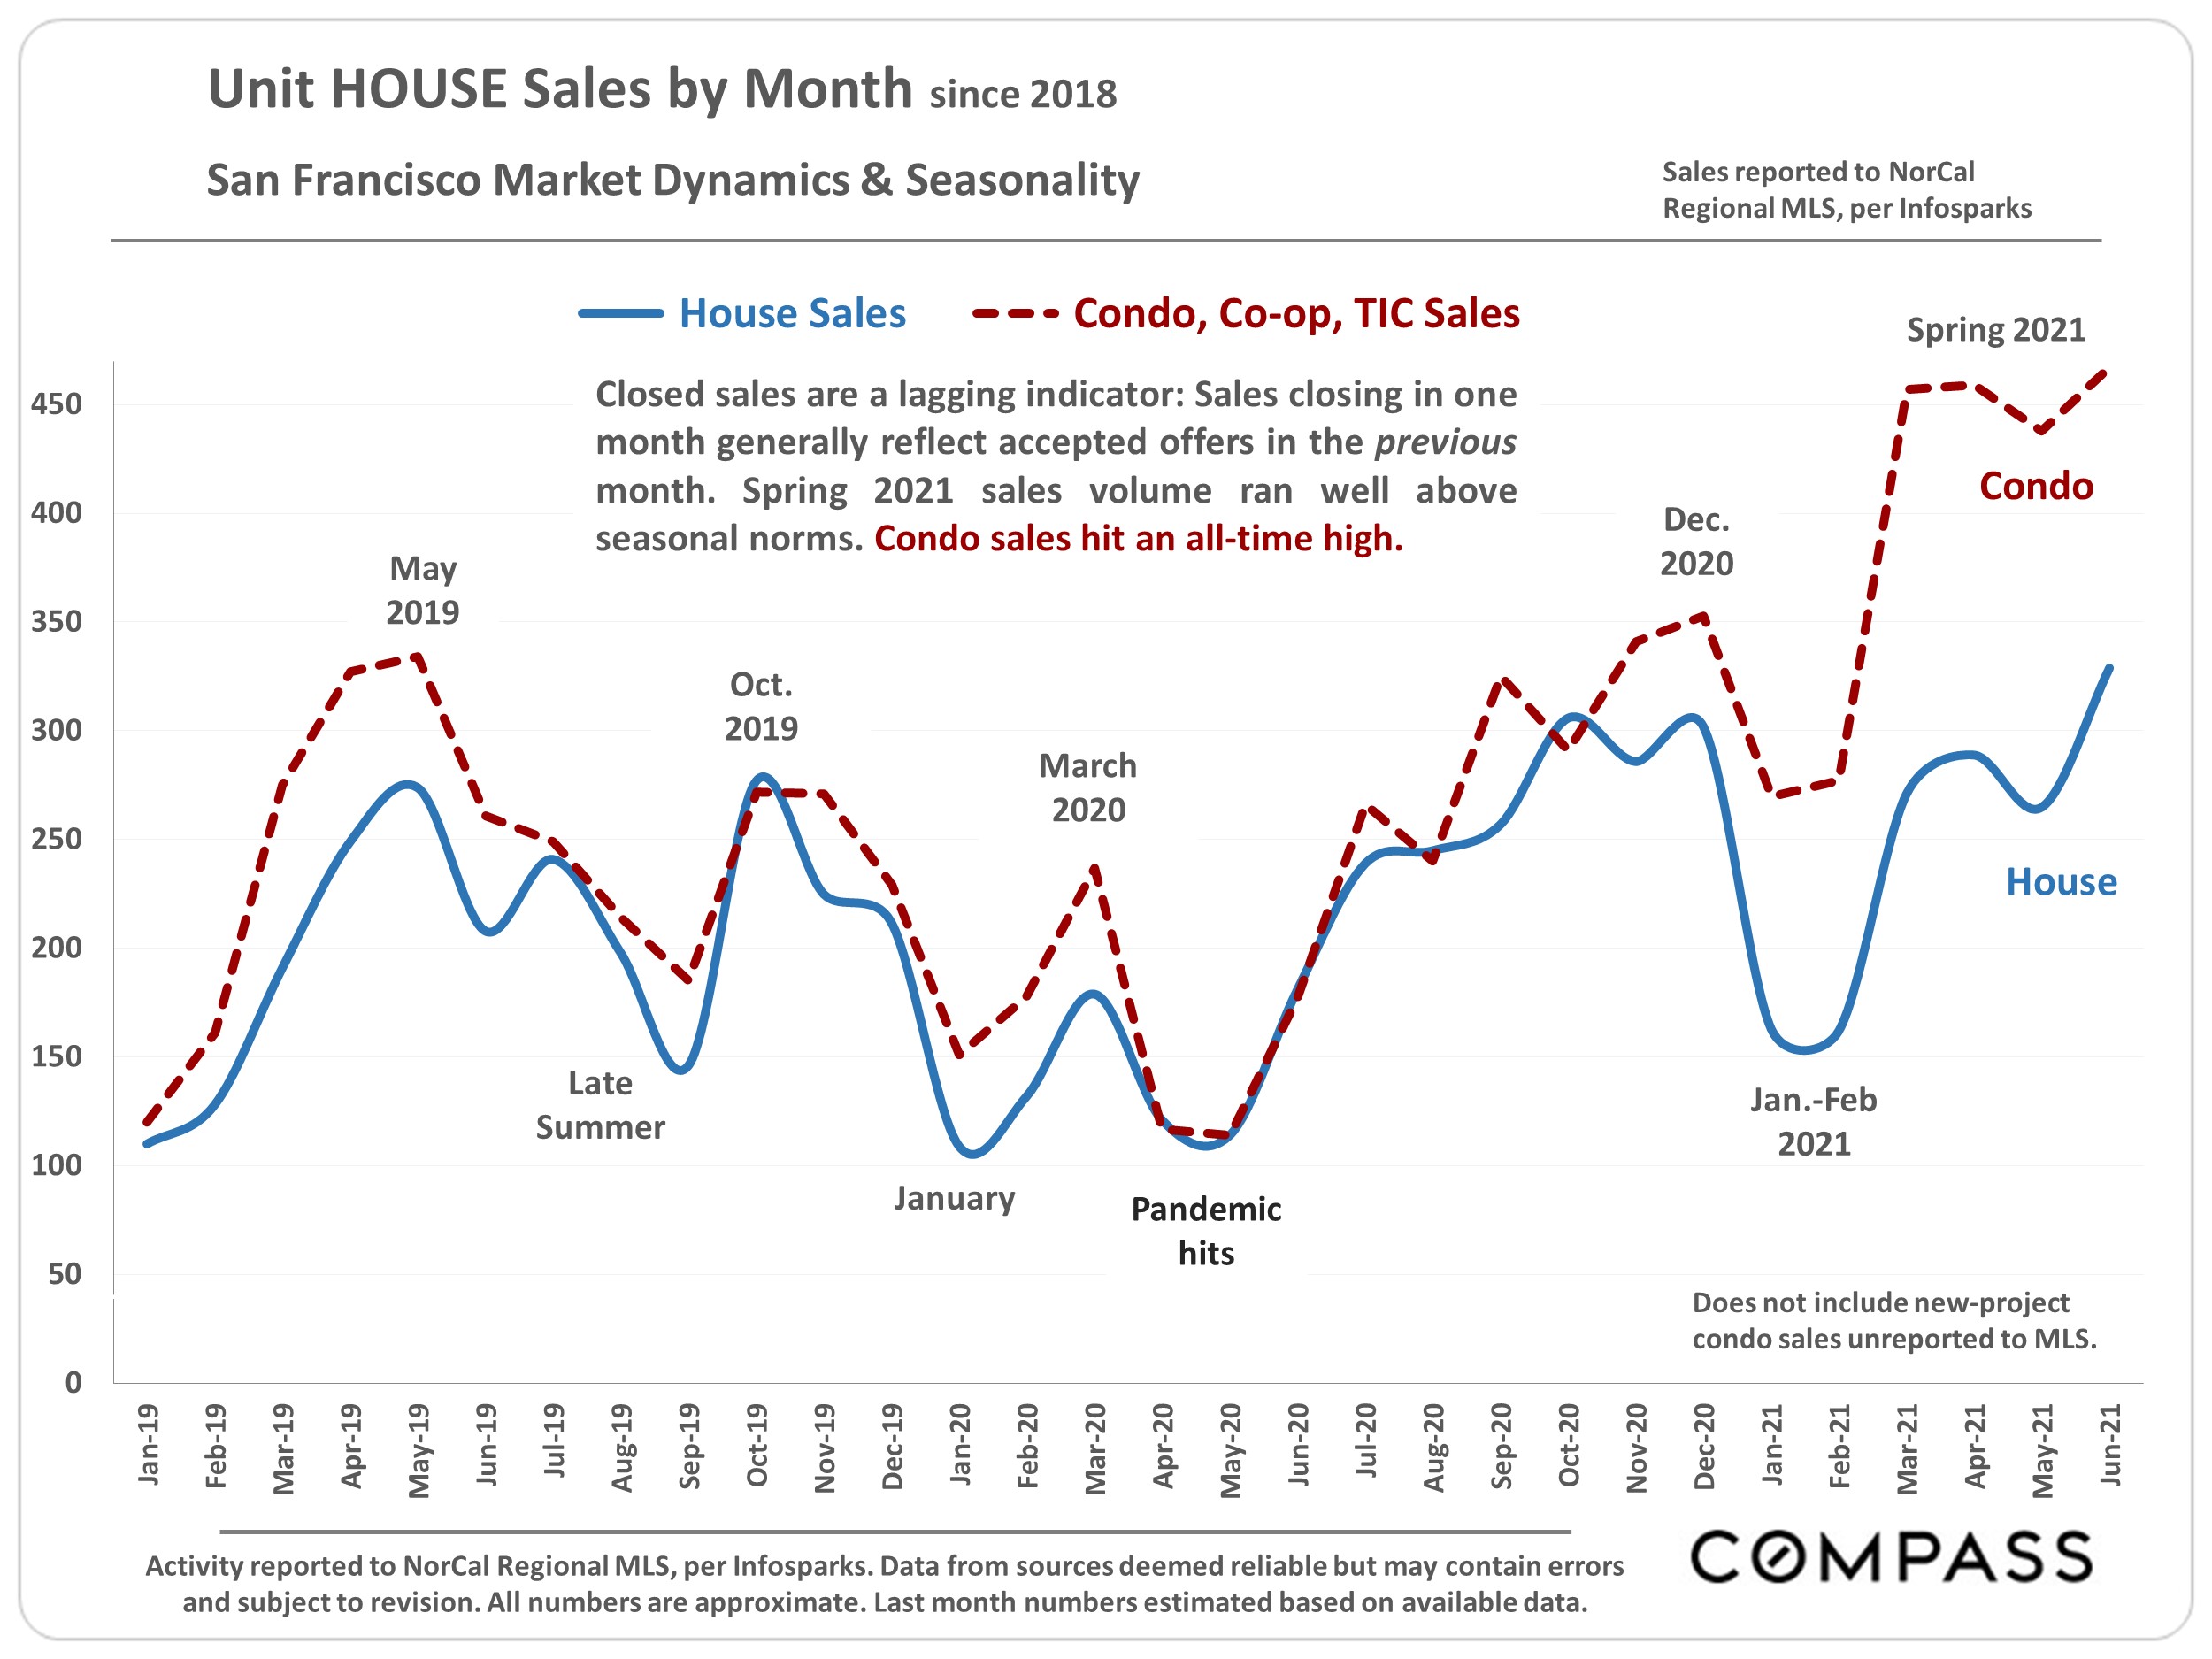
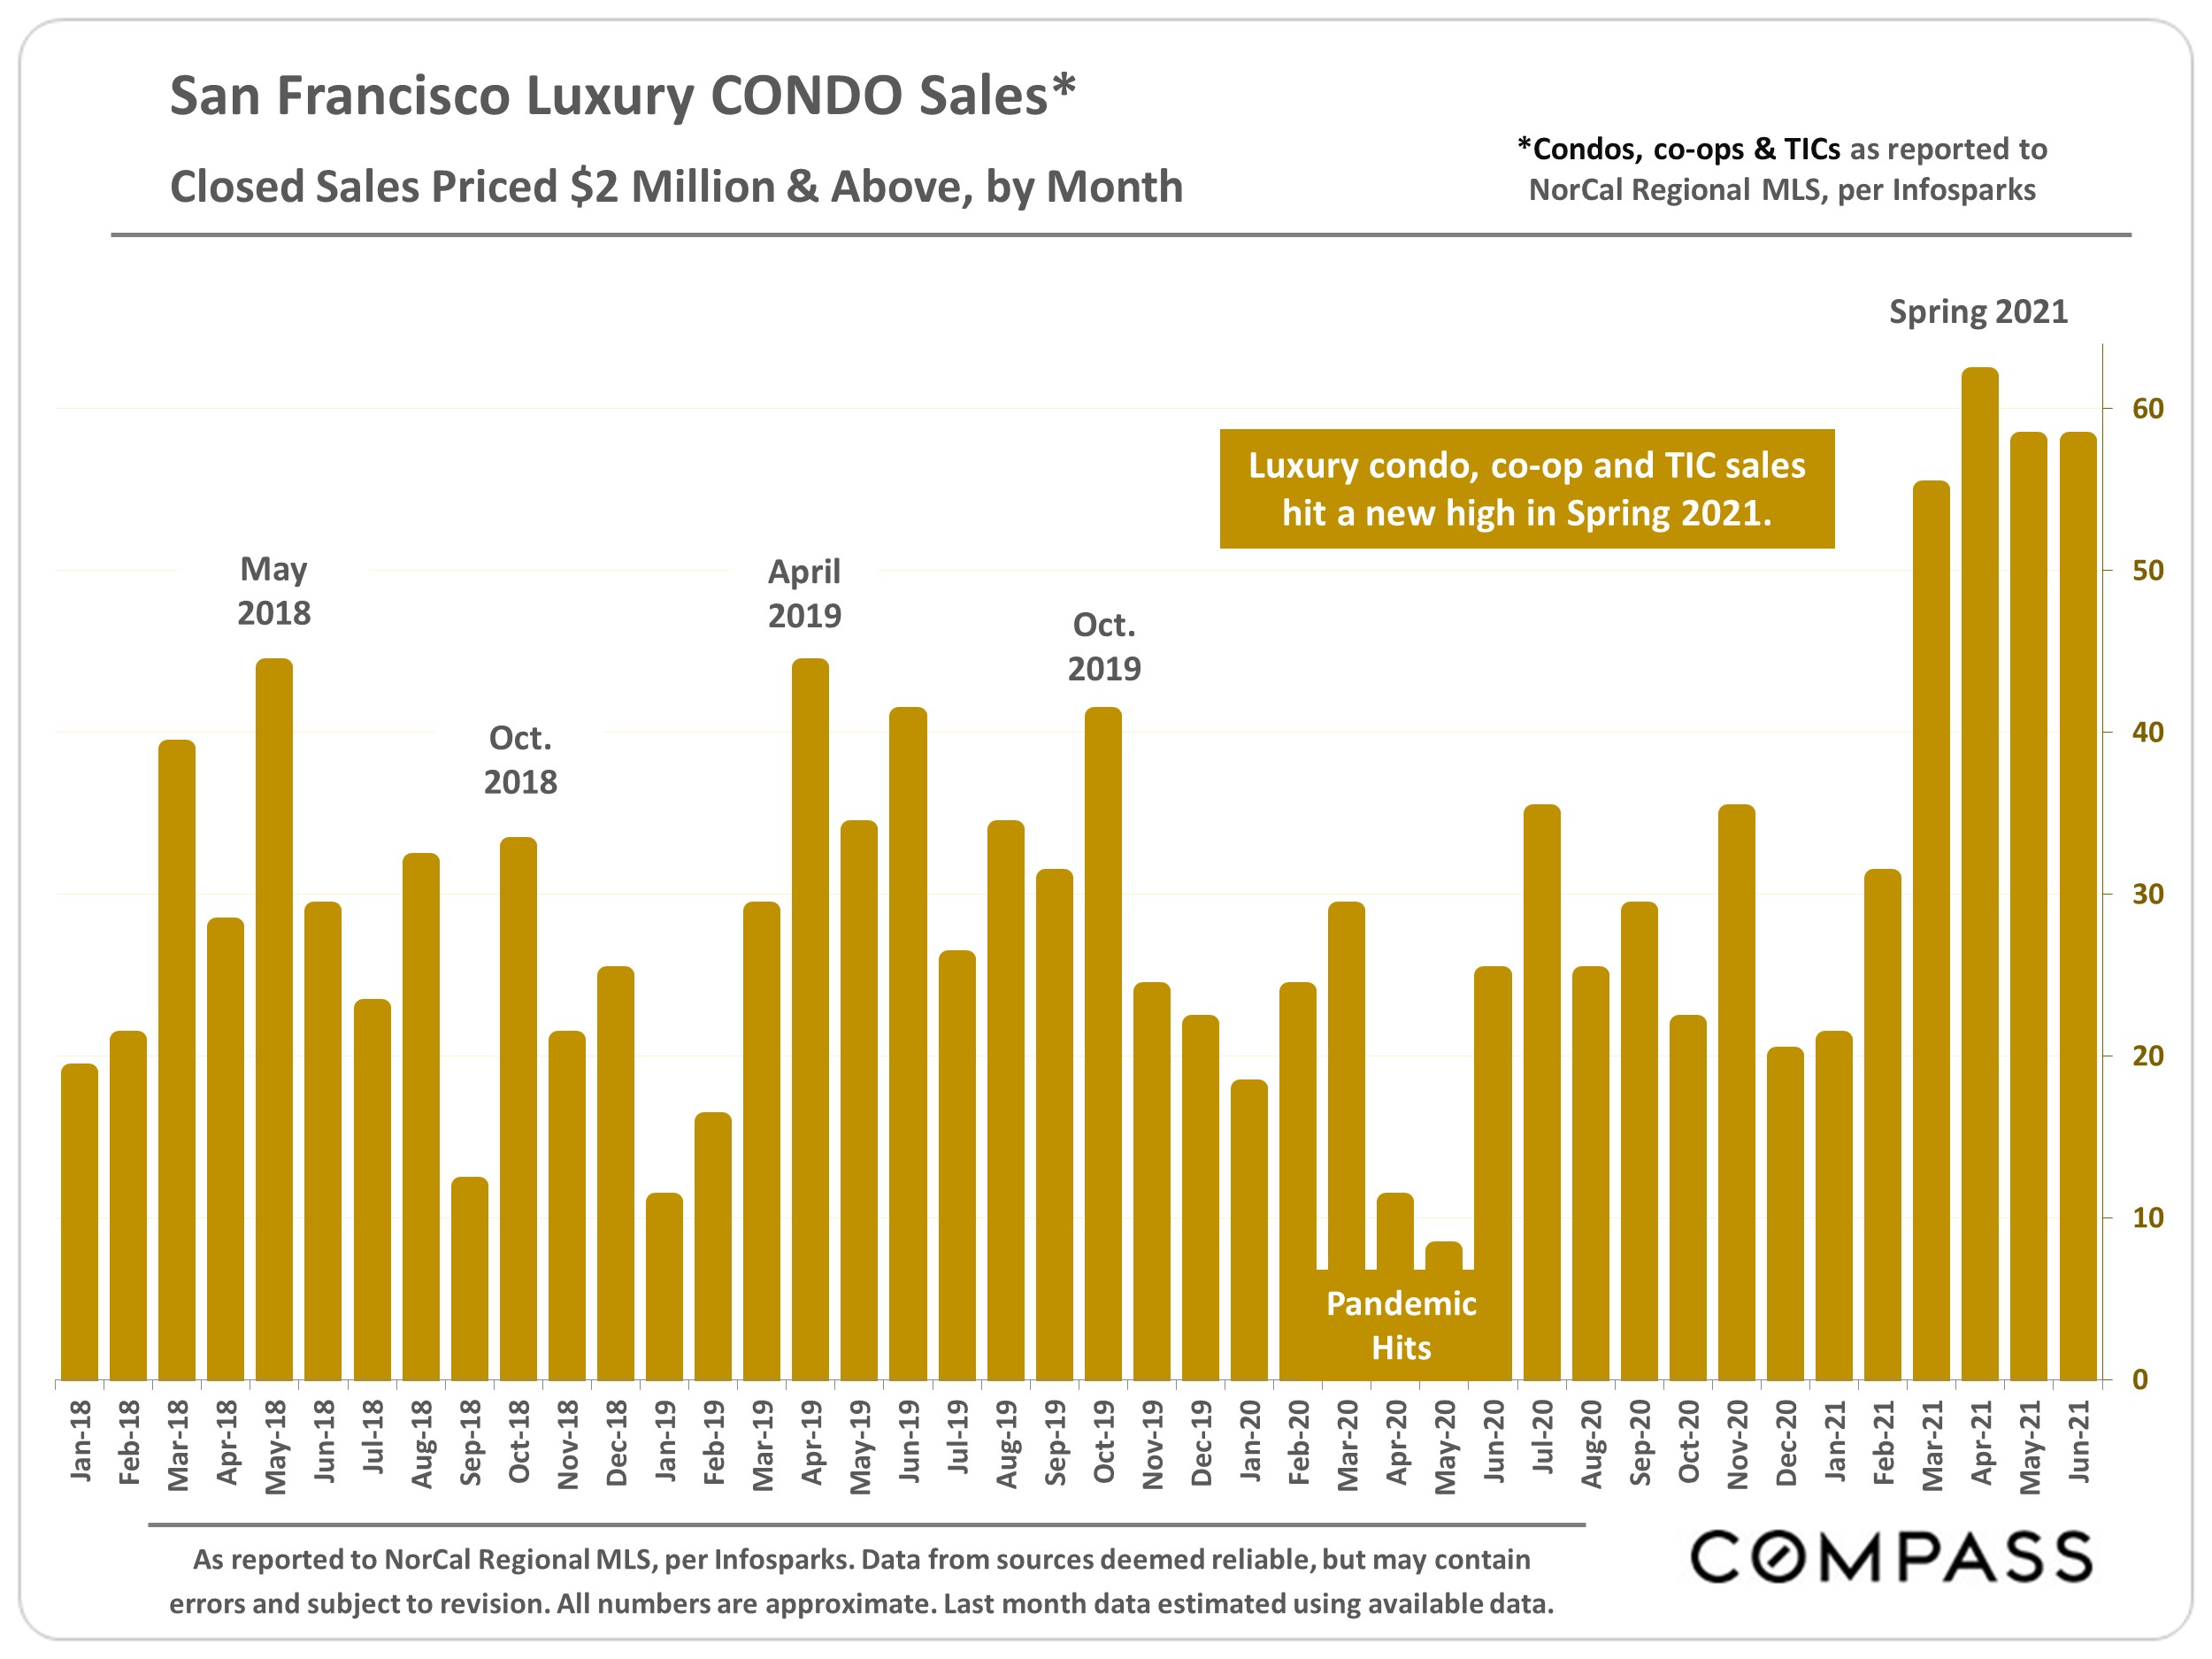
That may be about to change, however. As the next chart shows, the number of house and condominium sales have both skyrocketed as San Francisco has opened up again. But condominium sales, in particular, have reached record levels. This may well reflect the perception that condos hit a bit of a bottom and represent a buying opportunity right now.
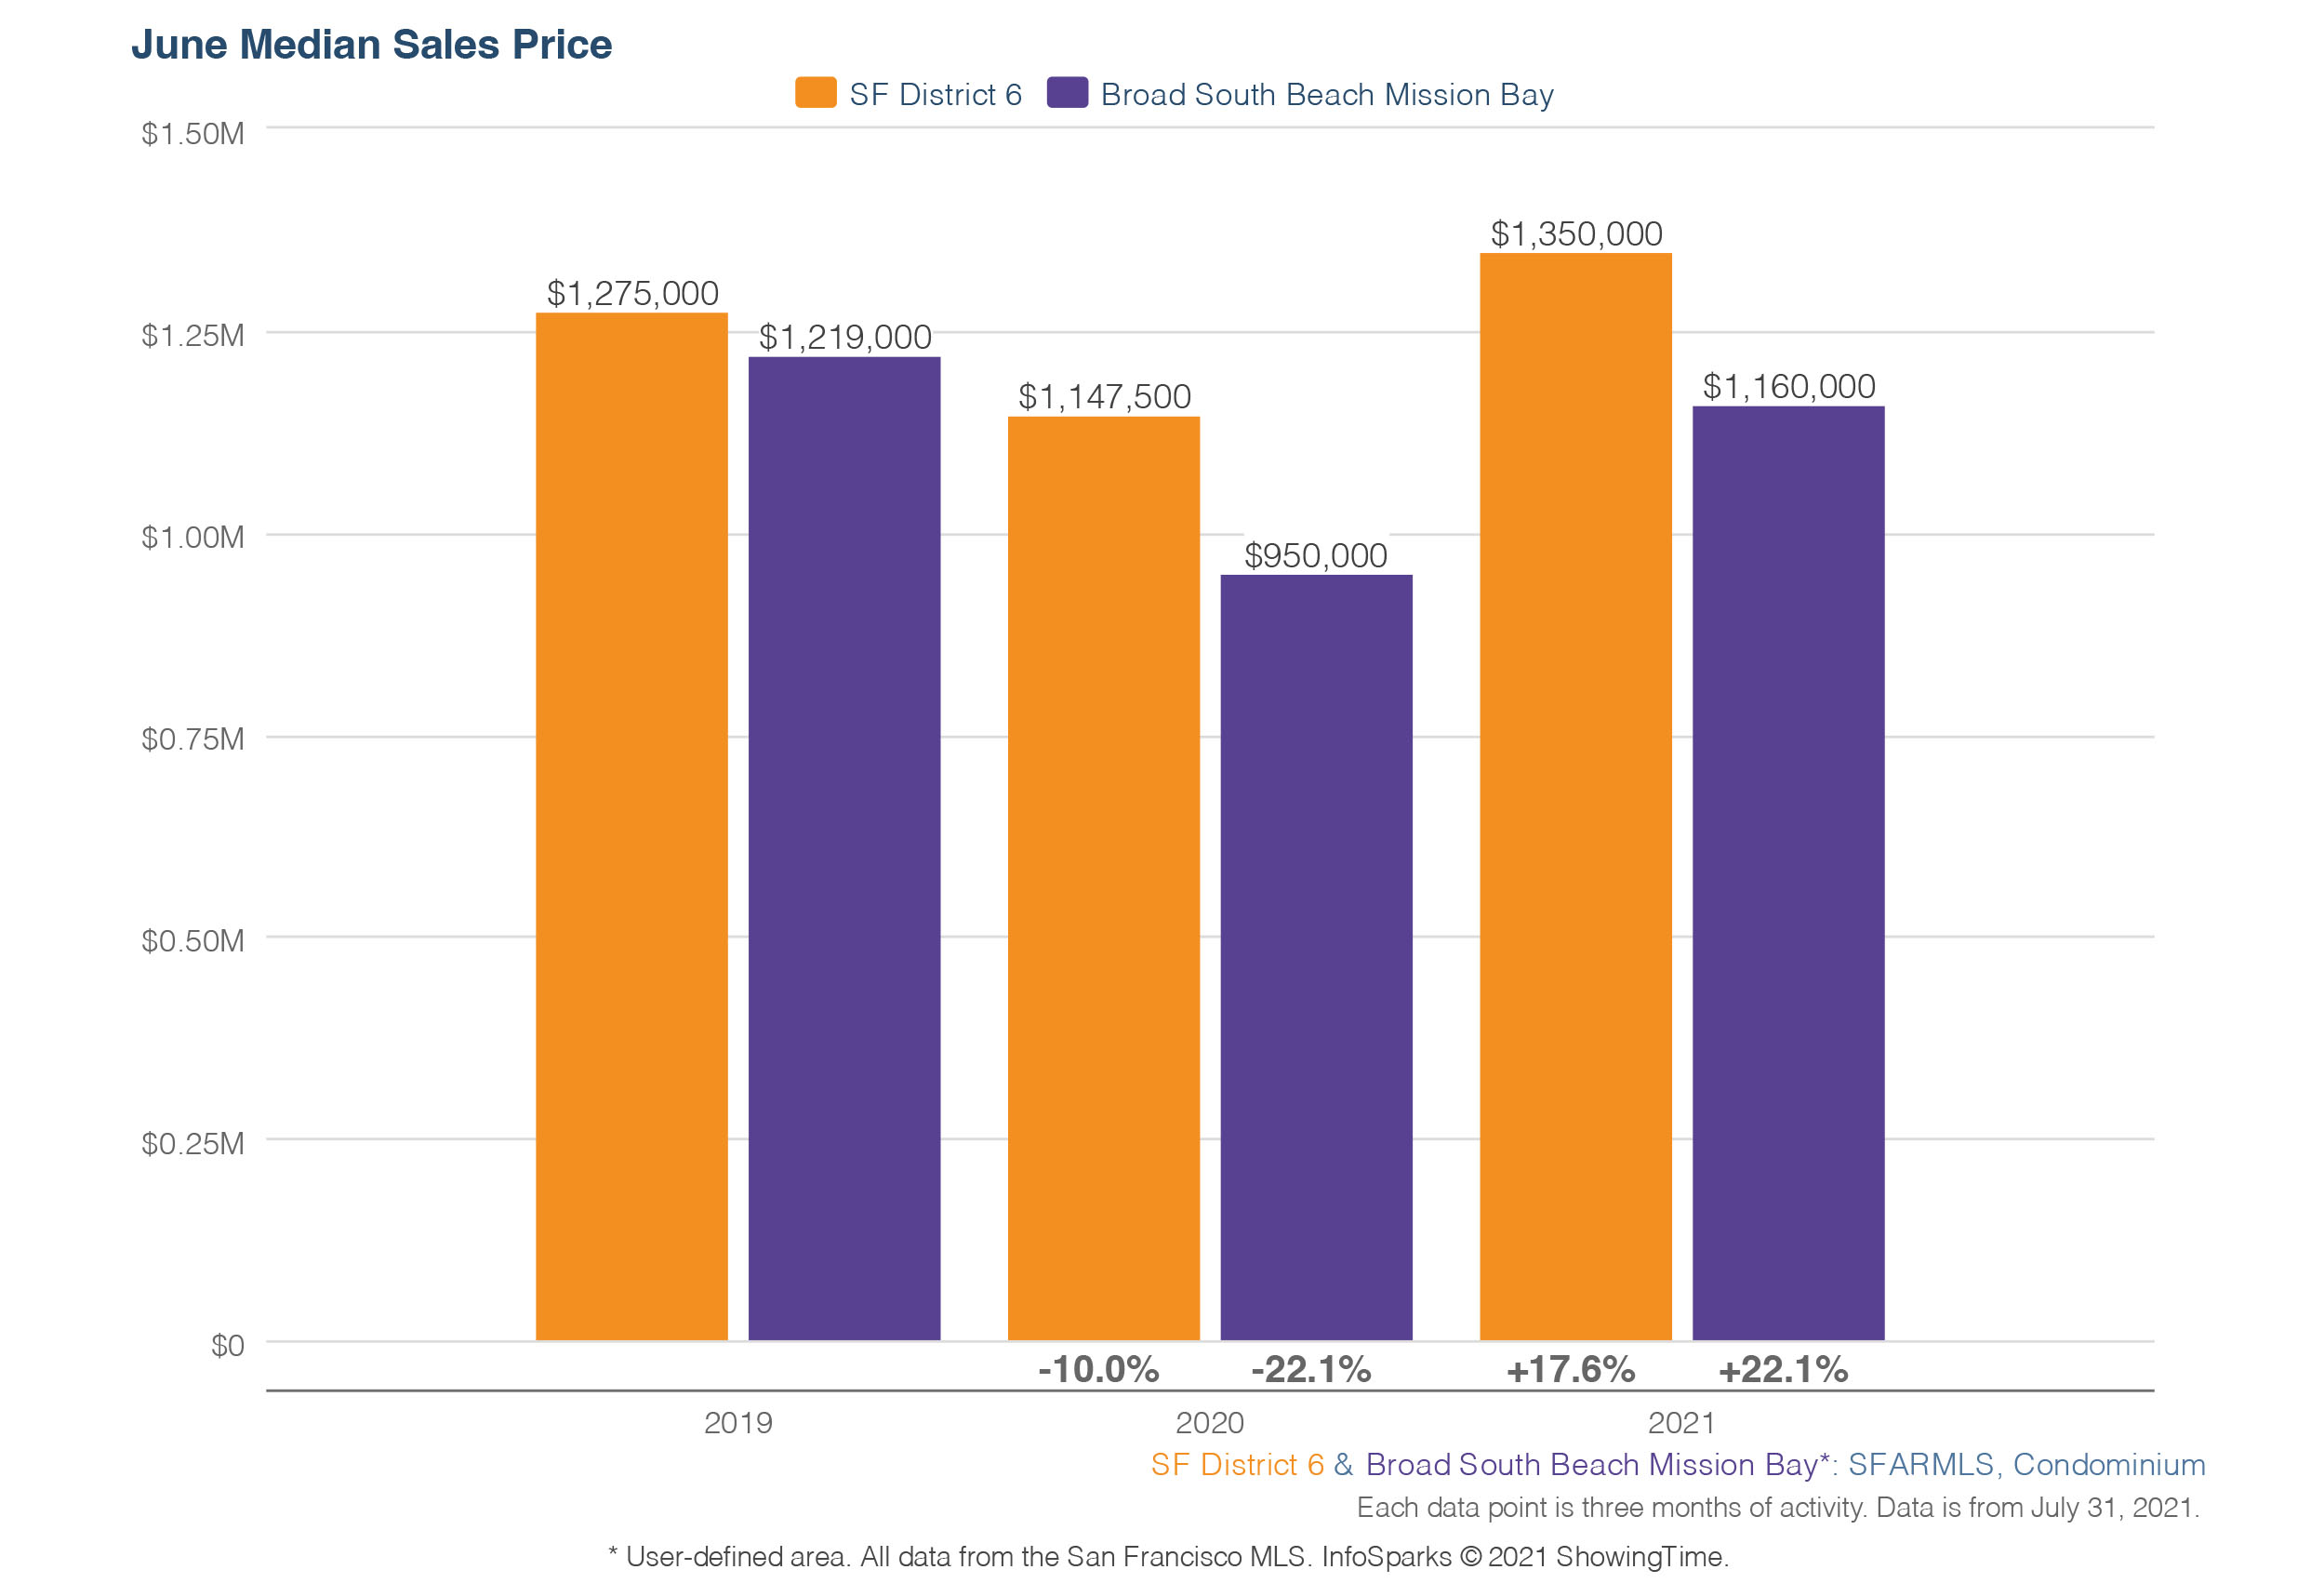
The other thing worth remembering about condominiums is that the general numbers can disguise very different performance depending on where they are located. Location, location, location is of course always highly determinative of price. But in San Francisco, if you’re buying a condo in the financial district or in the broad South of Market/Mission Bay/South Beach area (I’ll call this “Broad SOMA”), you know you’re going to be getting a modern condo in a mid- to high-rise building with no private garden or outdoor space. Anywhere else in the city, condos can vary greatly, with some having private or shared yards, some having none, and most being located in smaller older buildings.
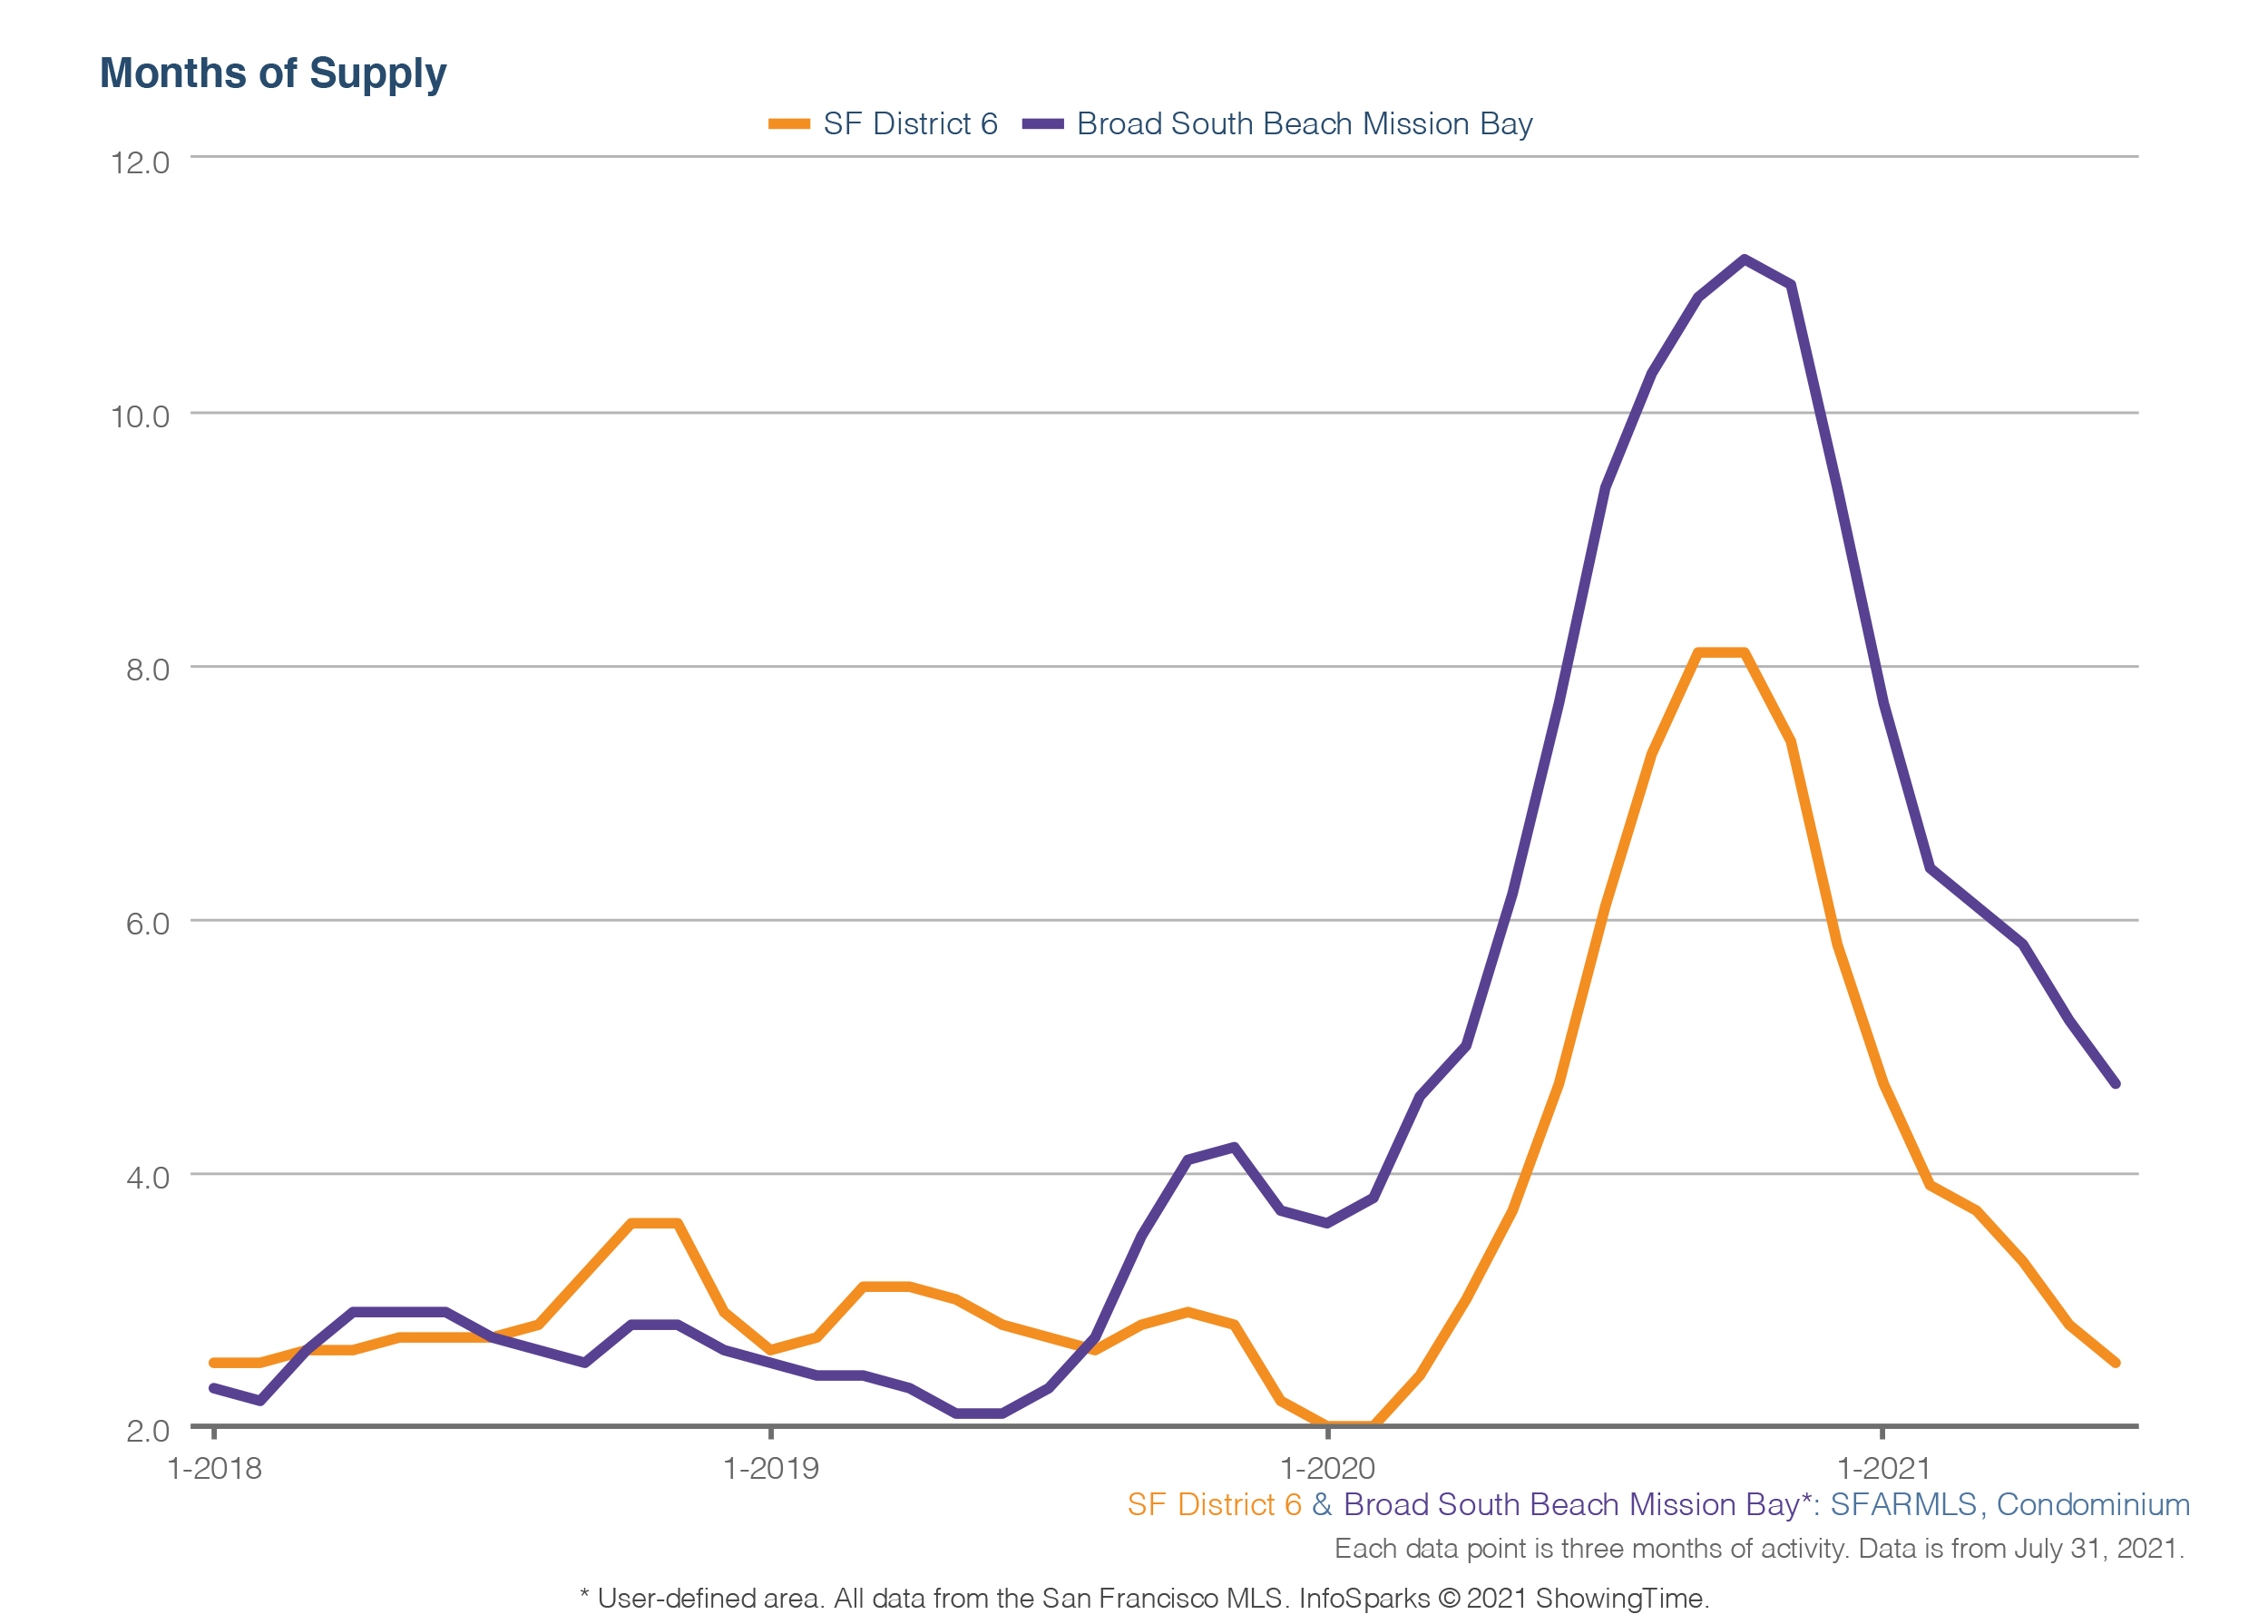
In my February newsletter, I showed that Broad SOMA condos fared poorly in 2020 relative to previous years. The charts below show how Broad SOMA condos are doing relative to condos located in MLS District 6, a “typical,” residential SF neighborhood, with a decent mix of condo types and buildings, that doesn’t skew too luxurious. The first chart shows that, no surprise, the amount of inventory available as a result of the pandemic hitting went through the roof for both area but is now back down. However, Broad SOMA remains at over 4 months of supply, whereas District 6 is back down to barely above 2 months. This shows that Broad SOMA remains a relatively soft market.
Prices have followed suit. Both areas rebounded sharply in May – July 2021 against the same period in 2020 when the lockdown was hammering the market. However, District 6 condos are now within striking distance of their all-time highs (reached just as the pandemic hit), whereas Broad SOMA condos are about $160,000 off the all-time high they reached back in December 2018.
And let’s not forget that the Covid delta variant may once again scramble the picture for condos, particularly in Broad SOMA. The final chapter has not been written on this story yet.
Luxury Condos – Nice Work if you can Get That Too
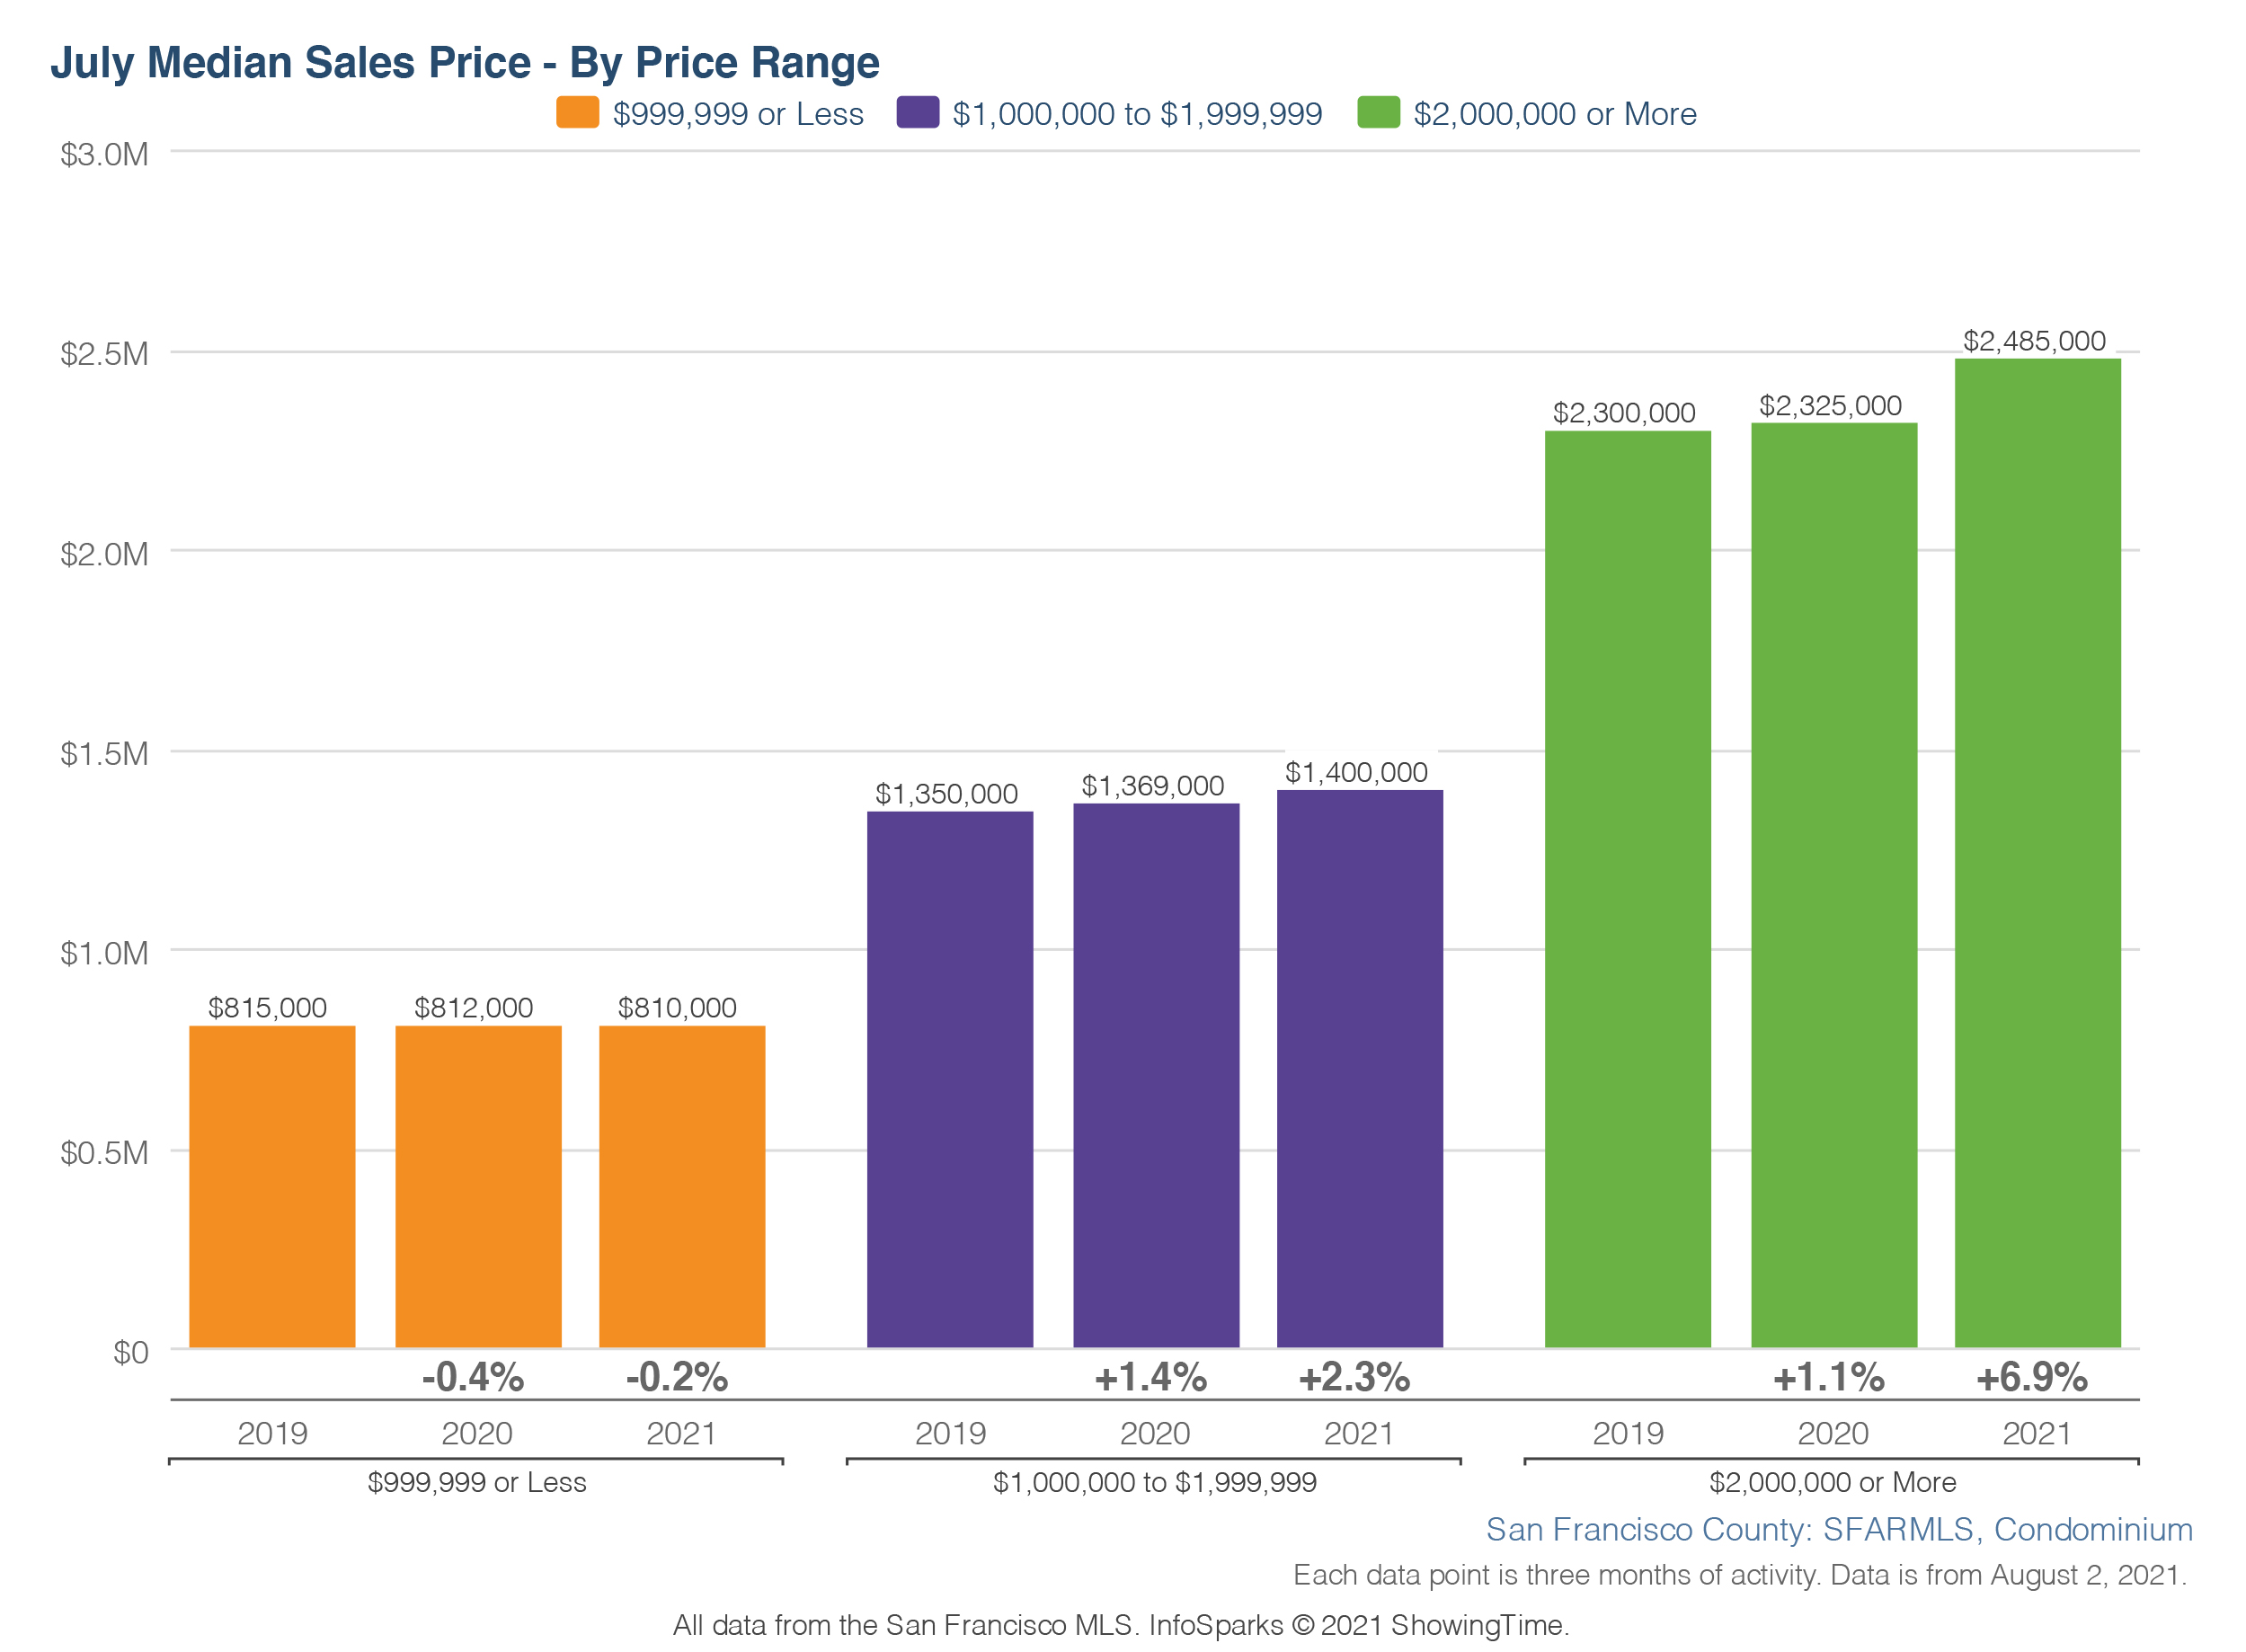
Just as luxury homes did particularly well despite the pandemic, so too have luxury condominiums. The number of sales of condos over $2 million reached unprecedented levels in recent months, perhaps reflecting a perception that now is a good time to get in before further price increases. Indeed, year over year price appreciation for condos over $2 million far exceeded that for both entry level and mid-range condos, as the second chart shows.
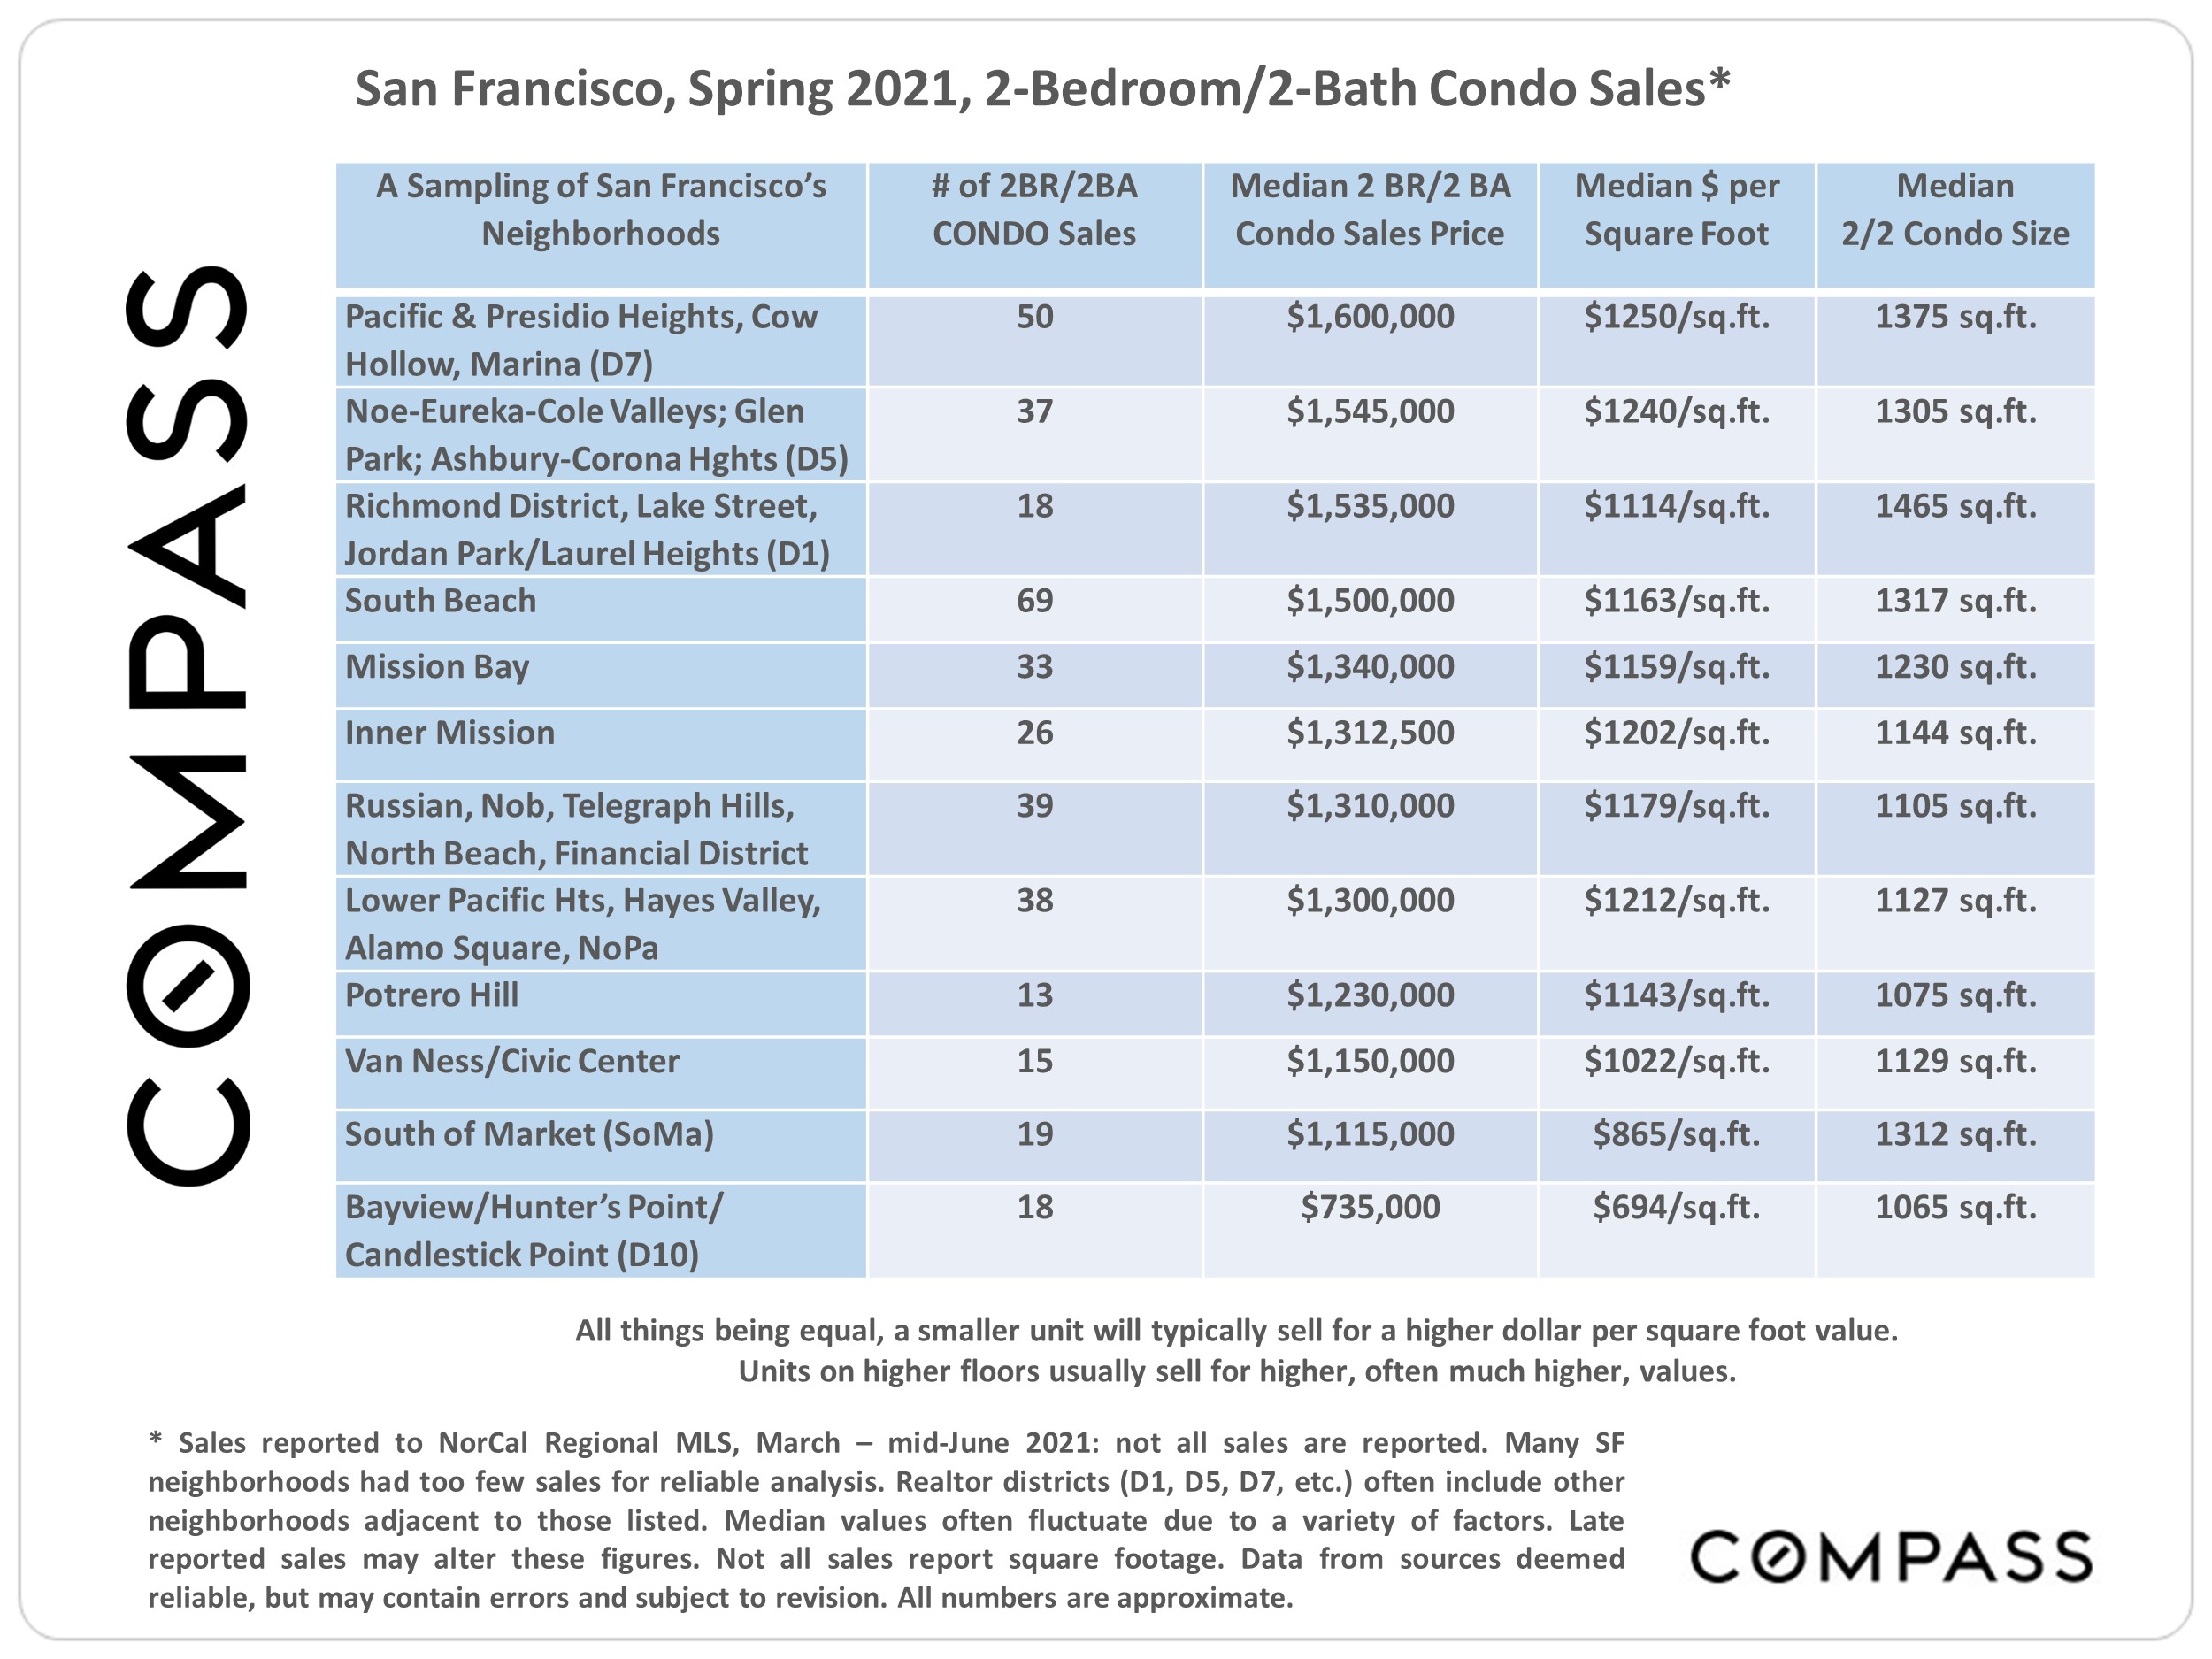
Let’s finish up with a table of 2BR condo values from neighborhoods across San Francisco. As with homes, if you’d like a specific analysis of values for your neighborhood, please email me, or you can check out the new interactive map at my website.
As always, your questions, comments, and referrals are much appreciated! And please encourage your friends to subscribe to my newsletter!