August 2021 Newsletter: So Much for the Great Bay Area Exodus: Part 1 – Single Family Homes

Back in February 2021, the august NY Times veritably crowed “They Can’t Leave the Bay Area Fast Enough,”  citing nothing less than “the end of a tech era.”  I was skeptical.  The Bay Area’s demise as a tech and people magnet had been predicted many times before.  So I’ll confess to a certain amount of relish at being proven correct when, just a couple of weeks ago, the self-same paper announced that “tech workers who swore off the Bay Area are coming back.”  That would be obvious to anyone who has been driving Bay Area highways since mid-June.

Back in February, when I posted my last newsletter, it was already clear that much of the Bay Area real estate market, including San Francisco, had held up quite well during the pandemic.  The sole exception were condominiums, and especially those concentrated in downtown and South of Market high-rises, where a number of factors contributed to something of a sell-off:  lack of outdoor space for socializing; the closure of bars, restaurants, and gyms; and the ability of many young tech workers to work remotely.  Recent data shows that all segments of the market have only continued to improve since then.

There’s a lot of information to cover, so I’m breaking this newsletter into two parts.  The first will focus on single family homes; the second, which I’ll send out it in a couple of weeks, will cover condominiums.

Houses on Fire (Figuratively Speaking)

Prices barely budged downward during the pandemic from their previous high in Q2 2019 of ~$1.7 million, and some of the downward fluctuations are simply attributable to seasonal factors.  But boy have they jumped since Q2 2021 when, roughly speaking, the local vaccination roll-out and opening up accelerated.  The median price spiked to just shy of $1.9 million.  Comparing YTD 2021 to 2020, median prices have increased $150,000 or 9% over 2020 (2nd chart).  It’s interesting to compare that to the losses following the Great Financial Crisis (GFC) in 2008.

Luxury Houses – Nice Work If You Can Get It

If median house prices have reached record levels, it’s in no small part because of an unprecedented explosion of luxury home sales since March, 2021, which has helped drive the overall median price up.  Equitable or not, the people at the top of the food chain have indulged their pent-up appetite for high end homes since restrictions started to lift in the Bay Area. 

Houses have been getting bigger, as everyone tries to shoe-horn more square footage out of their existing homes or lots.  This also partly explains the increase in median prices overall.  But luxury homes seem to have done better on a per square foot basis as well, as the next comparative chart shows.  (Note, this chart’s breakdown of values tracks what I think are the low, middle, and luxury ranges in SF.  Whether “luxury” is above $3 million or above $3.5 million is a matter of, um, taste.)  While all houses have seen a YoY increase in price per square foot, that of luxury houses has rocketed up 18% to $1382.  

Here’s a snapshot of house price values in various neighborhoods across San Francisco.  Email me if you’d like detailed information on your particular neighborhood, or you can check out the new interactive map at my website.

As always, your questions, comments and referrals are much appreciated!  And a special thanks to those who have contacted me to let me know that they’ve missed receiving my newsletter.  I love researching and writing them, but – as you can see from the data – it’s been a busy Spring.  Stay safe out there everyone!

SF Real Estate in the Time of Covid: Rumors of the Patient’s Demise Are Once Again Exaggerated

I’m barely into the New Year, and The New York Times headline shrieks “They Can’t Leave the Bay Area Fast Enough !!!” [OK, the exclamation points are mine.] Not only that, but “a tech era,” no less, is drawing to an end. Can the extinction of the dinosaurs, not to mention the collapse of San Francisco real estate values, be far behind?

It’s true that San Francisco residential rents have fallen by 27%.  It’s true that many techies and non-techies have found the lure of a suburban back yard in the time of Covid isolation a compelling reason to move away from the City, especially when all the restaurants, bars, gyms, and other urban entertainment options are closed.  Indeed, according to the annual United Van Lines survey, more people moved out of California in 2020 than into it, and that goes for the Bay Area as well.

But, my goodness, if there was ever a time for a collapse in real estate values, surely you’d think it would have been in 2020 – with a global pandemic raging the likes of which we hadn’t seen since 1918; office buildings, businesses, restaurants, shuttered; runs (if you’ll pardon the expression) on toilet paper; and the most rancorous, fractious general election in perhaps a century raging in the background.

It didn’t happen.  While our oft-quoted Patrick Carlisle put together his usual stellar summary of the year in real estate, available here if you scroll down to the January newsletter, I wanted to see what some key metrics for 2020 looked like when compared directly to 2019.  So I crunched the numbers myself.  Take a look. (All charts based on data from SF Association of Realtors and other sources deemed reliable, blah blah blah.)

Sales Volume

The first two charts show the precipitous decline in the number of house and condo sales as a result of the Shelter-in-Place Order (SIP Order) that went into effect in mid-March, and whose effects were seen in the drop in reported sales about 30 days later in April.

In both cases, the number of sales bounced right back as soon as residential real estate activity was allowed to restart in early May, with the effects again being seen in the data about a month later in June.  And whereas sales typically slow during the summer as people leave for vacation, in 2020 they did not.  Rather, they continued to climb.  Why? Pent up demand from the spring and the fact that Covid-19 canceled the 2020 summer vacation season.

Comparing 12 months through January 2021 to the previous year, sales volume was down less than 3% overall, with single family home sale up about 1.5% and condo sales – which now account for over half of all sales — down about 6%.  Not a bad performance for a tumultuous year.

High Rise Condos – a Different Case

With increased demand for outdoor space – see the “flight” to the suburbs – it’s no surprise that condominiums faired more poorly than single family homes.  And nowhere did condominiums fare worse than in SF’s high-rise neighborhoods like SOMA, South Beach and Mission Bay.  These areas are broadly covered within “MLS District 9.”  The chart below shows that although sales bounced back after the SIP Order eased, they did not continue to rise through the summer months like single-family homes and condos as whole.  Rather, they kind of bounced along at 2019 seasonal levels, thus never regaining the ground they’d lost during the shutdown.

Interestingly, District 9 does seem to have recovered strongly at the end of the year.  It’s a bit soon to say, but I’m wondering whether this represents newfound optimism around vaccination efforts and the possibility that all the attractions of urban life may soon return.

Prices

But what about prices?  Single-family home prices slumped during the SIP Order, recovered smartly after it was relaxed, and then generally stayed above 2019 values while following the usual autumn and winter seasonal pattern (first chart below).  The annual median price ended up 3% over 2019 (second chart below).

For condominiums, the story was less positive. Though prices initially recovered along with volume after the SIP Order was relaxed in May, they trended downwards for most of the remainder of the year – well below 2019 levels and dipping below 2018 levels in October. We may have seen the beginning of a recovery in December, but it’s too soon to tell. The annual median price ended down 3% compared to 2019 – much more if comparing Q4 2020 to Q4 2019 (second chart below).

District 9 condos fared worse.  While prices recovered with the lifting of the SIP Order, they trended below both 2019 and 2018 levels for the remainder of the year (chart below).  Perhaps the year-end spike in volume discussed earlier will portend a recovery in prices for this hard-hit area. 

The Demise of San Francisco and the Bay Area?

Frequent readers of my newsletter know that I am not one to view the SF real estate market as always rosy.  On the contrary, I predicted back in April 2020 that the longer the pandemic went on, the worse the market would get. (I also admitted that I was wrong in October.) But anyone who bets against the long-term strength of the San Francisco real estate market does so at his or her peril, in my opinion.  It’s been a long and terrible 9 months, for all sorts of reasons.  And yet, the San Francisco market has, overall, held up well.  While commercial office space may not recover for a long time, and while we may be moving to a new model of mixed remote and onsite workplaces, I deeply believe that our need for “society,” for social gathering, will always animate San Francisco and cities like it.

Moving forward, myself and my colleagues are seeing huge buyer demand, especially for this early in the year.  Offer deadlines, multiple bids, and bids well over asking are once again the norm for many properties – especially single-family homes.  Barring a major shock to the economy or the stock market, or – heaven forfend – the resurgence of the virus, I foresee a very strong 2021 for San Francisco real estate.  Stay tuned, and Happy New Year everyone!

As always, your questions, comments, and referrals are much appreciated!

Misha

Which way is Up? Mixed Messages from San Francisco Housing Data

I was wrong – kind of. In my April newsletter I opined: “The longer the crisis continues, the more likely it is that it will do long-lasting damage to the economy and the real estate market itself.” But, looking at the numbers in the chart below, you’d never know that we are now eight months into a global pandemic.

Median house sales prices are well over where they were a year ago.  Condo prices are not down by much.  Days on market (DOM) for single family homes is a brisk 28 and they are still selling at a slight premium to asking price (102.5%).  The number of combined luxury houses and condos selling above $2.5 million is up substantially (177), as is the number of super luxury houses and condos (22).

Indeed, it’s not just San Francisco that is experiencing a buoyant housing market.   A recent article in The Economist suggests that many “rich” countries are seeing house prices surge even as a second wave of covid-19 infections hit.  Between historically low interest rates, loose governmental monetary policies, and a trend towards roomier homes, “higher house prices could turn out to be an enduring legacy of covid-19.”

Apples and Oranges

Look at the SF data more carefully, however, and a more complicated picture emerges.  Firstly, the year over year quarterly comparison may be misleading.  There’s a strong seasonal component to the housing market, with the strongest sales typically occurring in Spring and Autumn.  This year the Spring season got halted in its tracks by shelter-in-place.  Instead, it shifted into the summer months, which are typically slower until Labor Day.  Thus, the apparent strength of third quarter results may be in part because we’re actually comparing a delayed Spring quarter (think pent-up demand and a flood of new inventory) to a more normal slower Summer quarter.  The next two chart show dramatically how the pandemic completely disrupted the usual Spring and Summer cycles.

Secondly, there’s increasing evidence of a divergence between the market for single family homes and that for condominiums.  (There’s also evidence of divergences occurring between sub-segments of the condo segment itself – for example between condos in high-rise buildings and those in smaller 2-4 unit buildings.  I provided some details on this in my previous newsletter.)  It’s for this reason that we broke out some of the stats for single family homes and condos separately in the first table, above.  For example, while 43% of house listings sold in Q3, only 26% of condo listings sold in the same period.  Bear in mind that condos now represent over 50% of the sales market.

Nowhere is the divergence of the condo and single family home market clearer than in the following chart, which tracks “Months Supply of Inventory” (MSI), a basic measure that matches demand to supply.

While both houses and condos have seen significant increases in MSI, condo MSI has gone through the roof.  Since MSI can increase due to fewer properties going into contract (demand), more properties available on the market (supply), or a combination of both, let’s take a closer look at what’s driving the increase in MSI.

The first chart below shows that while the number of condo sales, relative to house sales, has decreased, it hasn’t decreased all that dramatically.  The second chart, however, shows a huge increase in condo supply – I can’t go back further than 10 years, but “unprecedented” seems like a fair description.  Clearly, then, what’s happening is that the increase in MSI for condos is being fueled by an enormous increase in supply.

Prognostications – Not!

I started this newsletter out by saying I was wrong – kind of.  If you judge whether the market is strong or weak based on prices, the data doesn’t support a conclusion that the market is weak.  However, there are some troubling signs.  For condos, the huge spike in inventory without a corresponding increase in sales does not bode well.    Condos are also seeing significant price reductions once they’re on the market.  Not coincidentally, condos are more likely to be purchased by younger, less affluent buyers – the same ones who may now be facing layoffs or, alternatively, have been told by their employers that they can work remotely and are now seeking more space for their buck outside of SF, or even in a different state.

As for single family homes, MSI has increased too but not nearly as dramatically as for condos.  While it’s true that buyers may be looking for alternatives outside SF, either to purchase as a primary home or as a second home “refuge,” it seems that there are still enough of them to consume SF’s chronically limited supply.

It’s going to be interesting to see how this all plays out as we head into the typically slow winter months after Thanksgiving.  Add an election, the possibility of a second Covid wave or a miracle vaccine, and I think I’ll sit out any additional prognostications for now.

But that doesn’t have to stop you, gentle reader! Many of you regularly email me directly with astute comments about subjects I cover in my newsletters. I appreciate them so much!  However, please consider expressing your views right on my website so that everyone can benefit from them and so that we can get a conversation going.  It’s easy! Just click here!

As always, your questions, comments (especially on my website!), and referrals are much appreciated!

Misha


Once Again, Rumors of San Francisco’s Demise May Be Premature.

In the spring of 2018 a slew of articles breathlessly foretold of mass migrations out of the Bay Area due to a host of reasons –including lack of affordable housing, long commutes, and the anti-immigrant policies of the Trump administration.  I blogged about how those articles ignored a lot of data to the contrary here.  Home prices continued to increase.

Now here comes Zillow with a comparative analysis of major metro areas which suggests that people are leaving the Bay Area in droves.  The implication, once again, is that prices are going to plunge.

The chart below, which measures percentage change in year over year inventory, is the one that’s gotten lots of attention; the SF Chronicle proclaiming, for example, that the “exodus is real, and historic.”

Reasons cited for the exodus this time around include all of the previous ones, plus those attributable to the pandemic, like the following:

  • Layoffs are affecting demand
  • Techies can telecommute from anywhere
  • With indoor socializing at a standstill, everyone is looking for outdoor space
  • With bars and restaurants closed, the city has lost its allure

Let me be clear: all of those factors, new and old, are likely having an effect.  It’s true that recent data indicates that the more suburban and rural counties in the Bay Area are significantly outperforming San Francisco right now (see below). At the same time, it’s probably too soon (again) to conclude that the rise in inventory means that people are fleeing the city in massive numbers.  And it’s certainly too soon to conclude that prices are about to fall off a cliff.  Our data suggests a more complicated picture.

Diverging Segments.  What seems to be going on is that the market for single family homes and the market for condominiums are diverging dramatically.  In particular, the market for condos in large high-rise buildings in San Francisco’s densest areas – downtown and South of Market – has really been hit hard.

This makes sense.  If people are leaving SF for the perceived safety and real outdoor space of the less dense suburbs, you’d expect people to be shunning the densest parts of San Francisco where “social distancing” is hardest, where you have to deal with common areas serving hundreds of other condominium owners, and where – if you’re lucky – your outdoor space will be a three by five foot balcony.  Dense, high-rise neighborhoods like Mission Bay and South Beach also happen to have been – until the pandemic – among the most popular with young techie buyers who appreciated easy access to their jobs in the South Bay via freeway or CalTrain and who relished the nightlife that those neighborhoods offered.  With these buyers now out of a job or able to telecommute, demand is drying up at the same time that supply is skyrocketing.

But Zillow’s inventory chart belies a market that is both more nuanced and more robust than it suggests.  For example, there’s been a massive rebound in the number of home sales since the Shelter-in-Place order relaxed a bit, starting in around April (note that sales trail deals going into contract by about 30 days.)

Sales and Prices Have Rebounded. While the typically strong Spring selling season was a bust due to the Covid lockdown, summer sales numbers are around the same as they were in the previous two years.  Likewise, prices are generally holding up.  The median price of a single family home hit a record in July, while condo prices are at around the same level they were last year and down just 4.5% from their all-time highs of October 2019 (see charts below).  Will this strength in prices continue to hold up?  I’m not ready to prognosticate yet; you can read my thoughts in my previous market report, but overall I’d say that the market is exceeding my expectations.

The Luxury Market.  You’d think that the people most able to flee the city would be those who are the most affluent. After all, they’ve got the assets to buy new homes and their jobs are likely more secure than the typical code hamster. If they were doing so, you’d also expect more luxury homes to be for sale, less of them to be going into contract, and prices to be falling.  None of that is happening.  In fact, the number of luxury home and luxury condo sales is higher than it was last year at the same time. And prices, so far, are holding up too.  To be fair, this may be because we experienced a delayed spring “bounce” this year, whereas last year’s numbers reflect the more typical summers slowdown in luxury sales.  Furthermore, word on “the street,” which reflects the real-time market, suggests that condos priced at over $1 million are struggling.  It’s the one bedroom entry level units that have the best chance of selling.  Buyers are being very picky about everything else.

Condominiums – Cold

So, while it’s way too early to say “the sky is falling” in SF’s real estate market – though the amount of ash falling these days is terrifying in itself – there is real weakness in the condo market overall.  It’s showing up as a huge increase in new inventory at the same time that demand is falling.  That is a classic recipe for falling prices, even if they haven’t shown up in closed deals — yet.

It’s important to bear in mind that since the high-rise condo building booms that started in the early 2000s, condo sales have represented an increasing part of the San Francisco market.  In recent years, the split between condominium and home listings has consistently ranged between 60/40 and 55/45 percent.  That balance changed dramatically as a result of the Covid epidemic, starting in May 2020, as the next chart shows.

If there is a chart that represents the divergence between the single family home market and the condo market, it’s the next one.  “Months Supply of Inventory” captures how long the inventory available on the market would take to be absorbed at the current rate of properties going into contract. The more “months supply,” the weaker the market from a seller’s point of view.

This chart shows that the single family home segment, while somewhat weak by recent standards, seems to be heading in a positive direction after sustaining an understandably calamitous period during the Covid shutdown.  The same cannot be said for the condo segment, which has clearly weakened into a buyers’ market.  The diverging segments can be seen across a broad range of metrics, as the final chart shows.

This doesn’t paint a pretty picture for condo owners trying to sell right now.  Tons of inventory, much of it new; tons of price reductions; and tons of deals falling out of escrow.  That’s not to say that some condos aren’t selling, but with condos making up 74% of active listings in July, buyers can afford to be picky.

To make it personal, that’s been my experience.  Of the three condominium listings I’ve had since the Covid-Crisis – we were scheduled to go on the market literally days before the shelter-in-place order came down – the cheapest sold quickly, the other two had major price reductions, one is now in contract, and the third will likely be taken off the market and rented until more propitious times.

If you’re thinking of buying, this really – no, I mean really – is a good time to be out looking, particularly if you’re considering a condo.  Even if you’re thinking about buying a single family home, I’d say take advantage of historically low interest rates and get in there. Good homes, especially at the cheaper end, may still attract multiple offers, but with open houses forbidden under San Francisco’s current Shelter In Place rules, there’s much less competition.  This is already being reflected in the new marketing term, “transparent pricing”: list prices once again reflect what the seller actually hopes to get, rather than just being a teaser number.

If you’re looking to sell your single family home, the market is holding up reasonably well —  for now.  I would not assume it will last, and it may get worse before it gets better.

As for condo sellers, it really depends on what you’ve got. If you’ve got a delightful Victorian with a deeded garden, you may be fine.  If you’re in a downtown complex with no outdoor space, I’ll tell you what I told my clients whose unit I was not able to sell: if you can afford to, wait.  This too shall pass.  And when it does, everyone will come roaring back to the City by The Bay.

As always, your questions, comments and referrals are much appreciated!


Charting Covid-19’s Effect on San Francisco Real Estate – An Update

In my last newsletter, I shared some short-term data on what San Francisco’s Shelter-In-Place order was doing to San Francisco residential transactions.  In short, it caused activity to crash to a halt.  It’s still too soon to determine what the pandemic’s mid- or long-term effects will be, but there has been a change.  Before going into details, let’s recall how we got here.

How We Got Here

On March 16, San Francisco, along with six other Bay Area Counties, announced a Shelter-in-Place Order, prohibiting all but “Essential Activities” and “Essential Services.” Governor Gavin Newsom announced a state-wide equivalent two days later.

On March 28, The Department of Homeland Security issued a statement including real estate services as “Essential.”  Since Newsom’s order incorporated the federal standards, real estate services became “essential” under the State order, though subject to more stringent local orders.   On March 31, San Francisco modified its own SIP order to include real estate as an “essential service.”  As far as agents showing homes to prospective buyers was concerned, the order provided that in-person showings were permitted only if a virtual viewing is not feasible.”    Right now, that standard is the one that remains in effect.  Is it being honored?  That’s another story.

When is a Virtual Showing “Not Feasible?”

The trouble is that no one can really point to an example of where a virtual tour wouldn’t be “feasible.” As one opinion writer mused in this article in the SF Examiner, “in order to find a listing without photos or a [virtual] tour you’d have to first find a time machine and set it to 1997.”  Photo galleries are the minimum marketing package for all listings these days.  Well-marketed properties will also have videos, and the best will include 3D virtual walk-arounds and even overhead drone footage.  So, when is a virtual tour not feasible?  Nobody really knows.

What I can tell you is that since the beginning of April my industry has been quietly moving ahead with in-person showings while turning a blind eye to the “feasibility” requirement.  I’m not casting judgment on my colleagues:  the showings are done under strict precautionary guidelines being updated almost weekly by The California Department of Health and others.  (Note, some other counties do permit in-person showings so those guidelines are relevant to them.)

For myself, I’m complying with the San Francisco SIP order and not doing any in-person showing.  However, I am facilitating limited showings for buyers and their agents who choose to visit my listings in person. 

Activity Returns

We normally don’t look at weekly charts because they’re too short term to be useful.  However, in these unprecedented and volatile times, they can provide some insight into what’s going on right now (Click the charts to expand.)

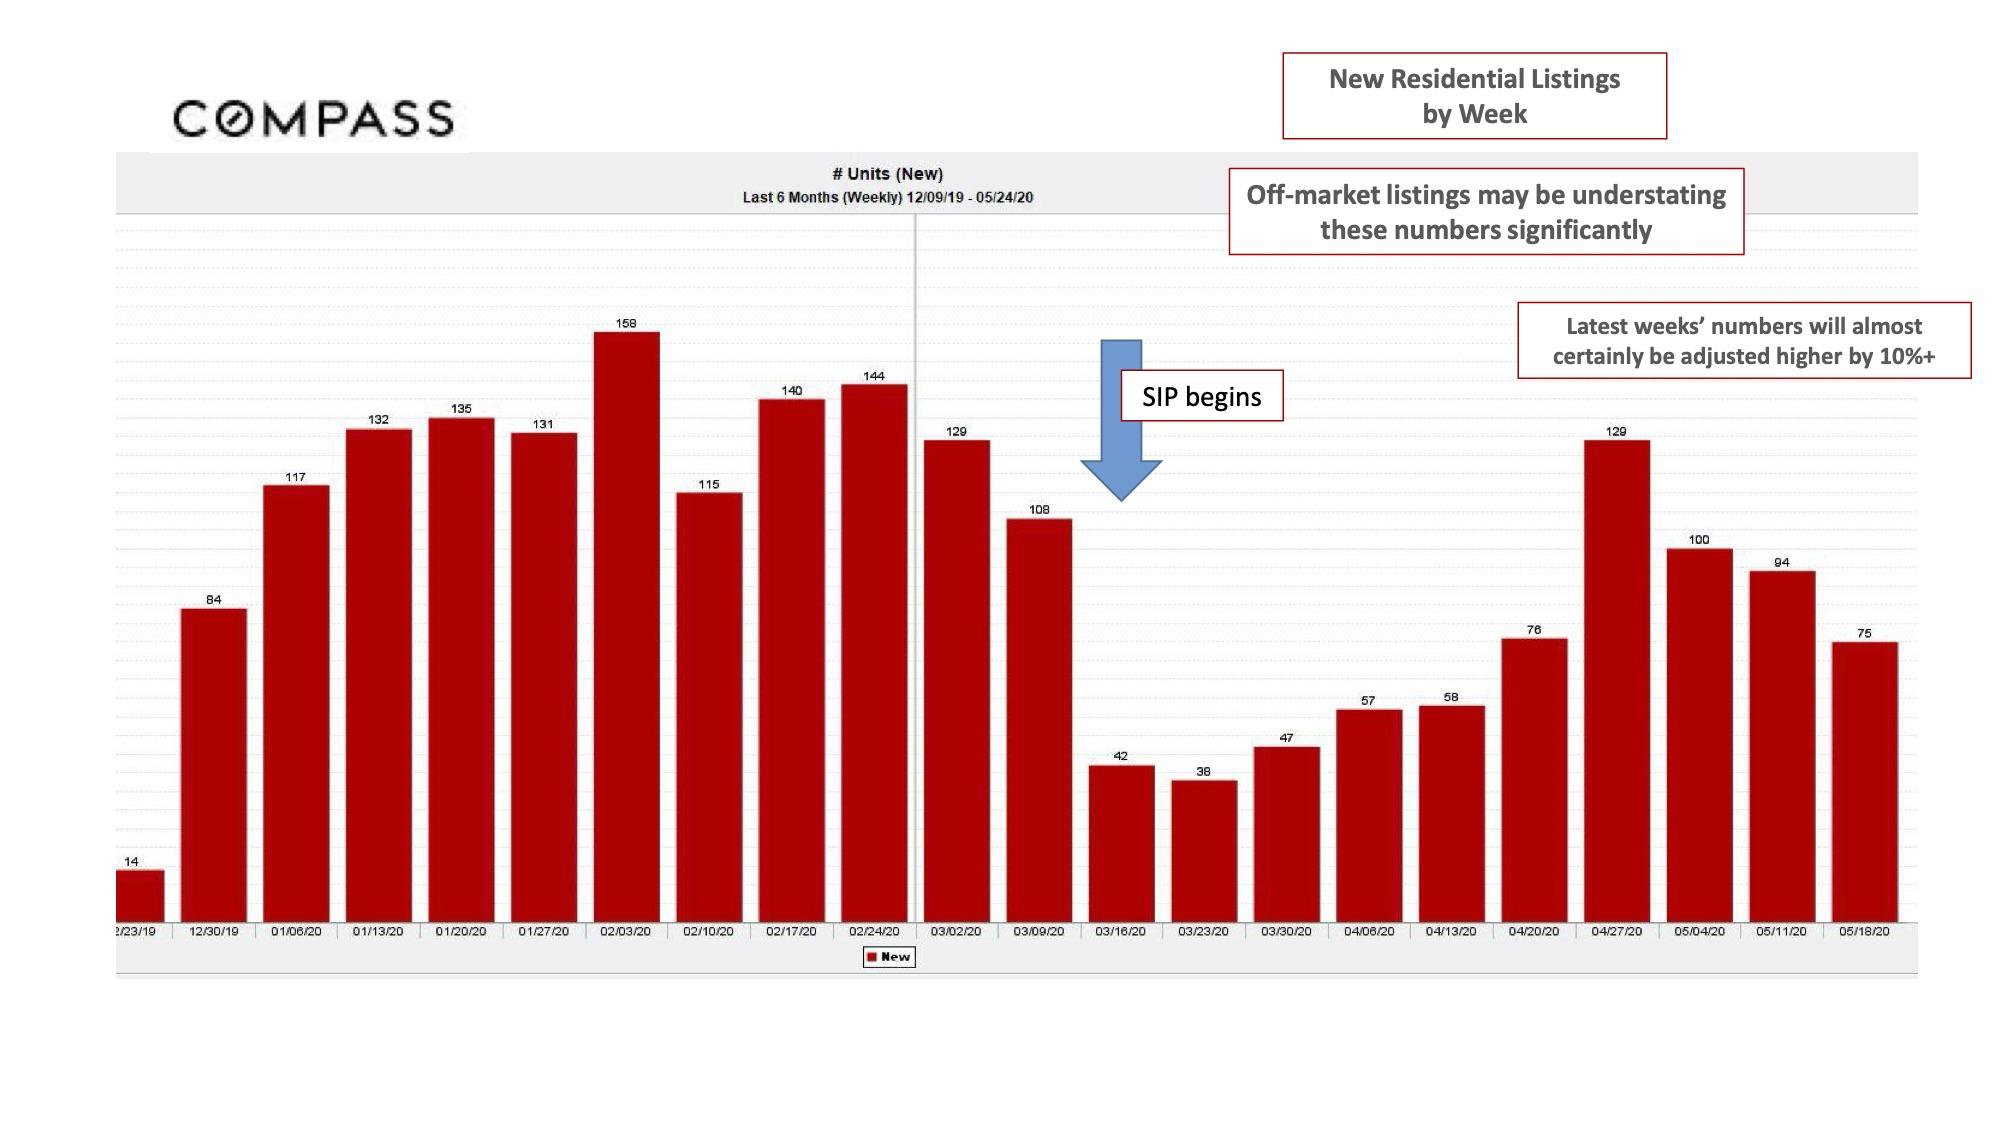
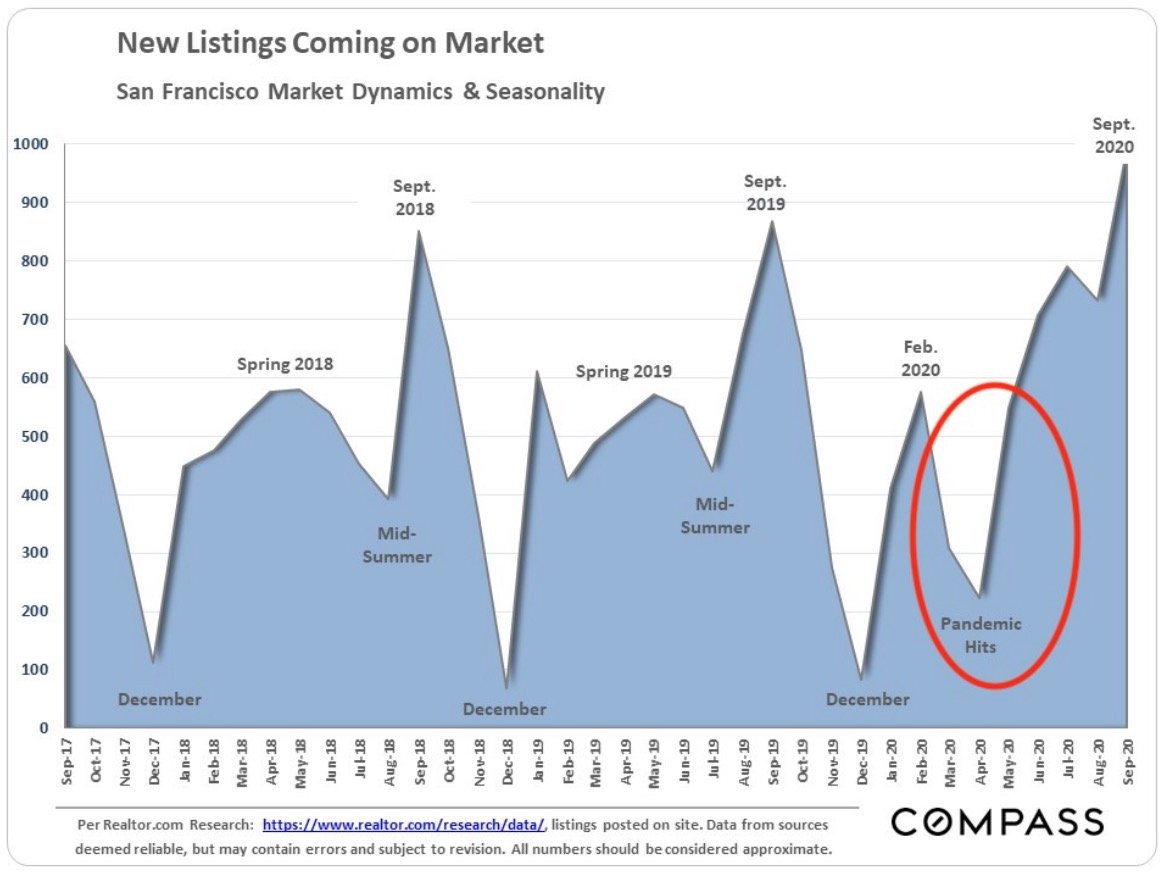
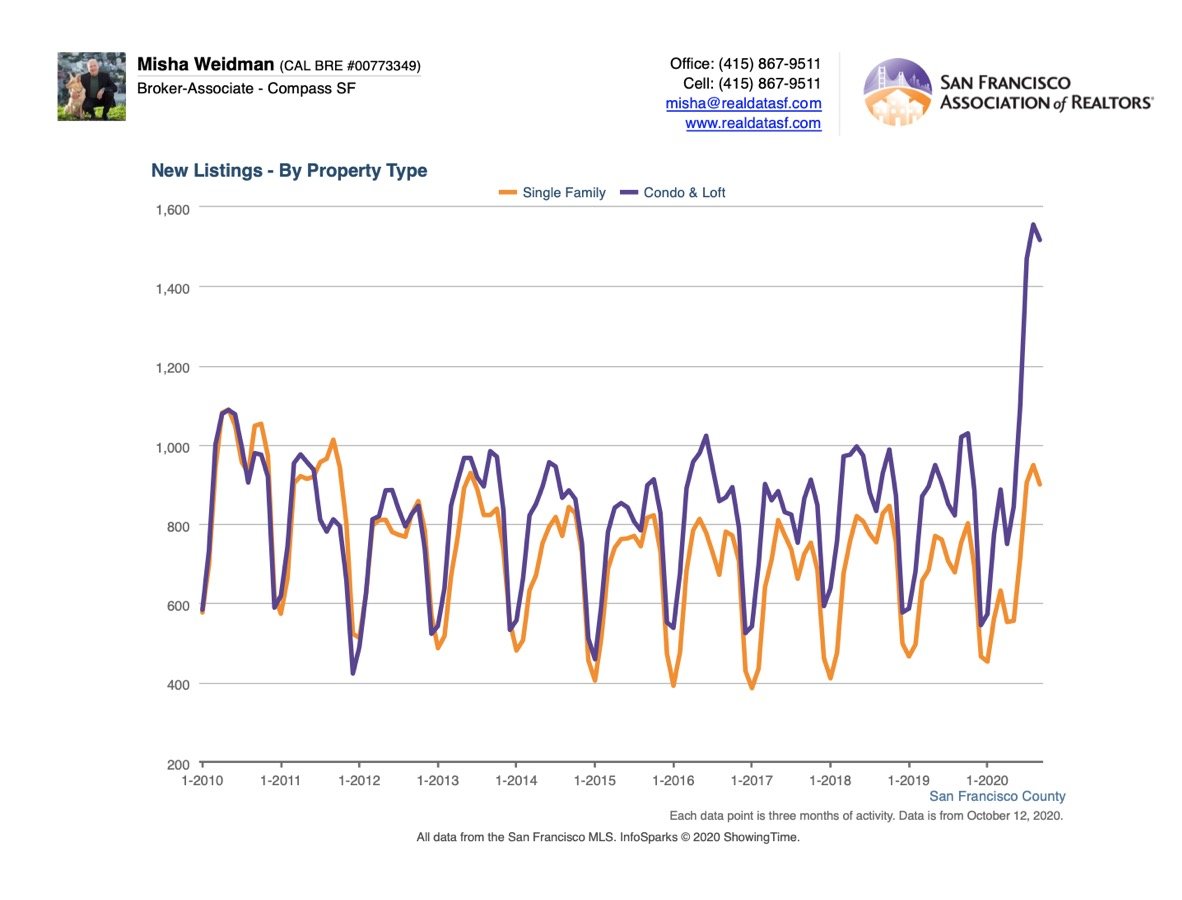
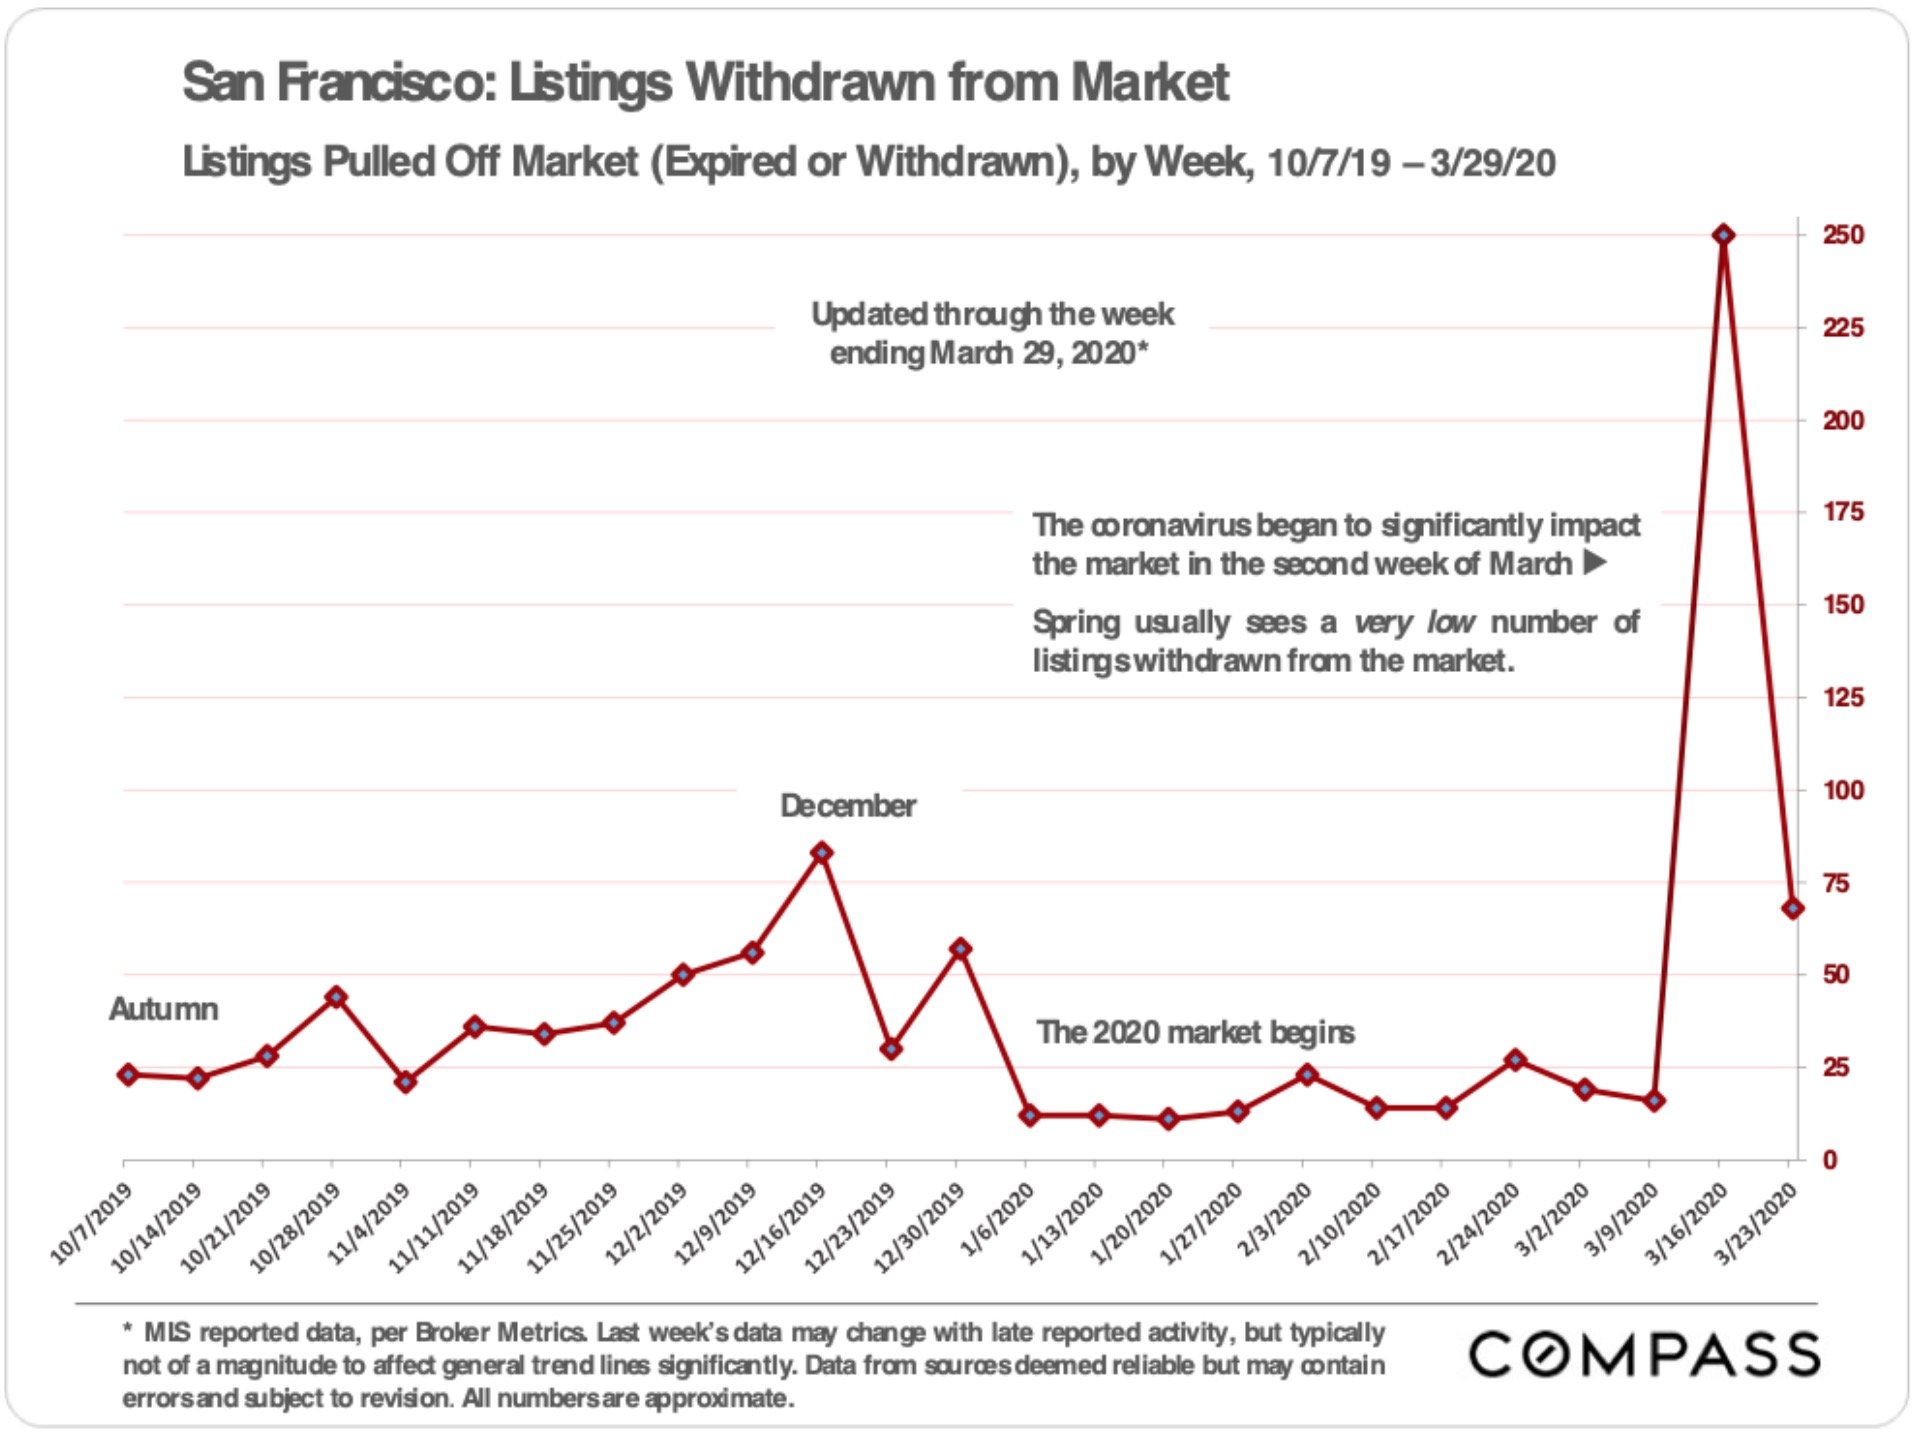
For the week of March 27, coincident with the Dept of Homeland Security’s announcement of real estate as an “essential service,” there was a huge jump in new listings.  Since then, the number of listings has fallen though they’re still twice the number we saw right when the SIP order went into effect.  I can’t explain the decline in new listings in weeks since April 27.  My guess is that it’s partly a result of the numbers being preliminary and partly that it’s taking a while for agents and owners to decide what they want to do.

More Deals Occurring

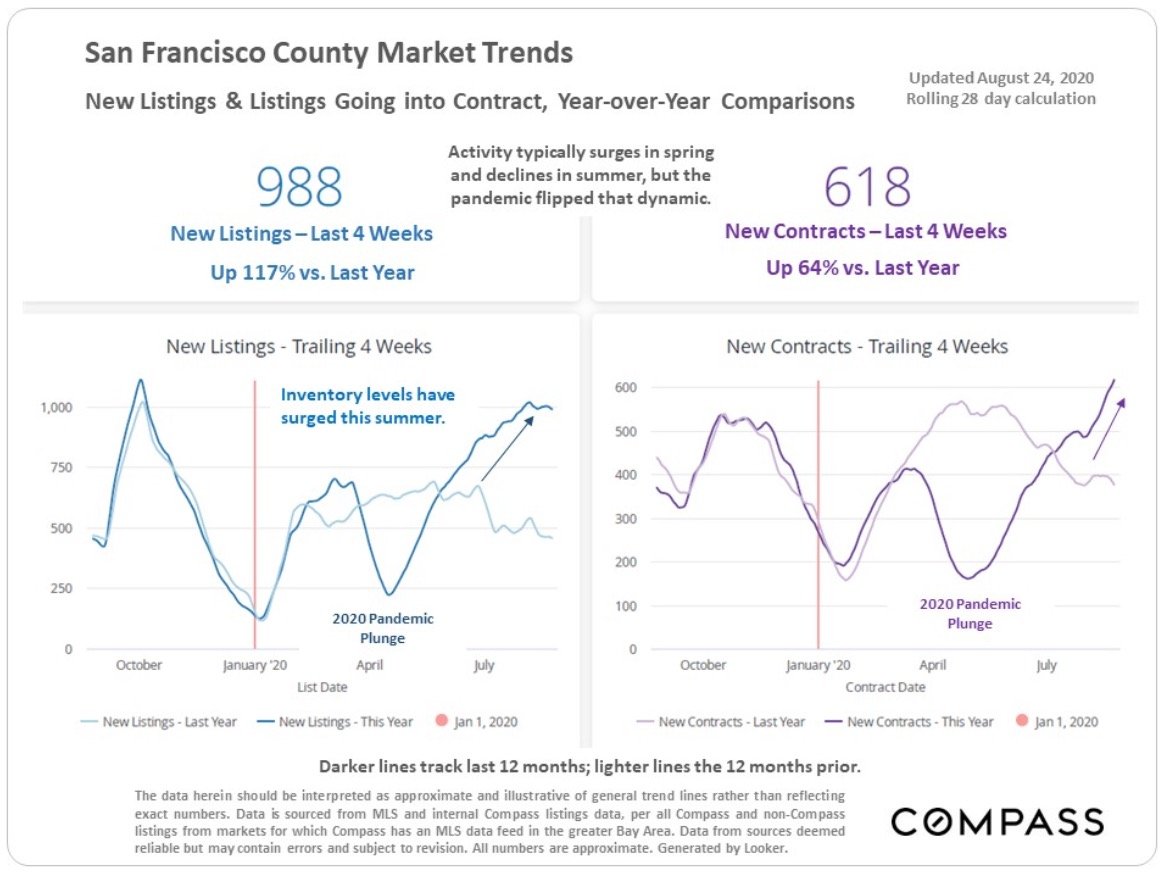
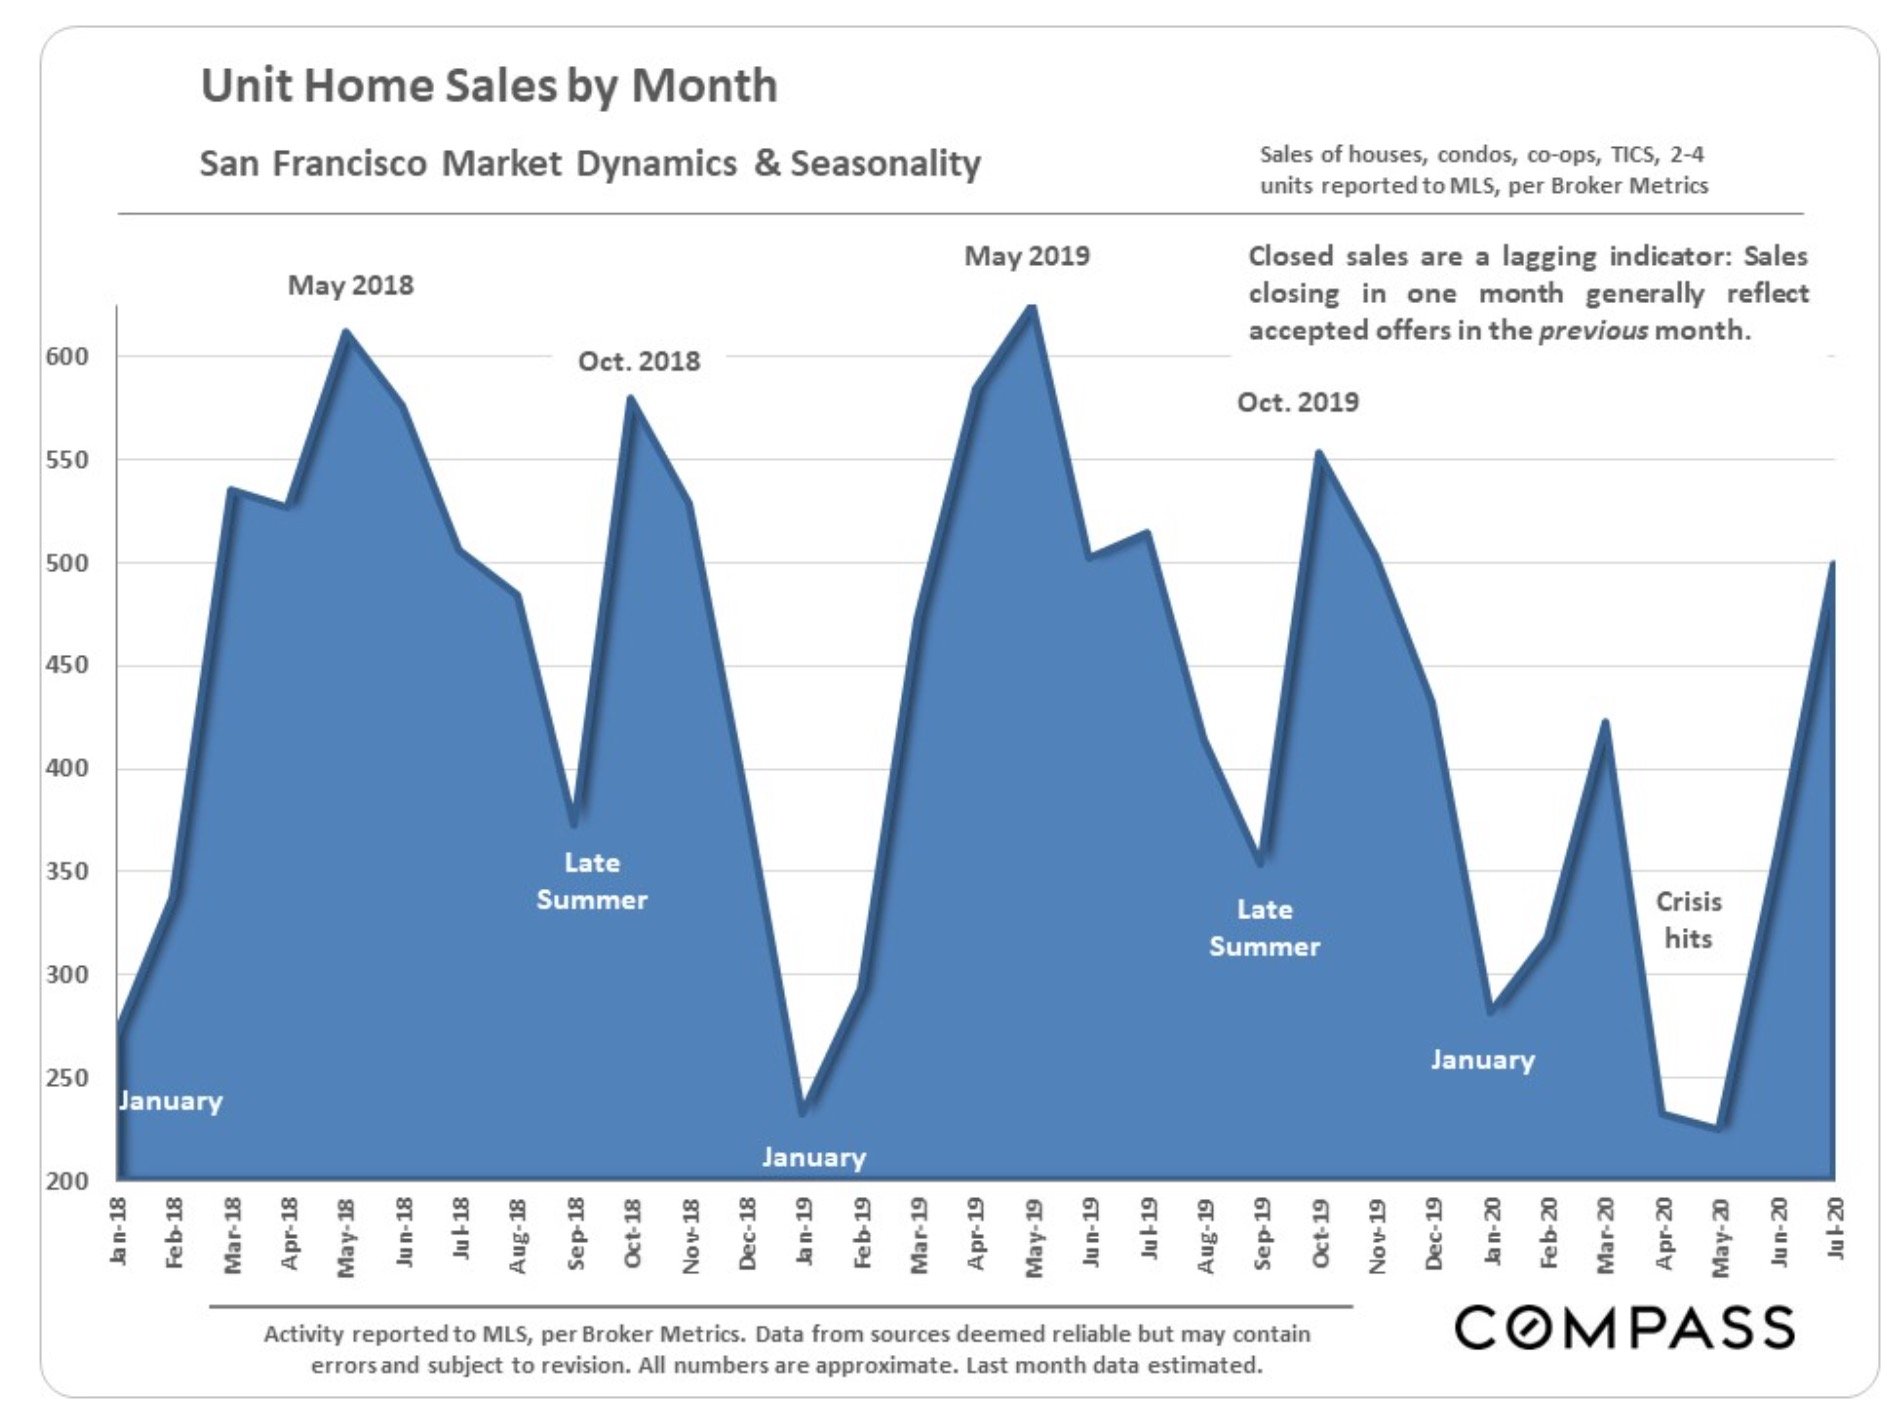
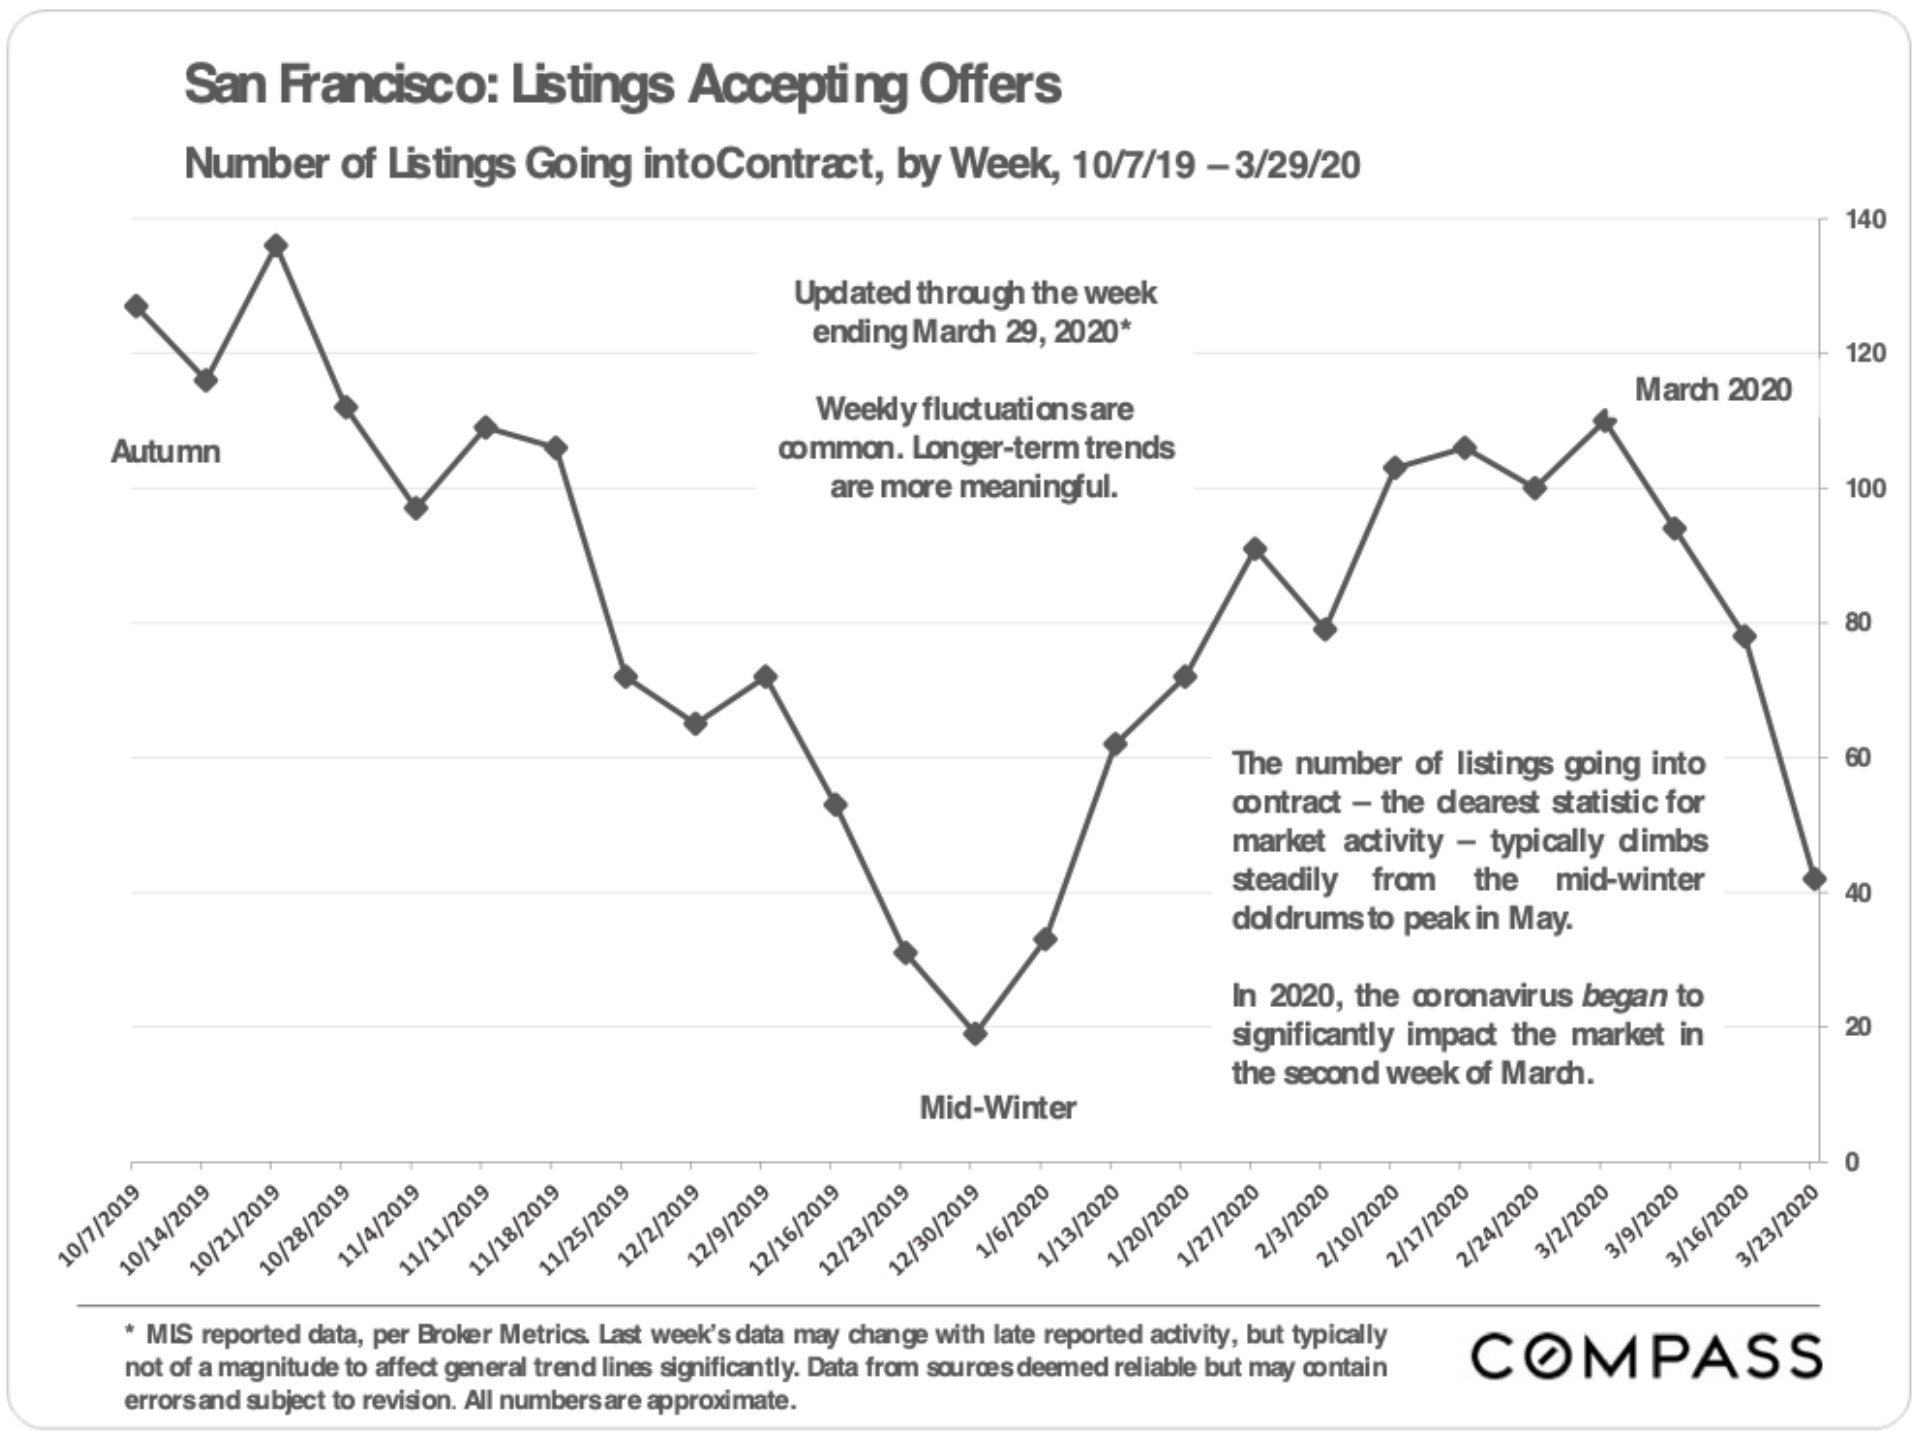
Likewise, listings going into contract have come back from a near stand-still, as the next chart shows.

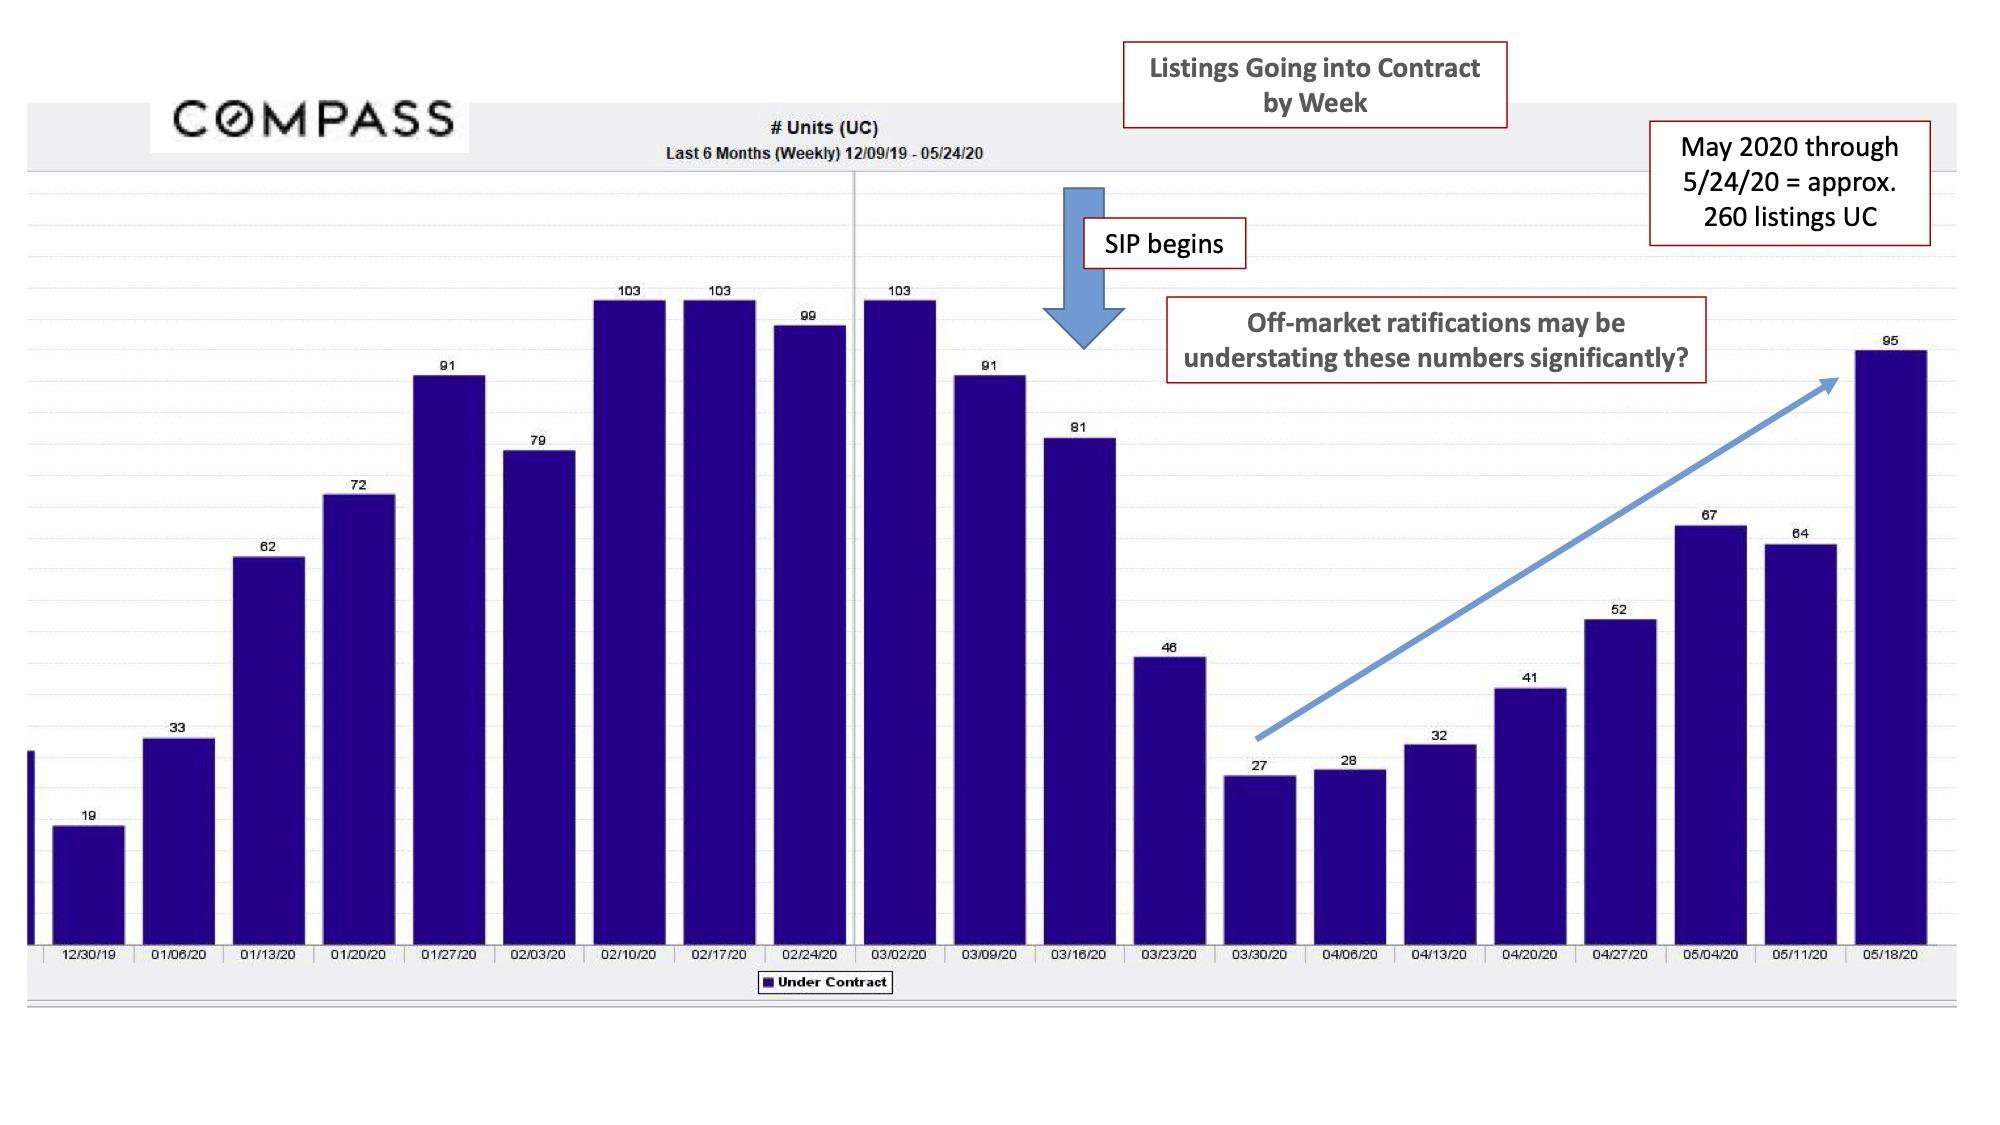
Transaction volume occurring for the first few weeks after March 16 almost certainly reflects deals where buyers were able to view homes in person before the SIP order took effect.  But starting around April 20, and ahead of the orders defining real estate as an “essential service,” transaction volume started heading up.  As of May 18, it was just above pre-SIP weekly volume. But remember, we were just coming out of winter when the order went into effect, so volume was low anyway.

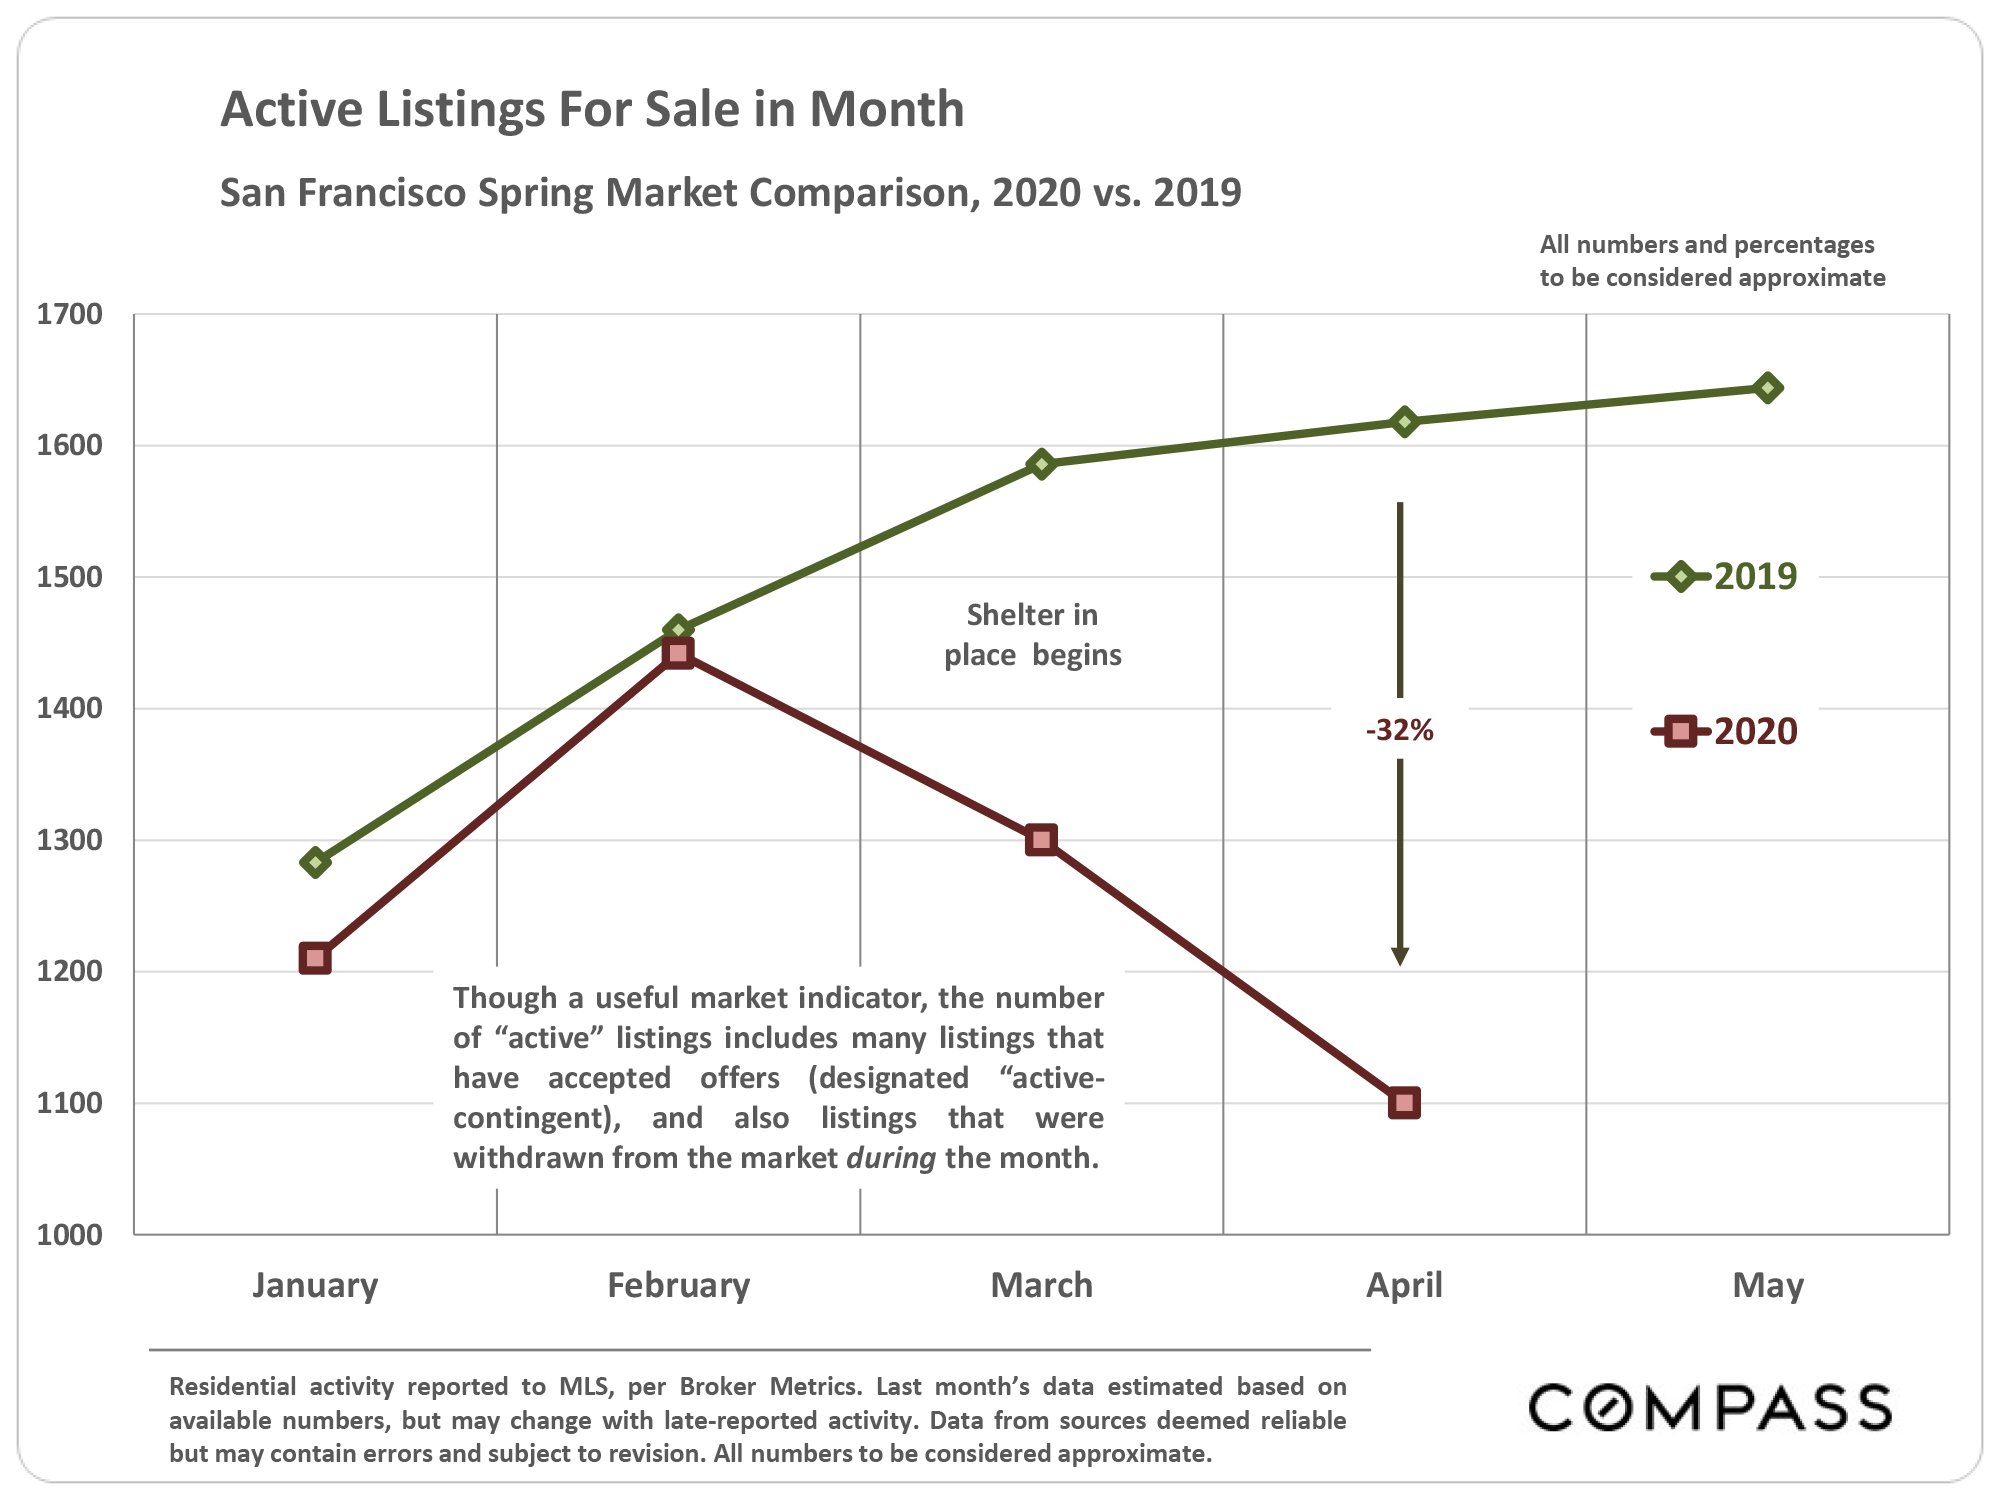
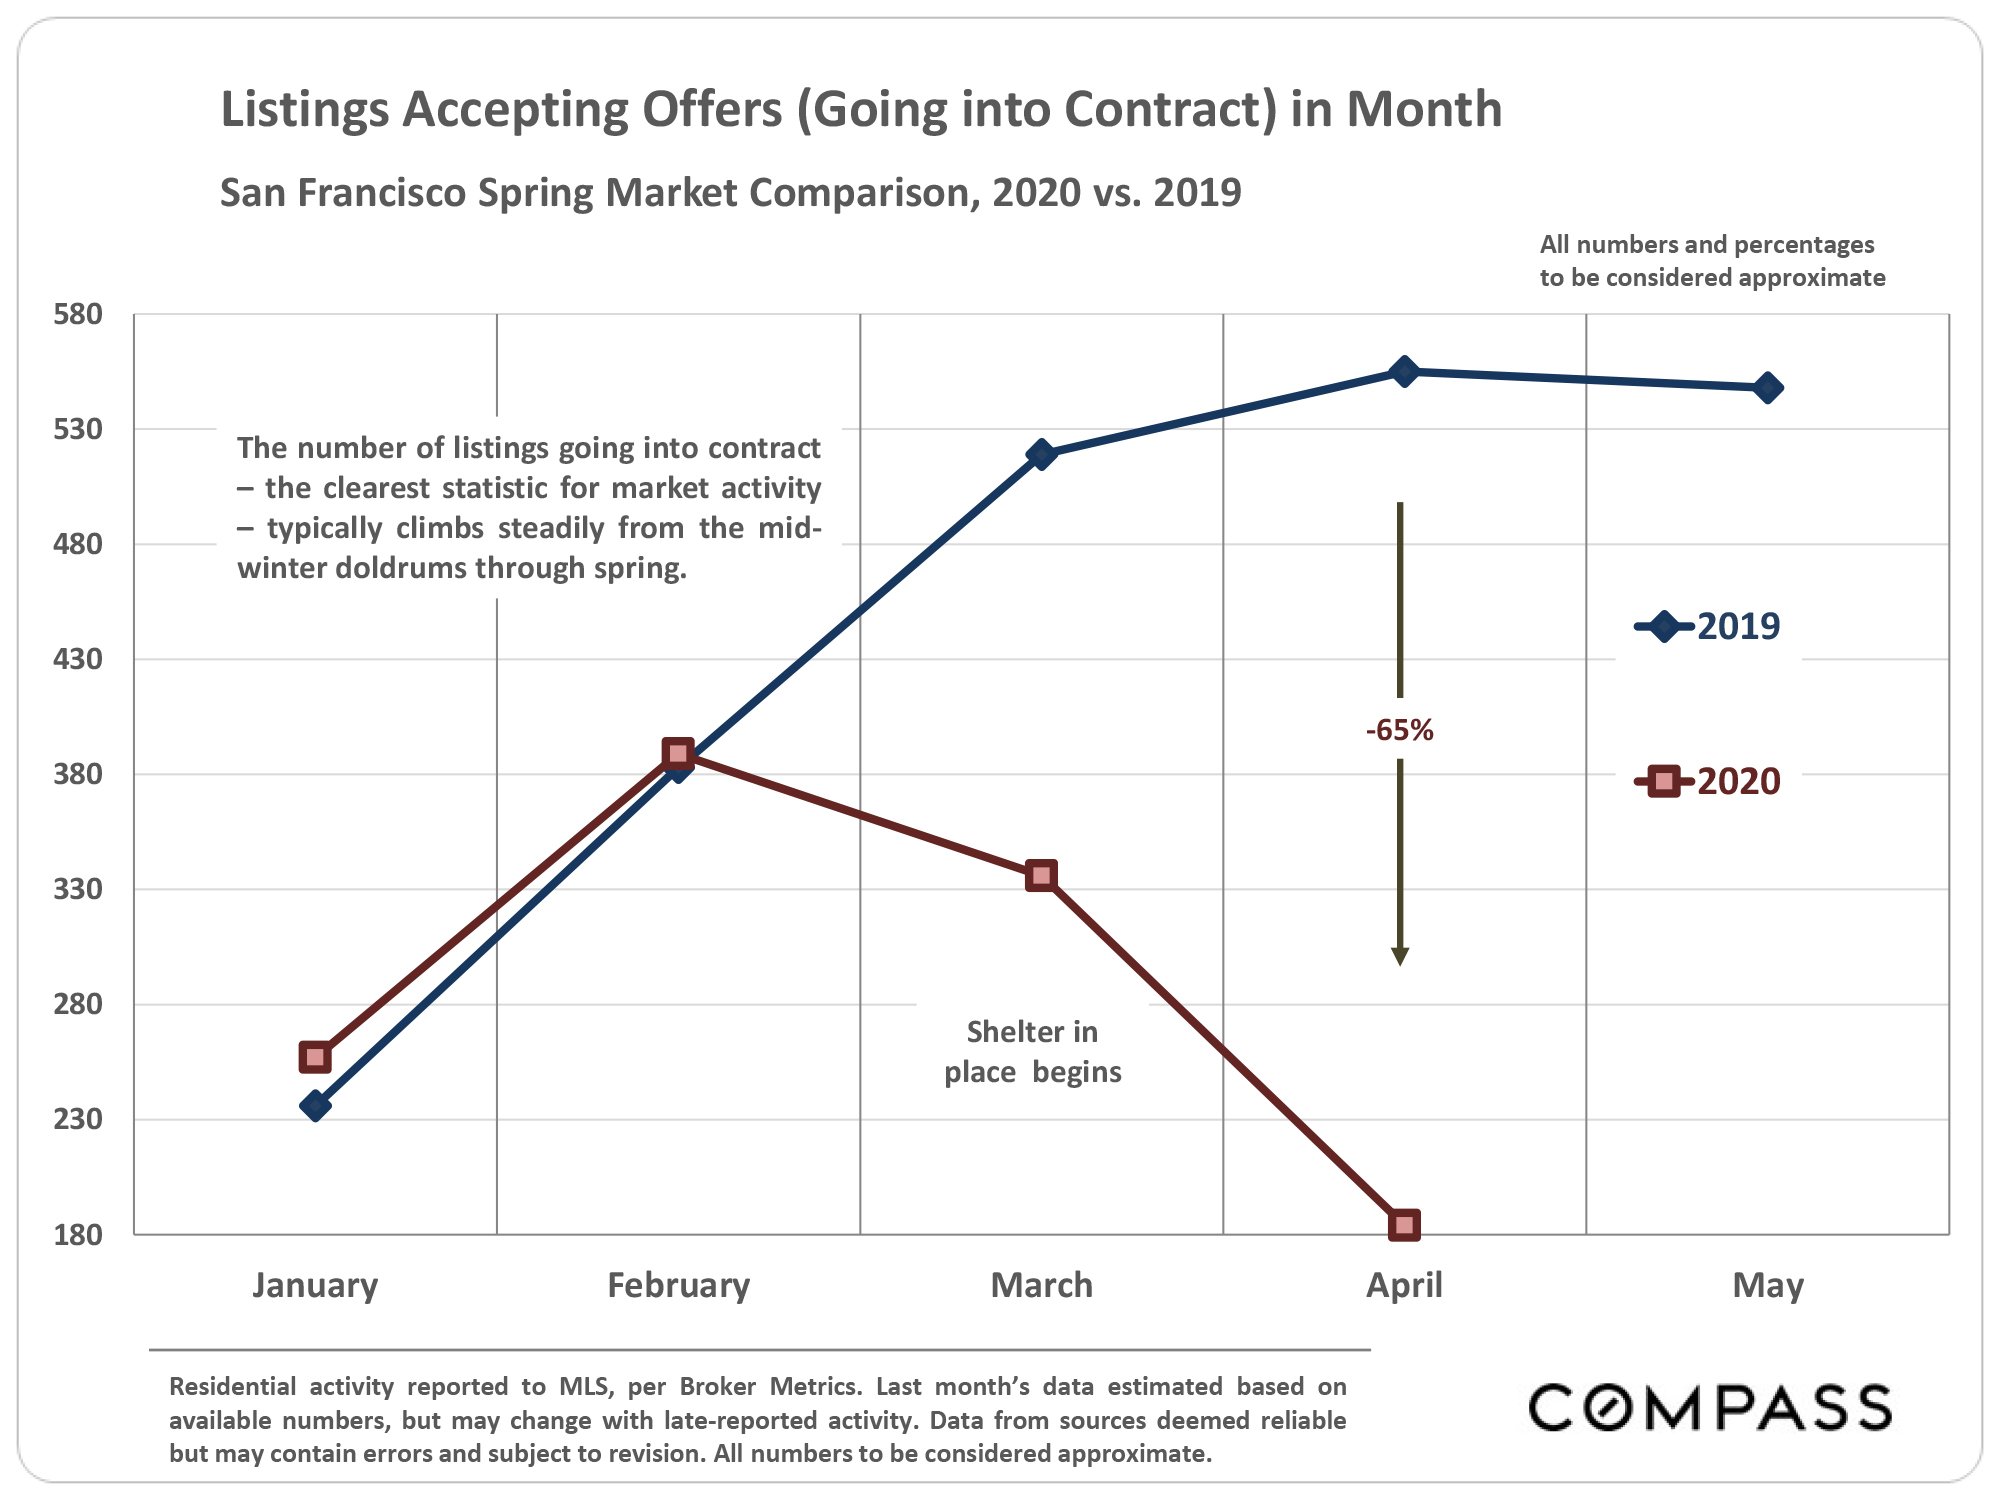
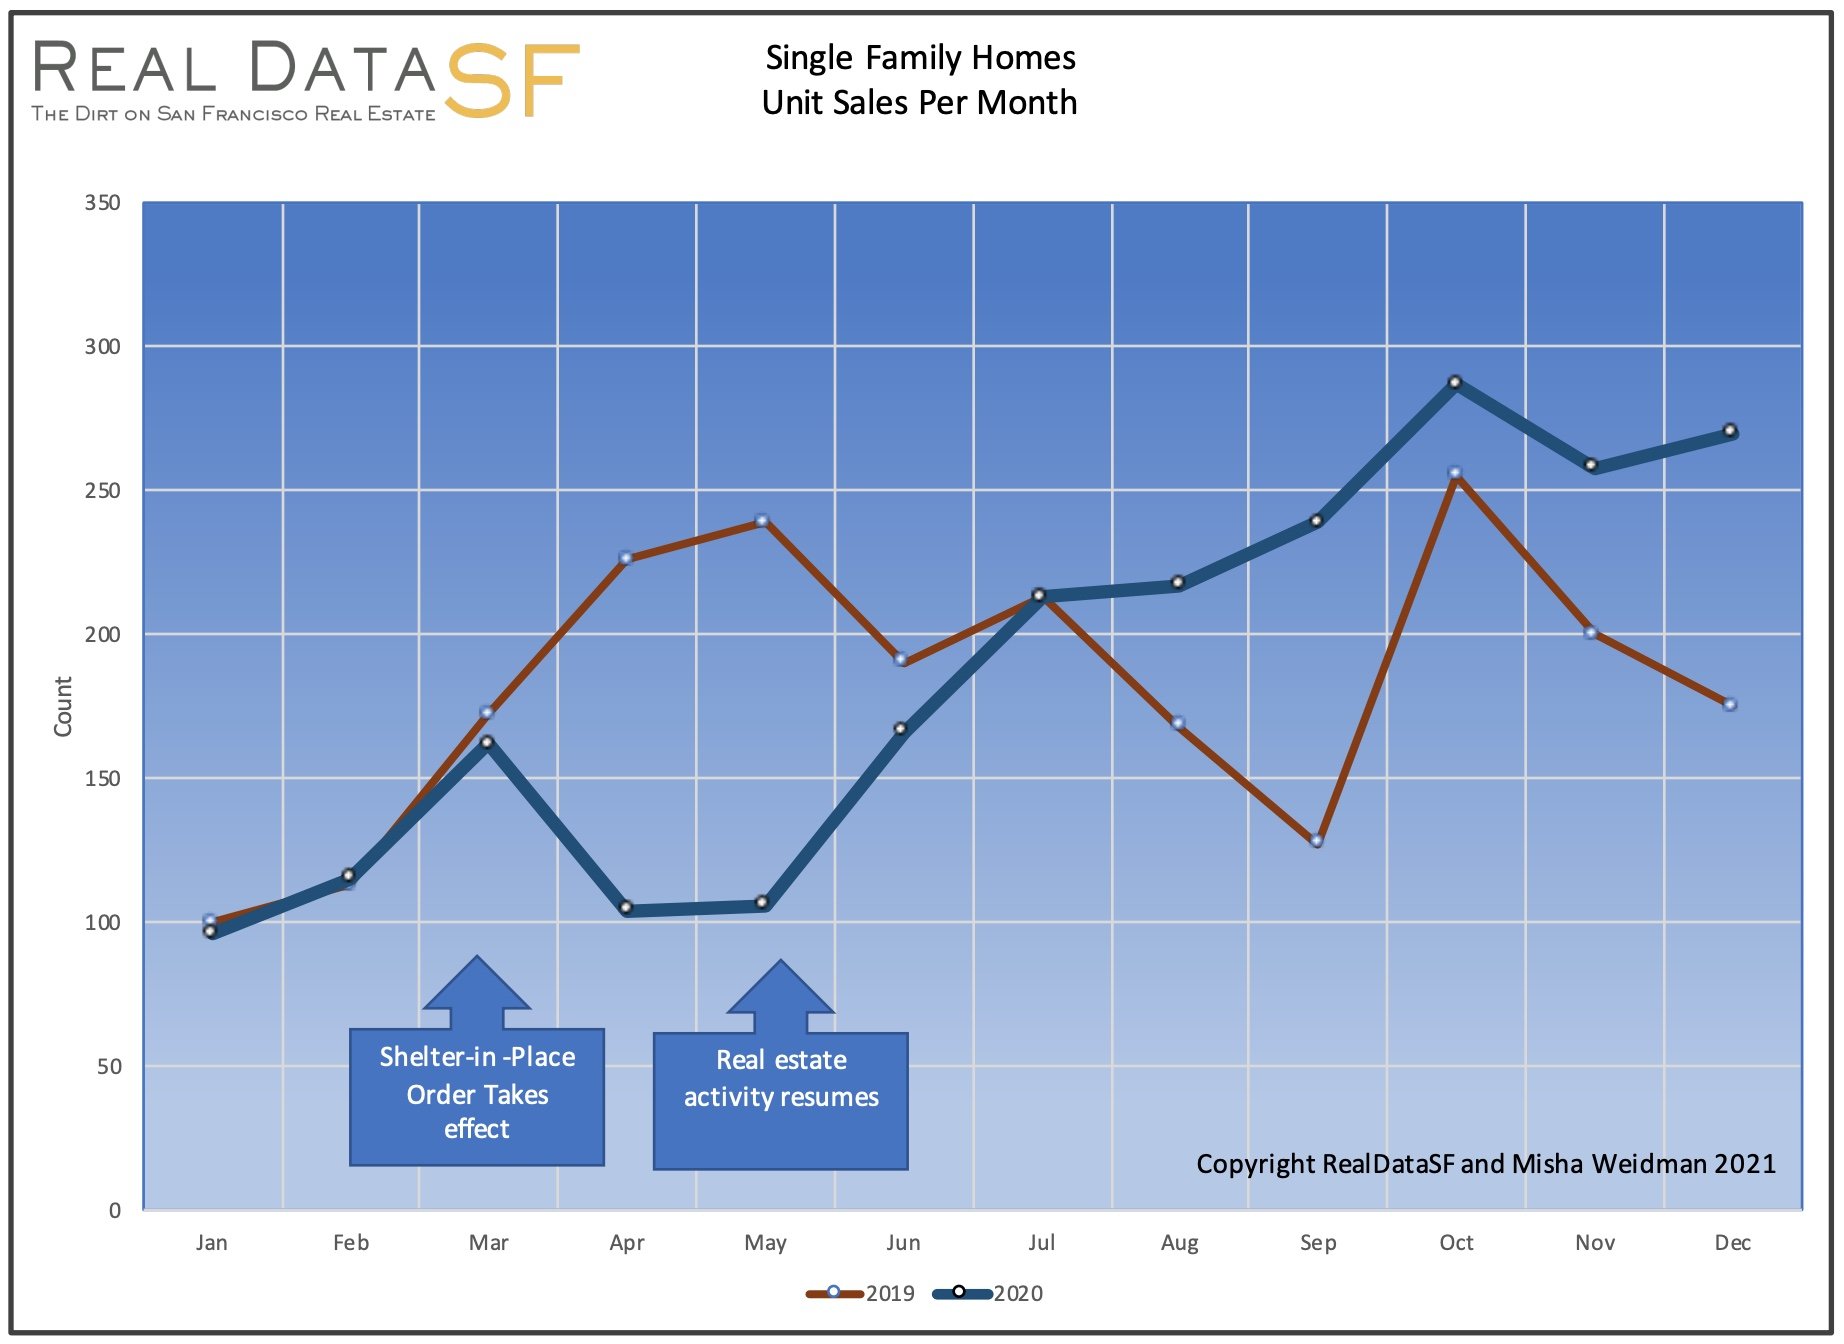
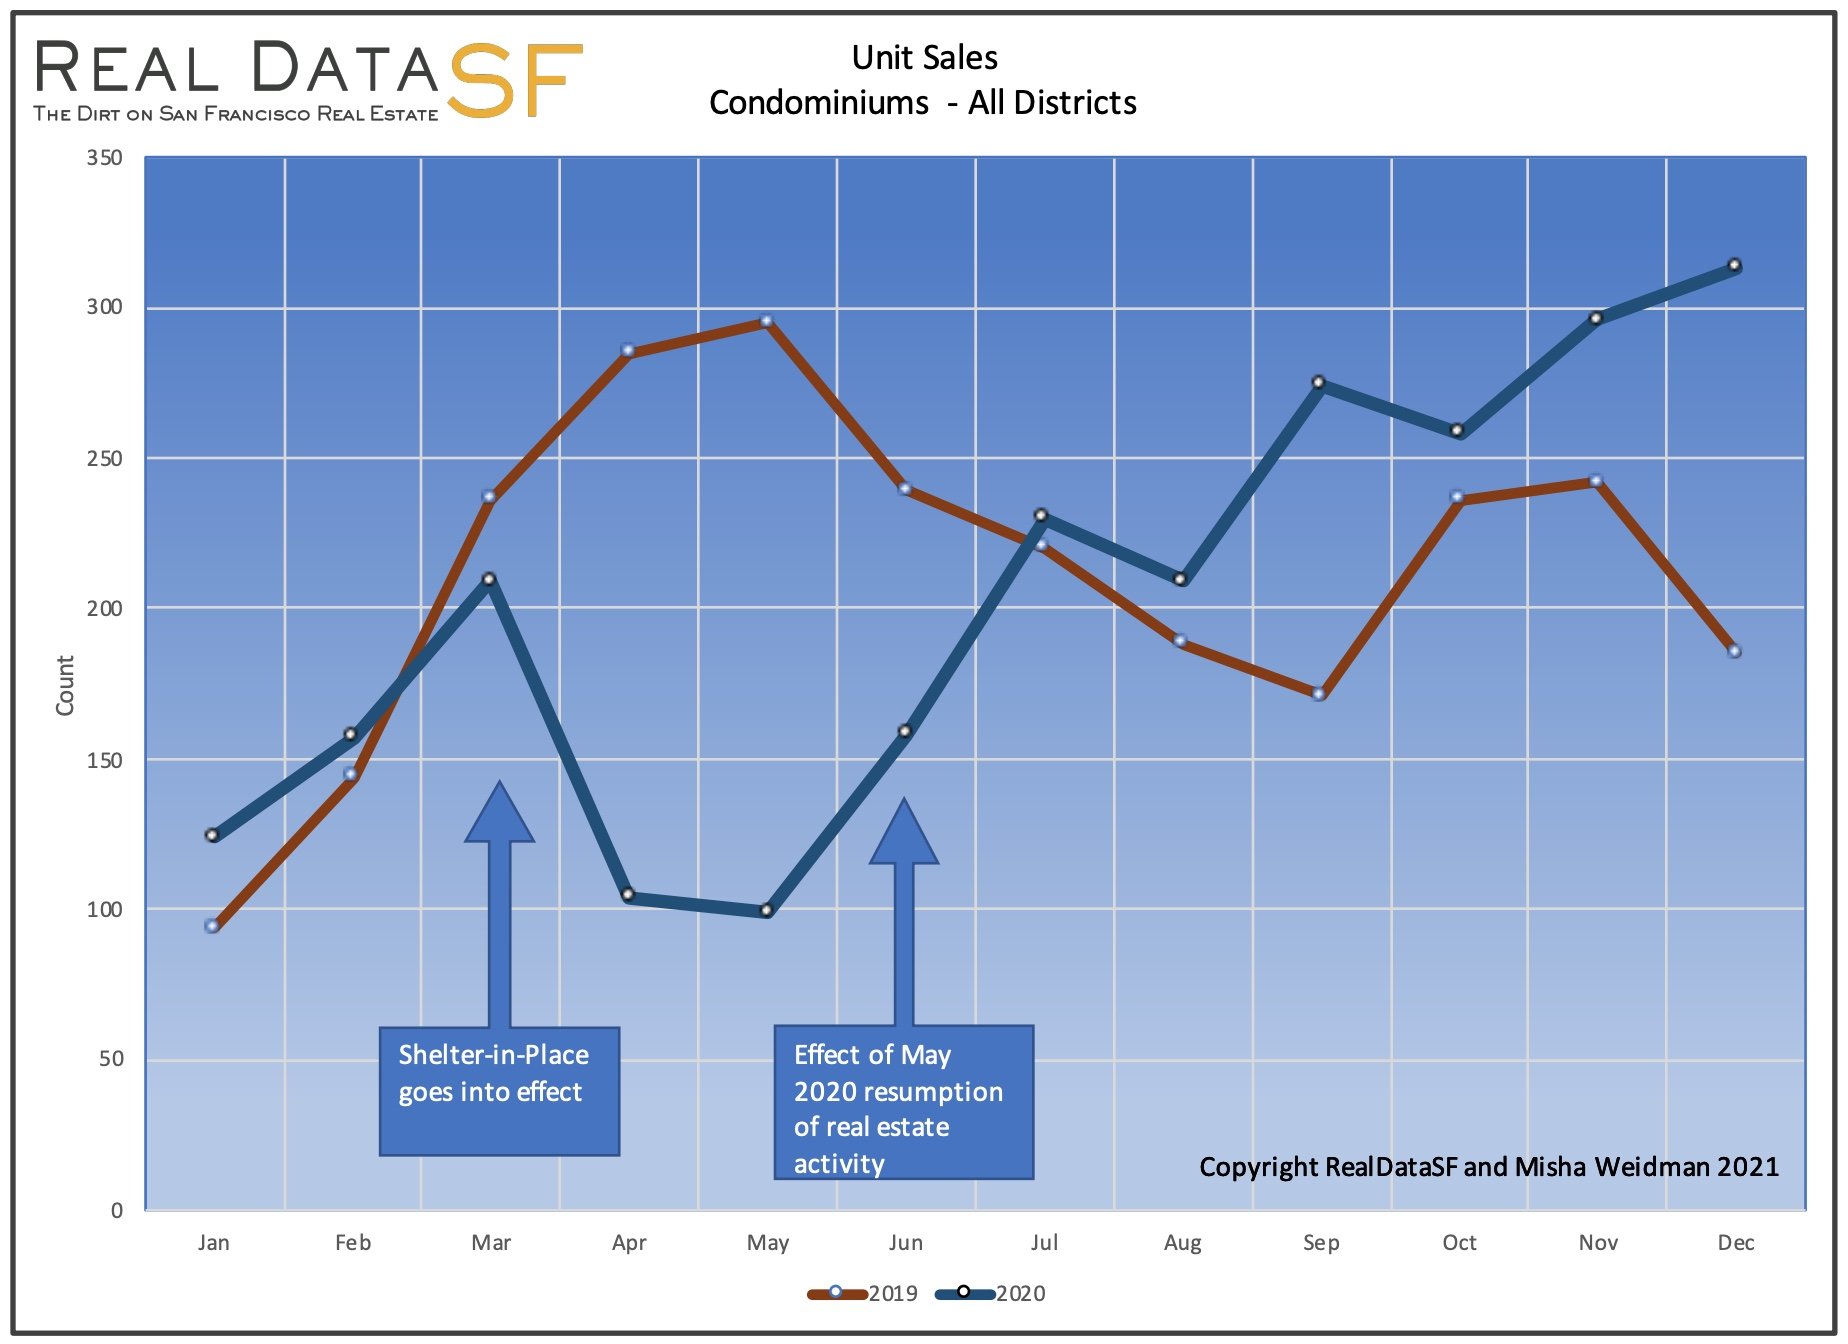
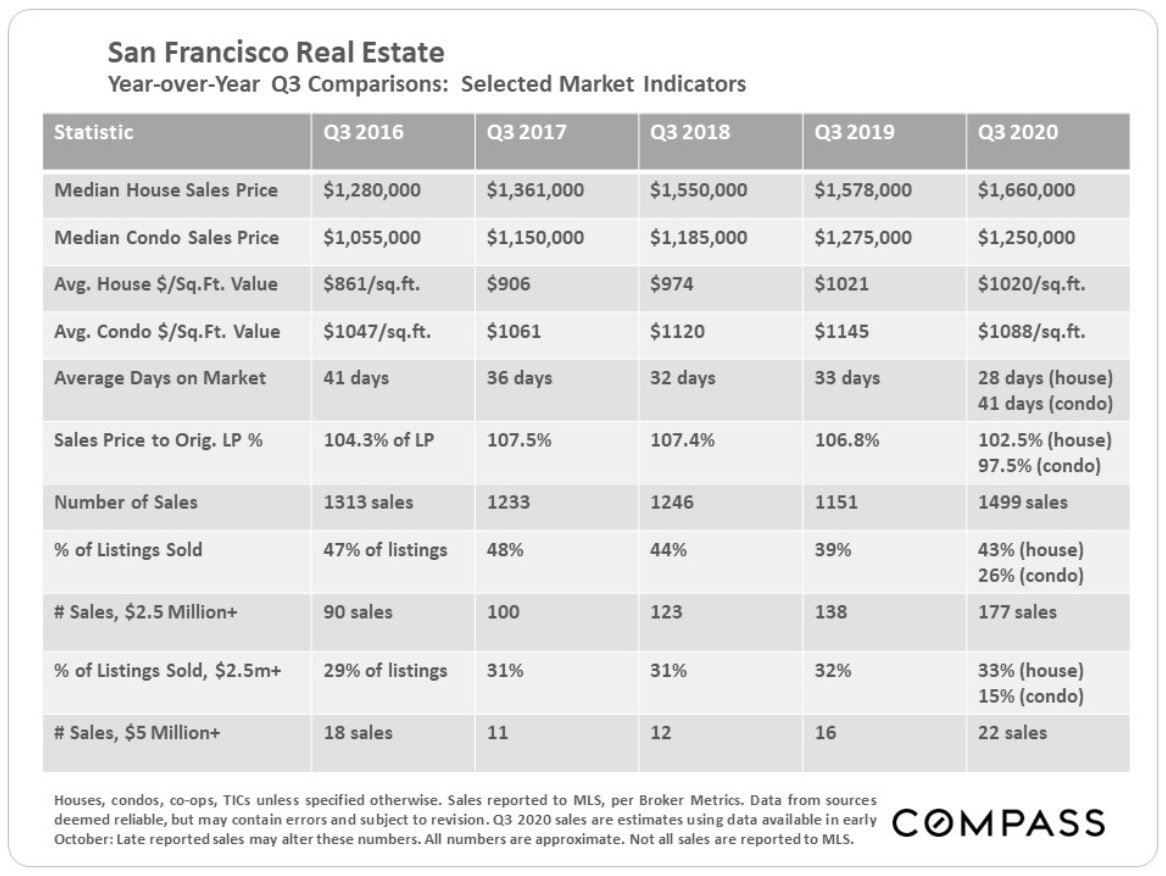
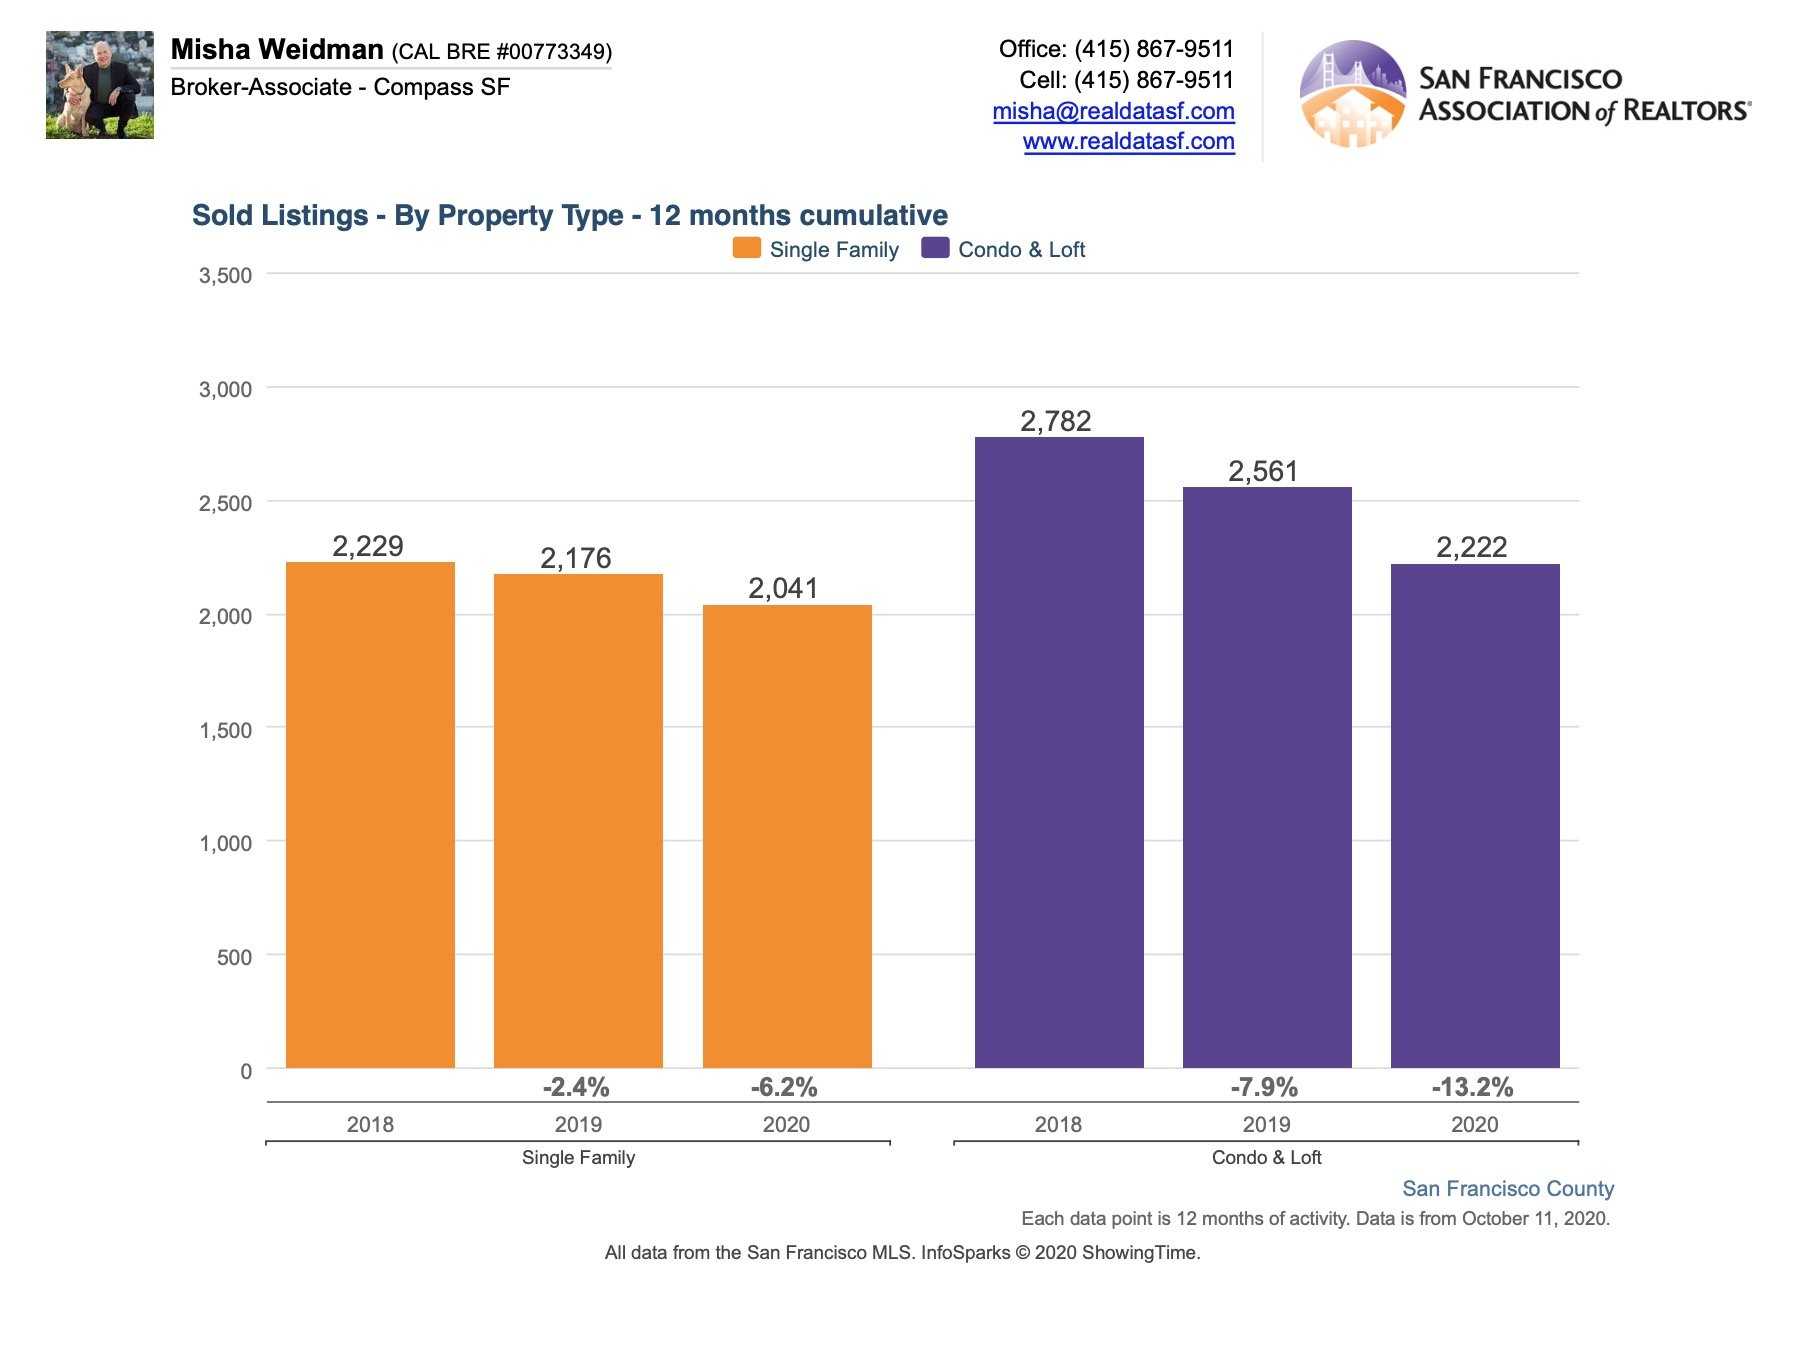
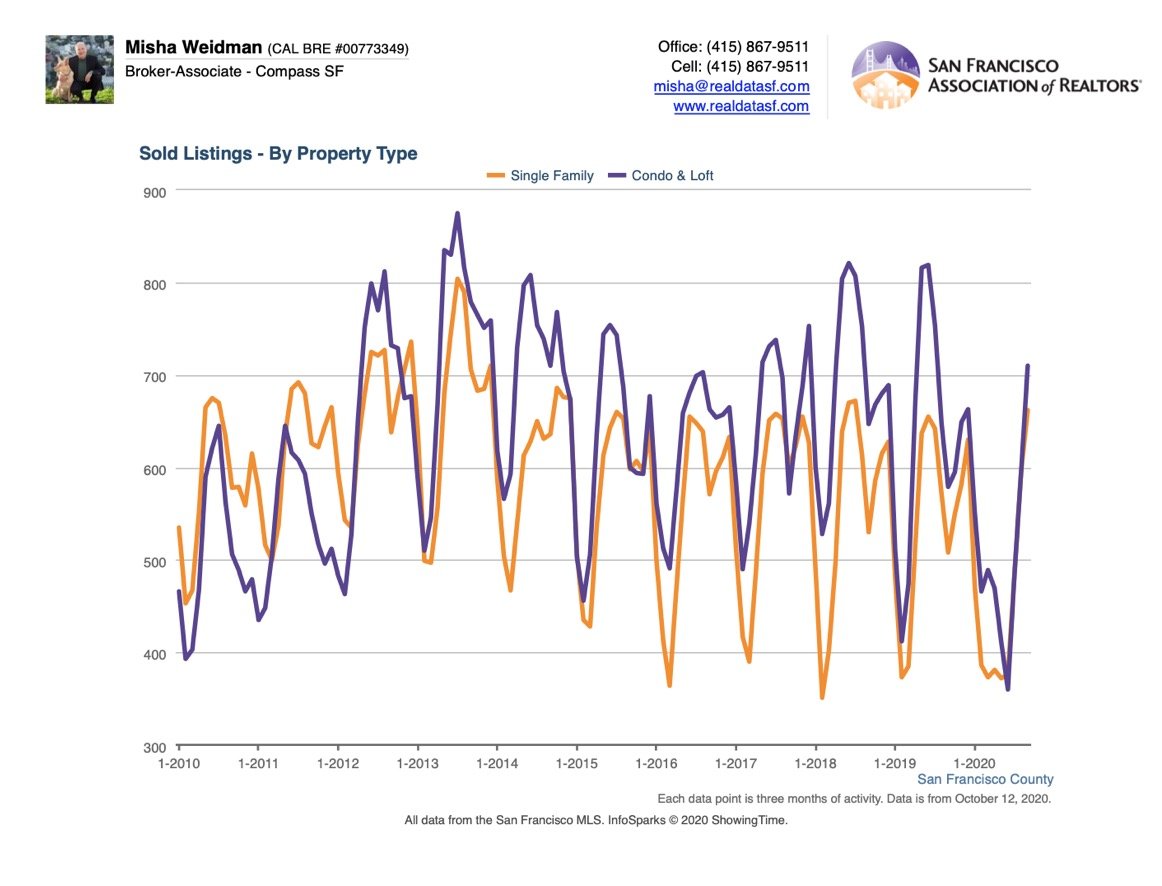
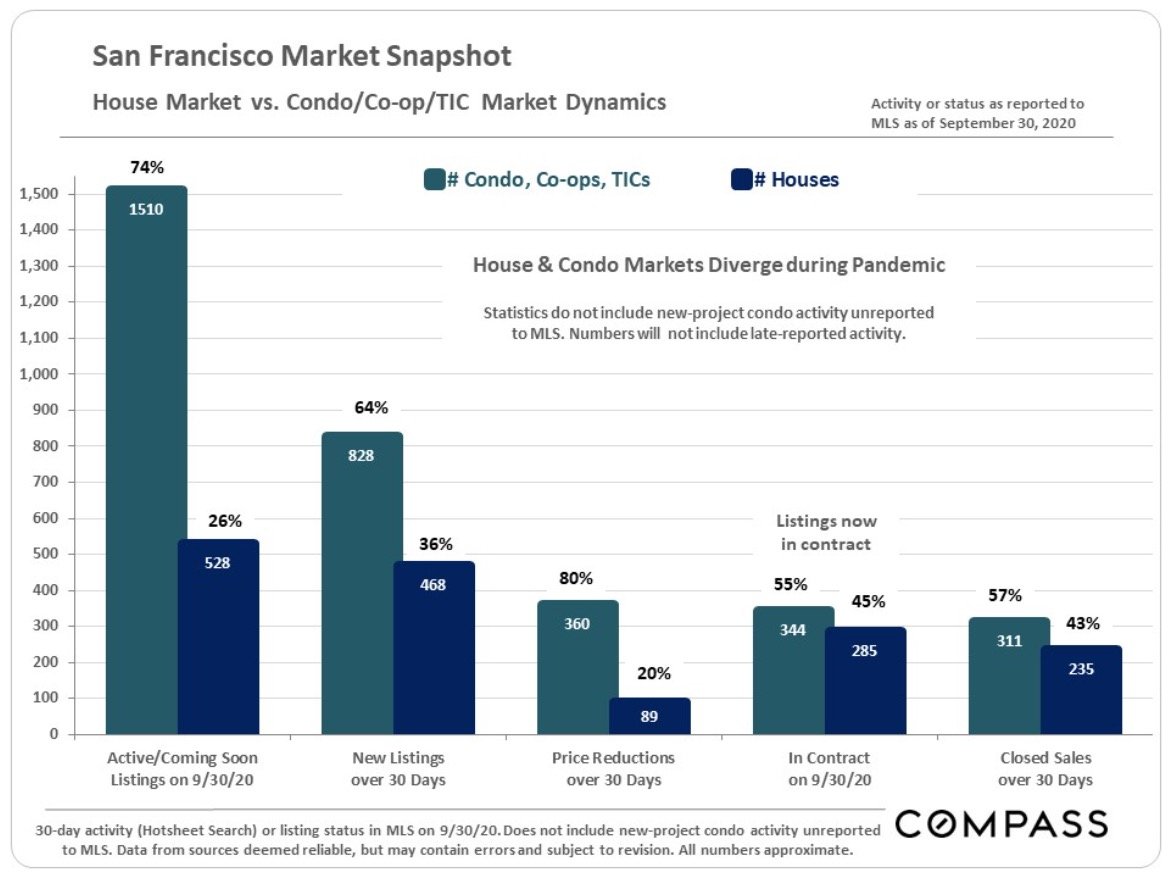
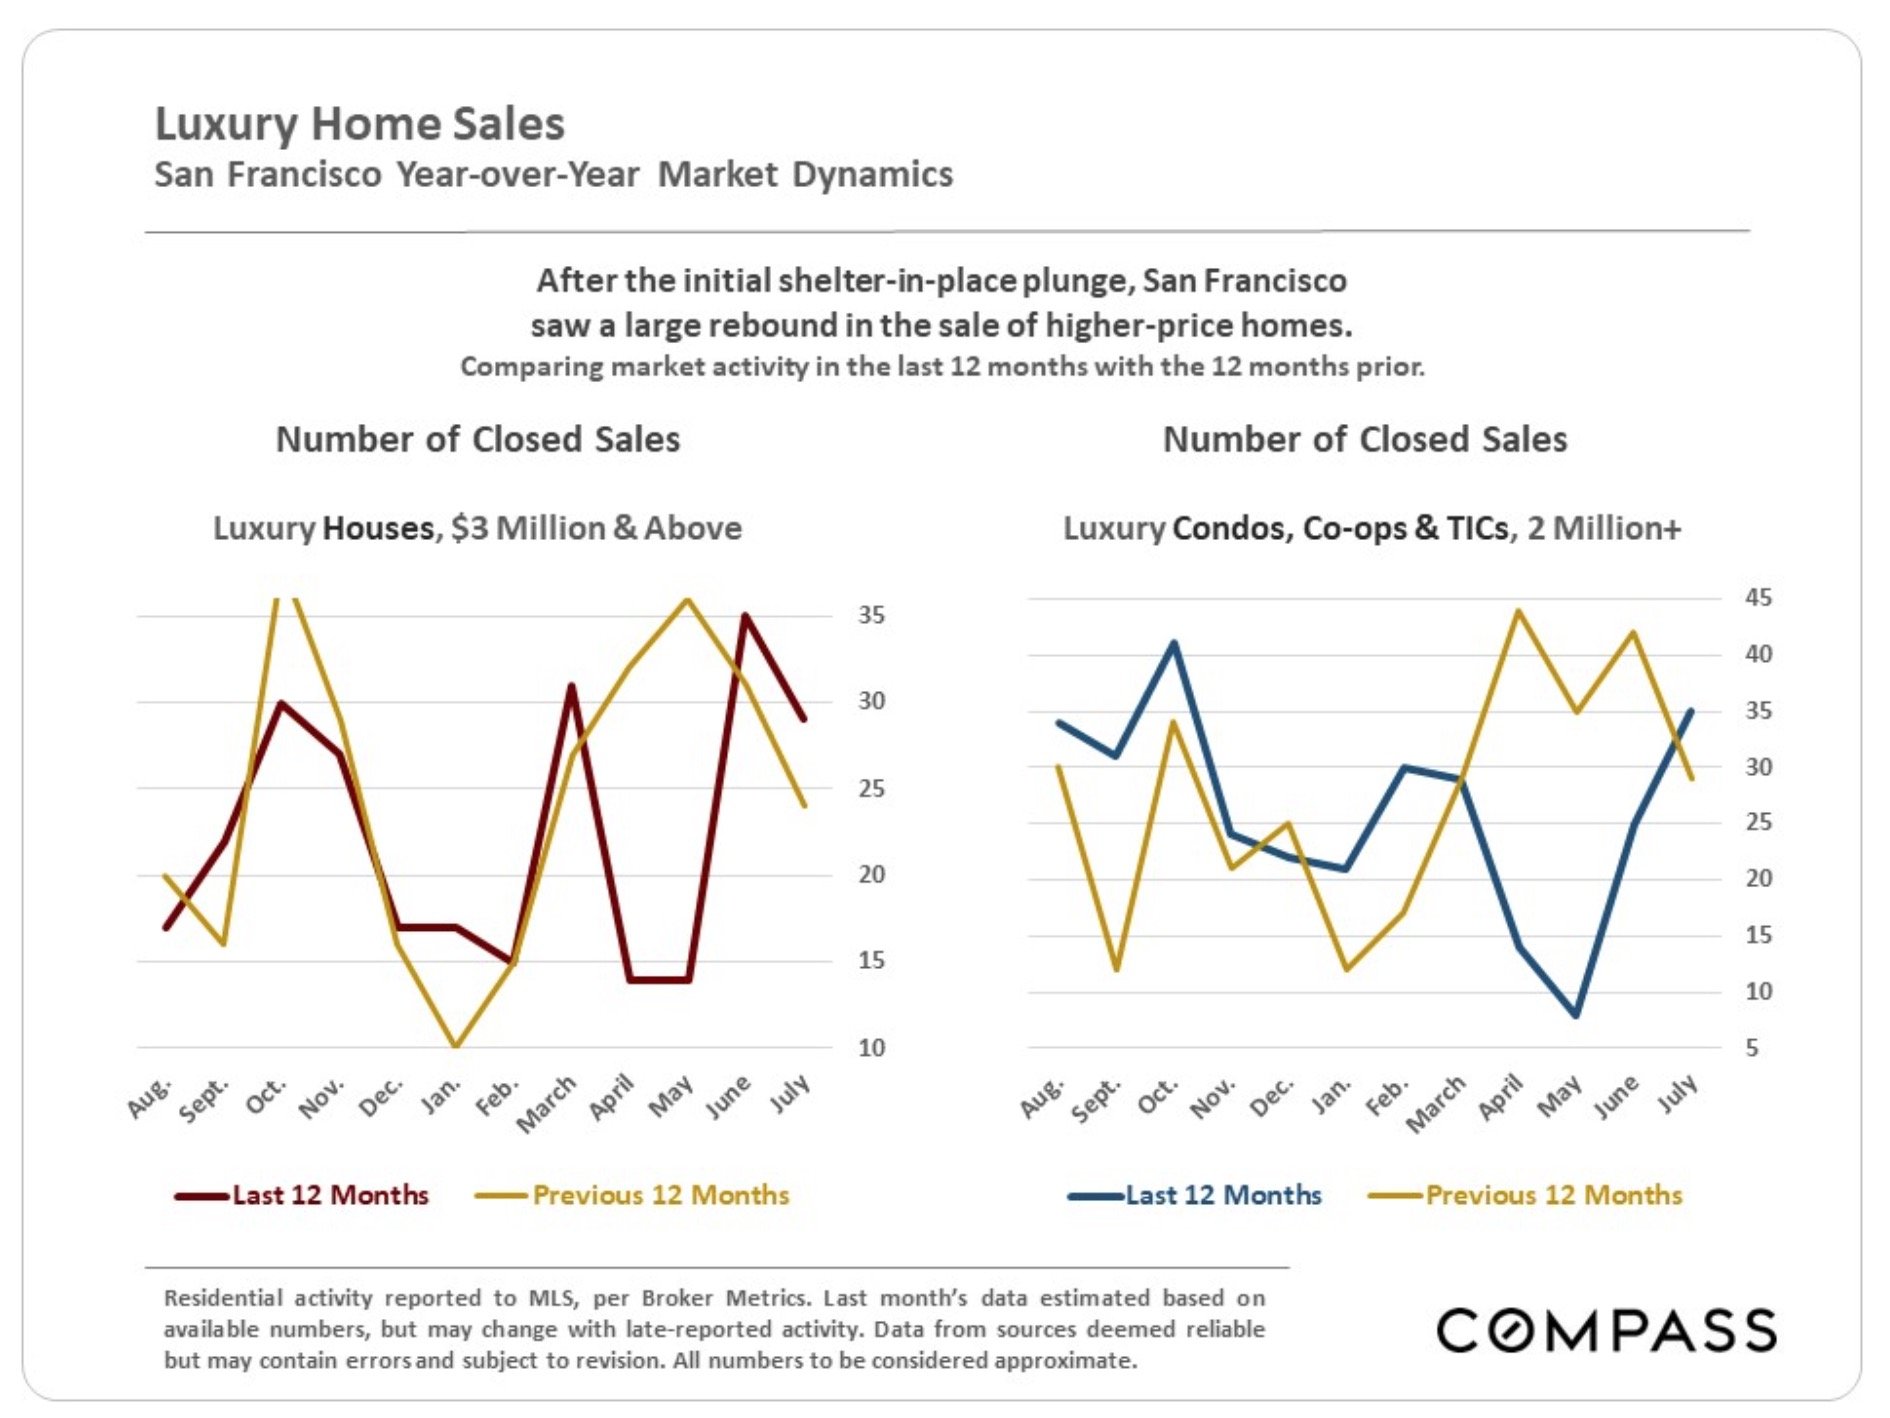
And before anyone gets carried away with optimism, let’s take a look at a few charts comparing where we are to last year.  We don’t yet have numbers for May, but you can see that we are running at less than a third of our sales volume for this time of year.  Spring is typically one of our two busiest seasons. While the numbers for May, when they’re in, will doubtless show an improvement from April, they’re going to be nothing like the usual seasonal pace.

Prices

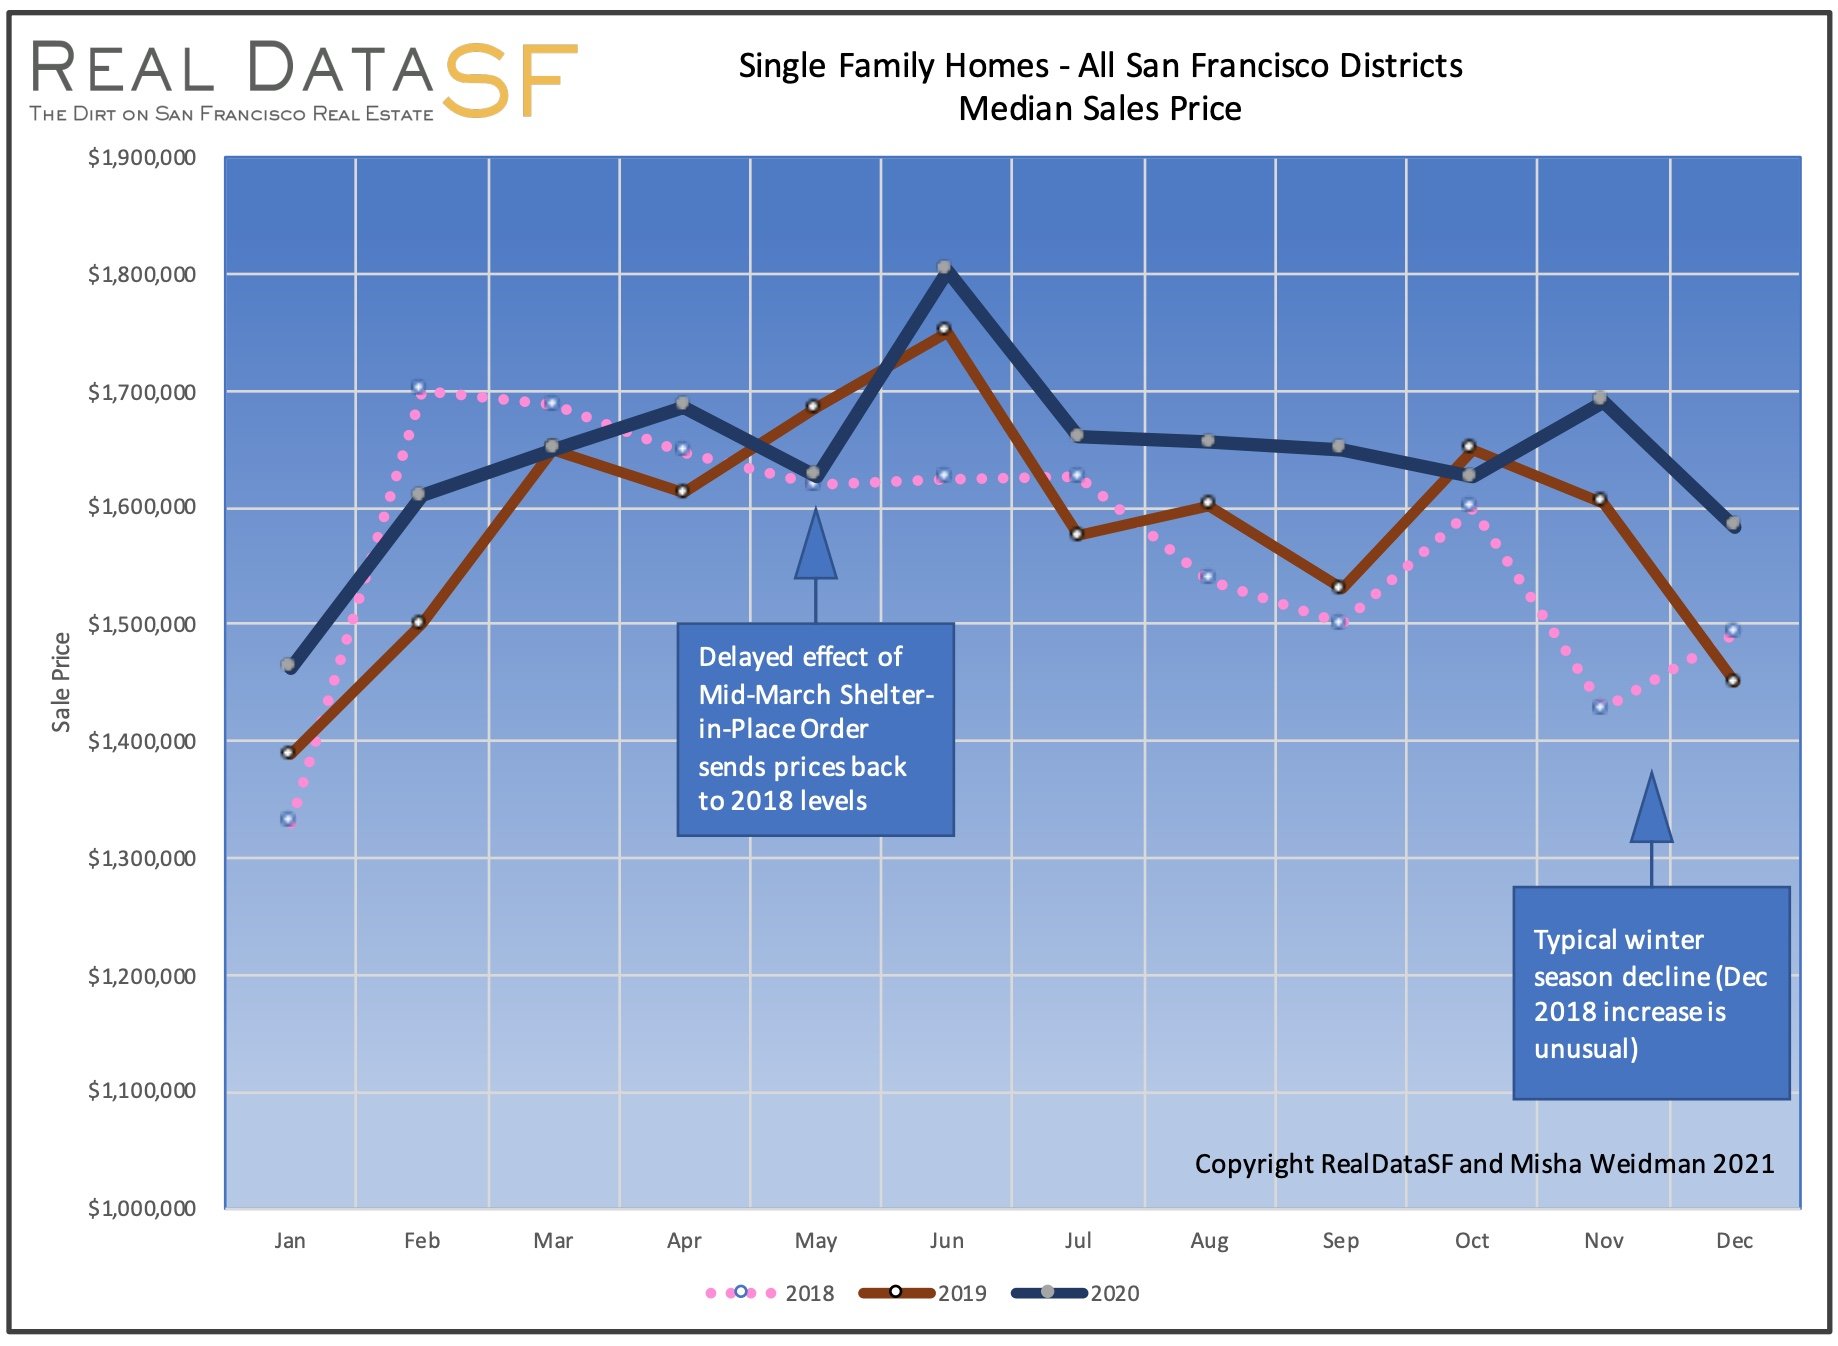
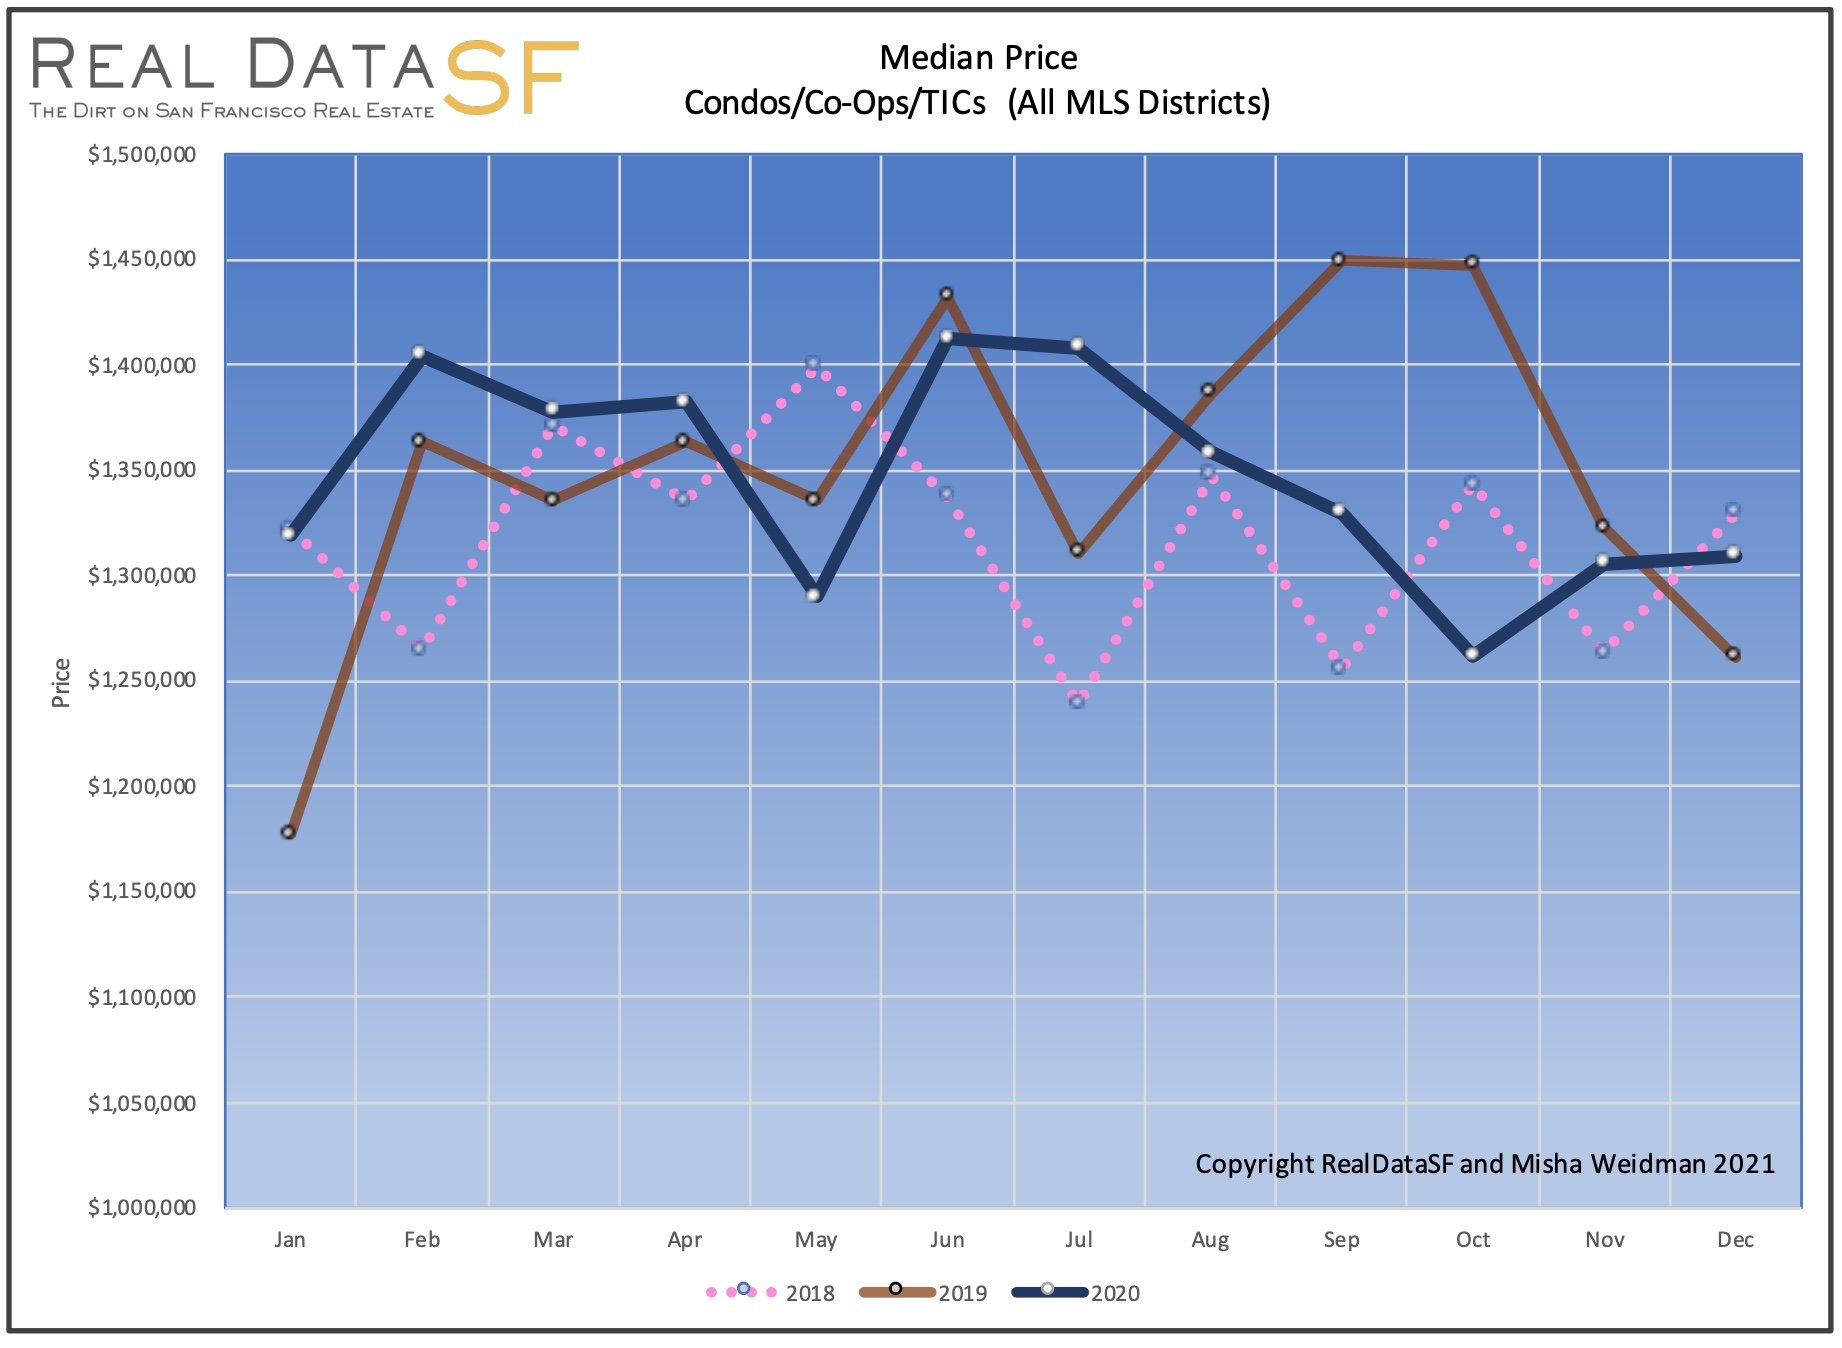
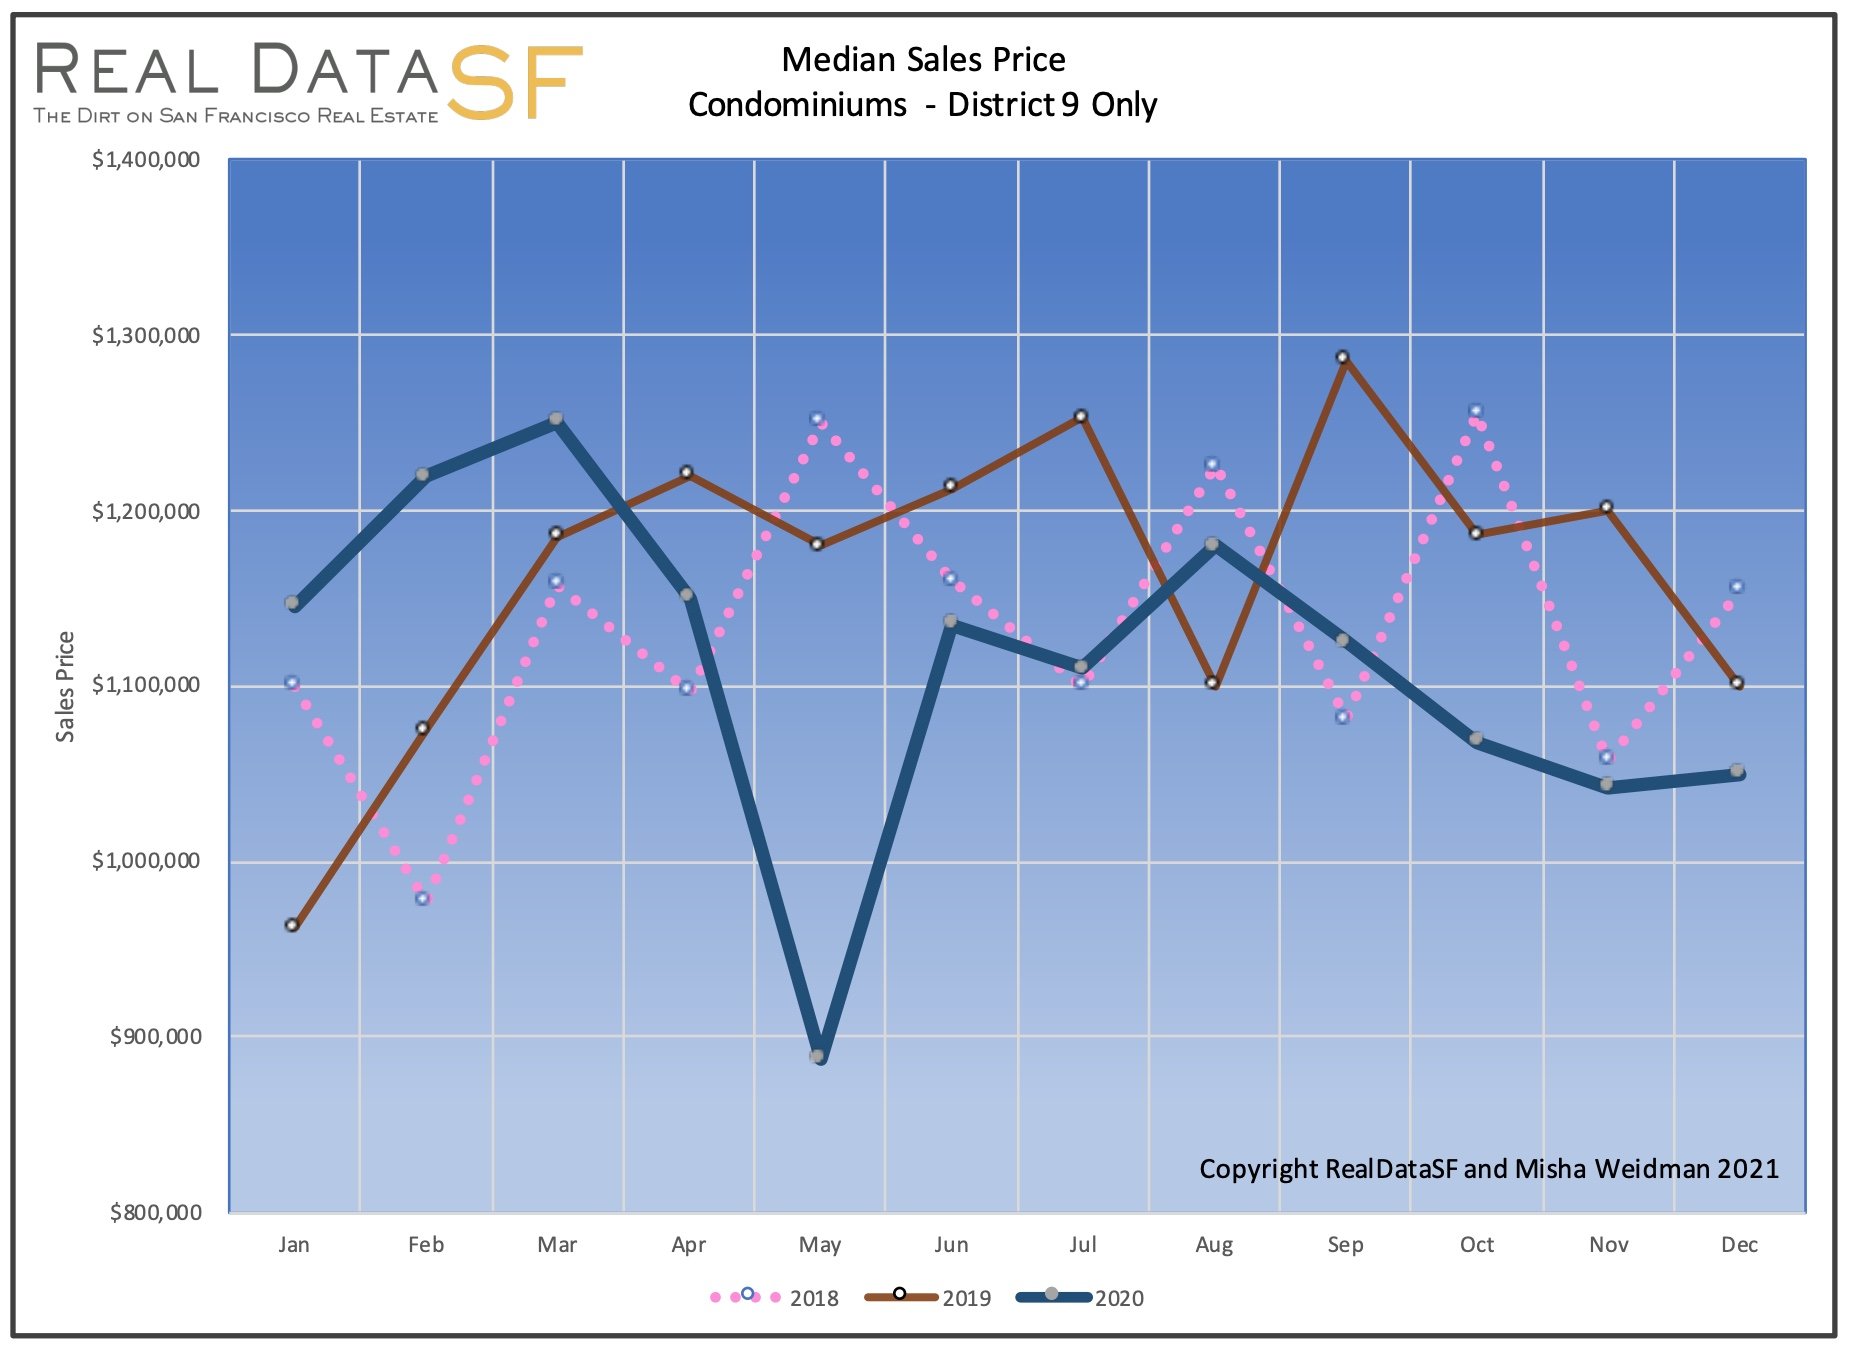
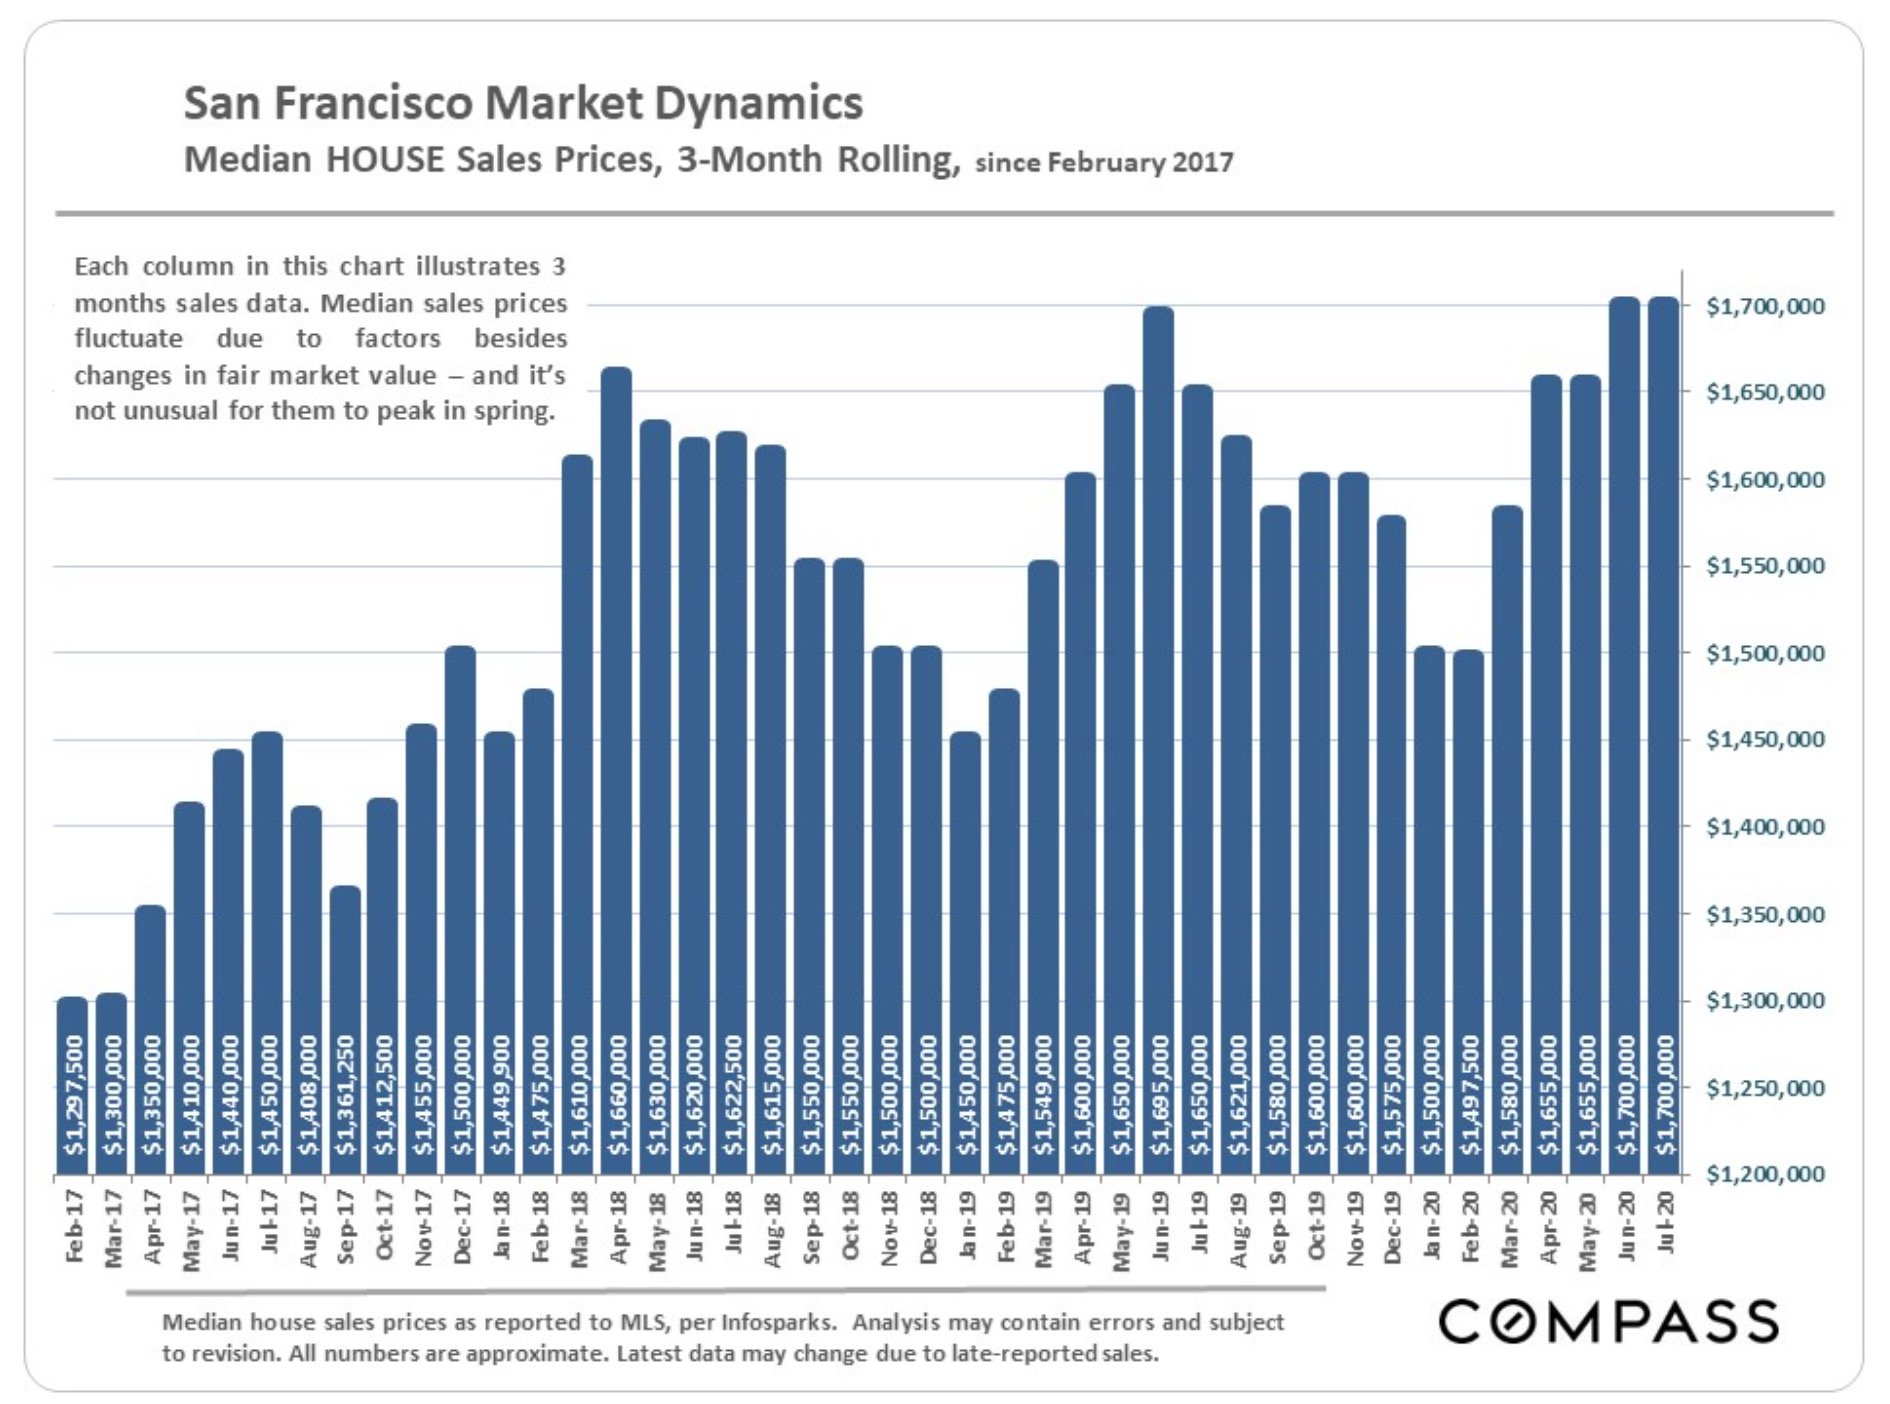
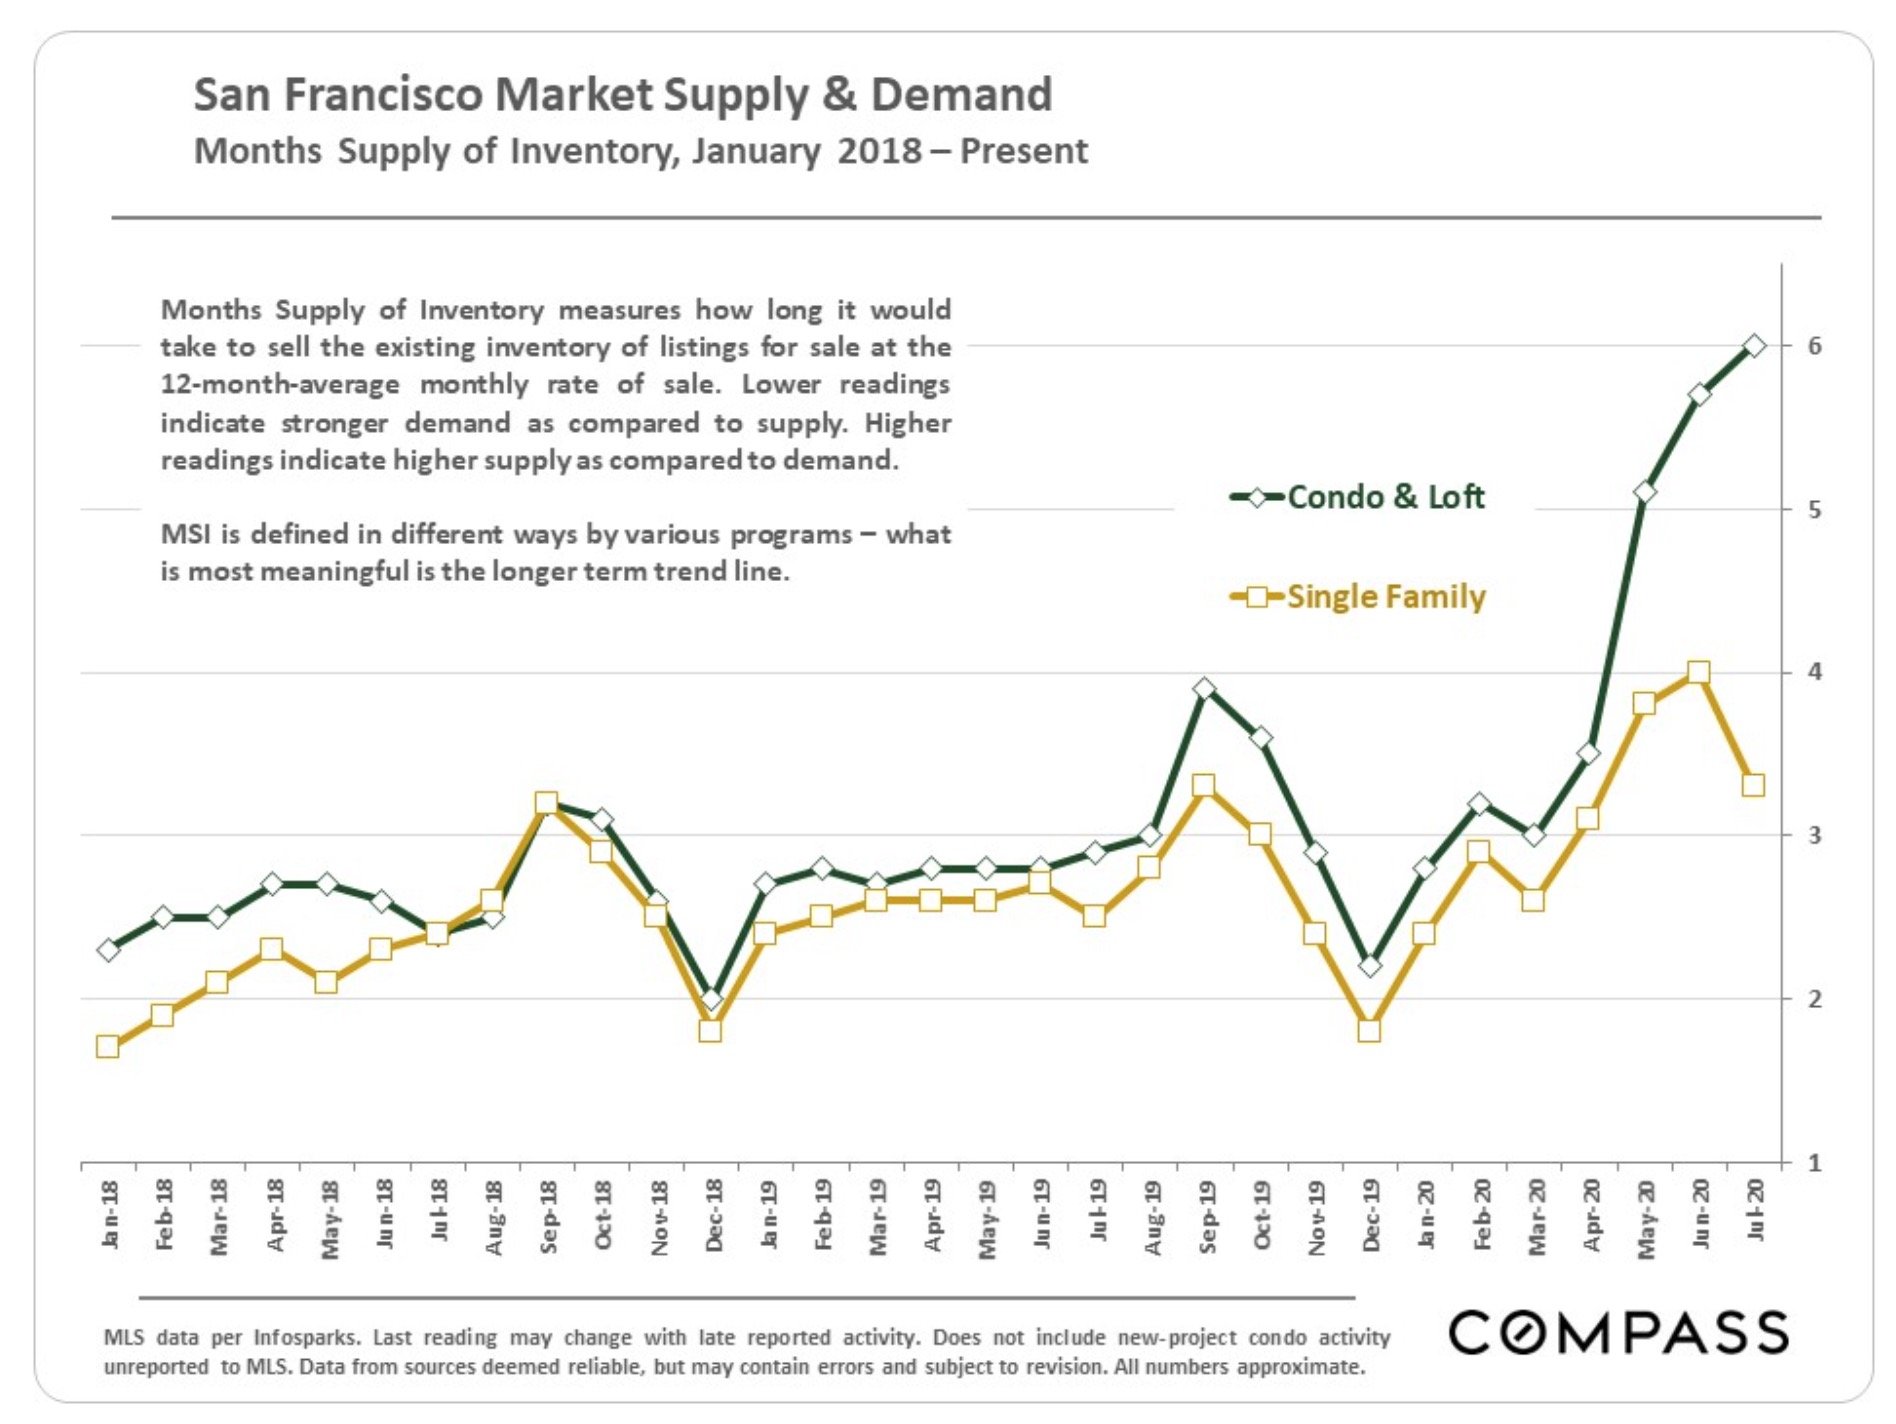
Of course, this is the question on everybody’s mind.  What’s happened to them?  The chart below combines single family homes and condo prices because there simply haven’t been enough sales for the numbers to be reliable without combining them.

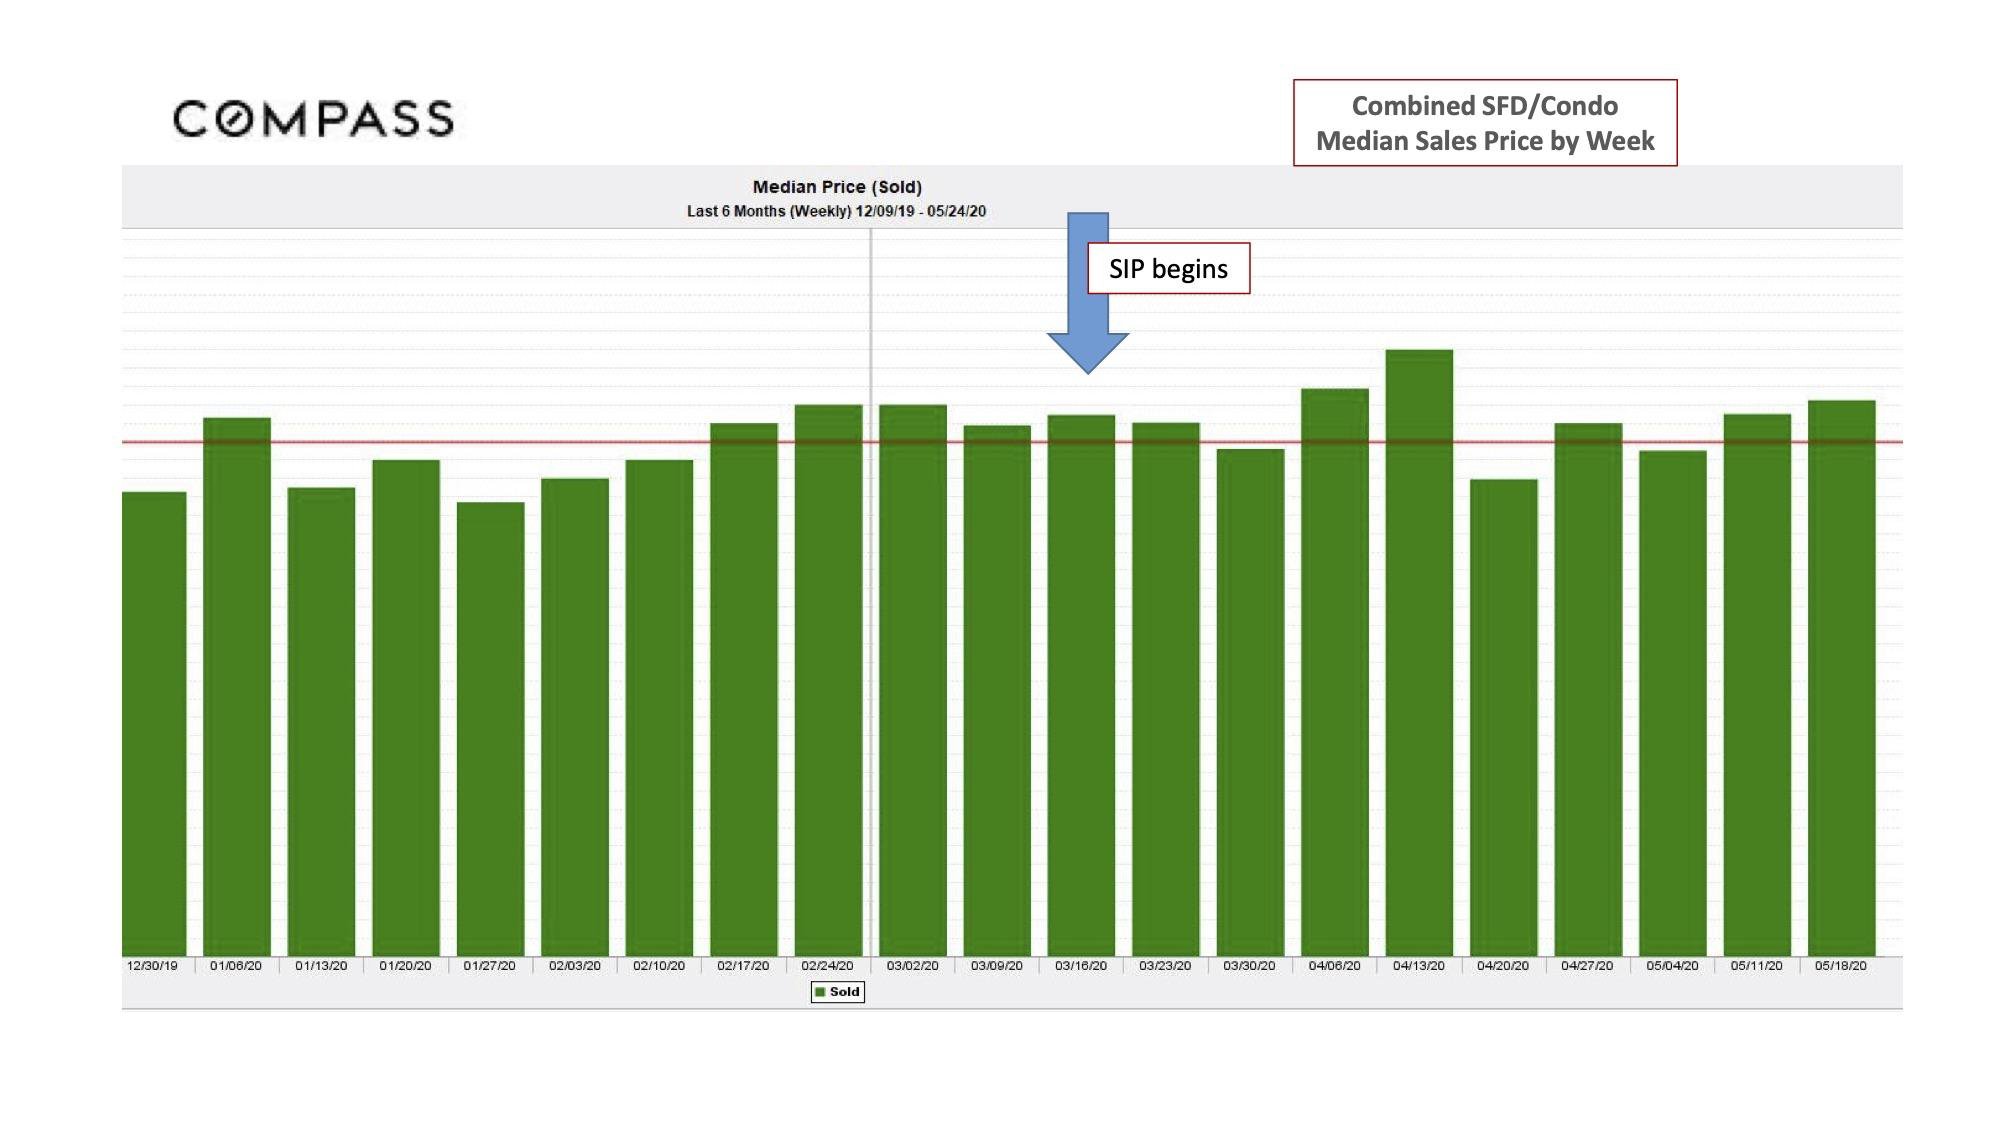
The takeaway here is simply that we haven’t seen an instantaneous and massive drop in home prices.  Until we get more data and are able to look at different segments (high vs low priced, condos vs homes), I’d be very cautious drawing any more conclusions.

Word on the now-virtual street, which I get through well-attended weekly sales meetings with over 100 agents present, is that single family homes under $2 million that check all the boxes are holding up OK.  Some agents are still listing very low in the hopes of attracting interest, but we may be re-entering an era of “transparent pricing” where properties are actually listed at what the seller expects to get, rather than hundreds of thousands below it in the hopes of creating a bidding war.  Certainly, no one should expect to see many of those while in-person showings remain severely limited.  The days of 100-person week-end open houses may be over, perhaps for longer than we think.

If there’s good news for sellers here, it’s that the days of “lookie-loo” buyers is also over.  Many sellers and agents are requiring that buyers who ask to see a property have done their due diligence and have shown that they’re financially qualified to purchase. Given the health risks, not to mention the additional paperwork involved for everyone, that’s a good thing. If they want to see your property in person, it means they’re serious buyers. 

Prognostications

We’re in unchartered territory here, so my guess is no better than anyone else’s, but since everyone’s been asking me, let me share my views candidly. 

Certainly the consensus globally among economists seems to be that it’s going to take time for economies around the world to recover and the US is no exception.  How much time?  I’ve seen at least a couple of reports suggesting that a return to pre-pandemic levels of GDP may take two to three years, with the most optimistic suggesting as early as late 2021.   

At the same time, we are blessed to be in a metropolitan area that has escaped – for now – the worst of the pandemic; one that has a diverse economic base; and, importantly, has been home to companies at the forefront of the “virtual” workplace since well before the pandemic.  That means that we’re more likely to have people who will keep their (well-paying) jobs and who can afford to buy homes in this area. 

People will continue to move here and away, to get married, have families.  The fact that real estate activity started to increase even before the SIP order was modified to include it as an “essential activity” attests to it being, well, “essential.”  If the SIP order continues to lift, I think that there could be a lot of pent up demand chasing not a lot of listings – unless there’s a wholesale move on the part of sellers to dump their homes.  And, unlike a stock, that’s not so easy to do.

Longer-term, I find it hard to imagine that prices aren’t going to soften and perhaps soften considerably the longer we are without a real solution to this devastating disease. 

But I am optimistic that we will find a solution eventually and when we do, I have no doubt at all that the San Francisco Bay Area will be among the first to see a recovery.  That’s not me being Polly-Anna.  I’ve lived through at least three major recessions and I believe that SF is even better placed now than in the past to bounce back.

And finally, for those of you just itching for a virtual tour of some beautiful condos, let me take this opportunity to proudly plug three of my own listings, all in Mission Bay.  (Click the links to be taken to the website.)


260 King Street, Unit 735
is a beautiful 2BR/2BA corner unit at The Beacon.  Gorgeous light and views from every window.  Listed at $1.325 million.

260 King Street, Unit 733, right next door, is a 1BR/1 BA.  Listed at $795,000, it just went into contract.

255 Berry Street, Unit 103, is a rare two-story condo with direct access to Berry Street. 2 BR/2.5 BA with each bedroom having its own ensuite bath.    Perfect for room-mates!  Listed at $1.475 million.

As always, your questions, comments and referrals are much appreciated!

Misha

Important: San Francisco Property Taxes Deadline Extended

Hello All:

The San Francisco Treasurer’s Office has extended the deadline to pay the second installment of property taxes for the 2019/2020 tax year to May 4, 2020. 

The usual date is April 10.

The penalty for late payment is hefty, so make sure you get your check in the mail postmarked no later than May 4.

And consider getting the regular date for each installment into your favorite perpetual calendar app:

The first installment is due November 1 of each year, and delinquent if not paid by December 10.
The second installment is due February 1 of the following year,  and delinquent if not paid by April 10.

Sending you my best wishes during this stressful time.  Stay safe!

Misha

Charting Covid-19’s Effect on San Francisco Real Estate

I remember how the world changed on September 11, 2001.  There was the horror of the actual event, the new sense of our own and our loved ones’ vulnerability to a random death. There were the new protocols for entering public spaces and traveling, the scanning of faces and backpacks that we’d never done before.  And there was grief.  We mourned not just the catastrophe but an irredeemable loss of innocence – not mankind’s first, and certainly not its last, but no less wrenching for that. 

The current crisis feels both similar and different.  Unlike 9/11, the streets remain eerily empty.  Restaurants and cafes are still shuttered.  We aren’t flocking together for comfort – we’re staying apart, isolated.  What’s similar is the pervasive sense that the worst is yet to come; that there’s a tsunami forming and very little we can do to avoid it crashing down us; that we are all much more mortal than we thought we were three weeks ago.

And now, as then, we go on.  We adapt.  We make the best of things and plan for the future.  In that spirit, I offer some insights on what Covid-19 is doing to San Francisco’s residential market.

The following chart tracks the number of new listings on the Multiple Listing Service (MLS) by week.  It might just as well track human sentiment.

In any normal year, new listings surge starting around February and into the Spring.  Instead, starting shortly after Mayor Breed’s and Governor Newsom’s “shelter in place” orders of March 16 and 19, new listings tumbled to levels normally seen in the heart of winter.  In short, except for transactions in process, residential real estate came to a hard stop in San Francisco.  No open houses, no private showings, no lender appraisals, no renovations, no staging.  I know from personal experience: I currently have three listings that were scheduled to go “live” in late March.  They are all on hold.

Meanwhile, properties that were on the market have been “withdrawn” in record numbers (see below).  In addition, the San Francisco Association of Realtors (SFAR) has created a new status called “Hold,” in which properties can technically remain listed on the market without having their “days on market” count against them. This possibly explains the drop in the number of Withdrawn listings for the week of March 23, as properties were shifted to that category.

The combined effect of no new listings and a huge number of withdrawn listings has resulted in very few remaining “Active” listings being on the market – the opposite of the usual Spring cycle.

If the supply side has dropped off a cliff, demand is following suit, as the next chart shows.  Furthermore, the accepted offers that are still being recorded probably represent transactions in which buyers had already toured the property prior to the “shelter in place” order going into effect.  The numbers may decline further in coming weeks.

What will the future bring?  Hopefully, an avoidance of the worst outcomes – unthinkable death tolls, lost businesses, lost jobs, lost friends and family. 

For the real estate market, in my view, it’s too soon to tell.  Zillow has a white paper that reviews studies of pandemics including, SARS (2003), the Spanish Flu (2018) and early results from Covid-19 in China.  The conclusion seems to be that real estate market values held steady while activity dropped, and that both activity and values rebounded when the crisis passed.  Whether that will be the case this time is anybody’s guess. 

Here’s my guess: the longer the crisis continues, the more likely it is that it will do long-lasting damage to the economy and the real estate market itself. If the crisis is short and businesses can hire back employees and the self-employed can get back on their feet, then I can certainly imagine a robust bounce back to pre-Covid activity and prices. But as the crisis drags on, I worry that it may take time for lost jobs and lost equity to come back. Like the proverbial tanker, if the global economy really slows, it will be hard to get it going again. An article in today’s NY Times said as much.

Despite our current challenges, I absolutely believe that San Francisco is better-positioned than most places in the world to weather and ultimately recover from this pandemic, both physically and economically. All of the things that make this a great place to live and work remain in place.

Meanwhile, I am doing lots of walking (Luna is grateful!) and discovering hidden places I never knew about, despite many decades of living here.  One recent discovery:  Tank Hill and Pemberton Lane Stairs, just below Twin Peaks.  You can read more about them here. 

Stay safe, everyone.  As always, your questions, comments and referrals are much appreciated!

Misha

The 2019 Residential Real Estate Wrap-Up

Hello All, and Happy New Decade. Thank you for all the positive feedback I’ve gotten over the last year for my newsletter. It’s a labor of love and it’s nice to know it’s appreciated. I encourage everyone to post comments right on my website to keep the conversation going, but if that’s too much trouble, just email me.

Our Chief Market Analyst, Patrick Carlisle, has done a fabulous job summarizing all the data for 2019 in a set of charts that really speak for themselves, so this month I’m simply going to repost his report without further commentary. Do note, however, that I have additional charts available for any MLS District you’re interested in, so if it’s not one of the three covered in his report, just let me know and I’ll send it to you.

All the best,

Misha

– – – – – – – – – – – – – – – – – – – – – – – – – – –

Generally speaking, after years of high appreciation rates, annual 2019 Bay Area median home prices went down a little bit, went up a little bit or basically remained unchanged as compared to 2018. SF hit new quarterly price highs in spring of 2019 (amid all the IPO excitement), but ended up the year at about flat for houses and a little up for condos. (Since there has been so much new luxury condo construction in recent years, year-over-year median price comparisons may not be exactly apples to apples.)

For 2020, economist Ken Rosen at UC Berkeley has said he expects the Bay Area median price to remain basically flat, within a general range of up or down 2% – in other words, similar to what happened last year. We can’t predict the future, but that certainly doesn’t sound unreasonable, and happily avoids the sensationalism of many other media-grabbing forecasts.

One of the big factors in SF house price appreciation since 2012 has been that fewer house owners are selling (dark green portion of chart below). If demand increases, but supply drops, that puts upward pressure on prices. Overall, house prices have out-appreciated condos over the past 7 years due to 2 factors: All the new condo construction and the fact that condo owners sell their homes more often than house owners. Both those factors increase supply to help meet increased demand.

San Francisco Home Prices by Neighborhood

Below are just two of the tables in our much longer analysis of home prices by property type and bedroom count for every neighborhood in the city. If you’d like the complete report, contact your Compass agent.

San Francisco Luxury Home
Markets by District

Economic Factors Affecting
Real Estate Markets