Charting Covid-19’s Effect on San Francisco Real Estate

I remember how the world changed on September 11, 2001.  There was the horror of the actual event, the new sense of our own and our loved ones’ vulnerability to a random death. There were the new protocols for entering public spaces and traveling, the scanning of faces and backpacks that we’d never done before.  And there was grief.  We mourned not just the catastrophe but an irredeemable loss of innocence – not mankind’s first, and certainly not its last, but no less wrenching for that. 

The current crisis feels both similar and different.  Unlike 9/11, the streets remain eerily empty.  Restaurants and cafes are still shuttered.  We aren’t flocking together for comfort – we’re staying apart, isolated.  What’s similar is the pervasive sense that the worst is yet to come; that there’s a tsunami forming and very little we can do to avoid it crashing down us; that we are all much more mortal than we thought we were three weeks ago.

And now, as then, we go on.  We adapt.  We make the best of things and plan for the future.  In that spirit, I offer some insights on what Covid-19 is doing to San Francisco’s residential market.

The following chart tracks the number of new listings on the Multiple Listing Service (MLS) by week.  It might just as well track human sentiment.

In any normal year, new listings surge starting around February and into the Spring.  Instead, starting shortly after Mayor Breed’s and Governor Newsom’s “shelter in place” orders of March 16 and 19, new listings tumbled to levels normally seen in the heart of winter.  In short, except for transactions in process, residential real estate came to a hard stop in San Francisco.  No open houses, no private showings, no lender appraisals, no renovations, no staging.  I know from personal experience: I currently have three listings that were scheduled to go “live” in late March.  They are all on hold.

Meanwhile, properties that were on the market have been “withdrawn” in record numbers (see below).  In addition, the San Francisco Association of Realtors (SFAR) has created a new status called “Hold,” in which properties can technically remain listed on the market without having their “days on market” count against them. This possibly explains the drop in the number of Withdrawn listings for the week of March 23, as properties were shifted to that category.

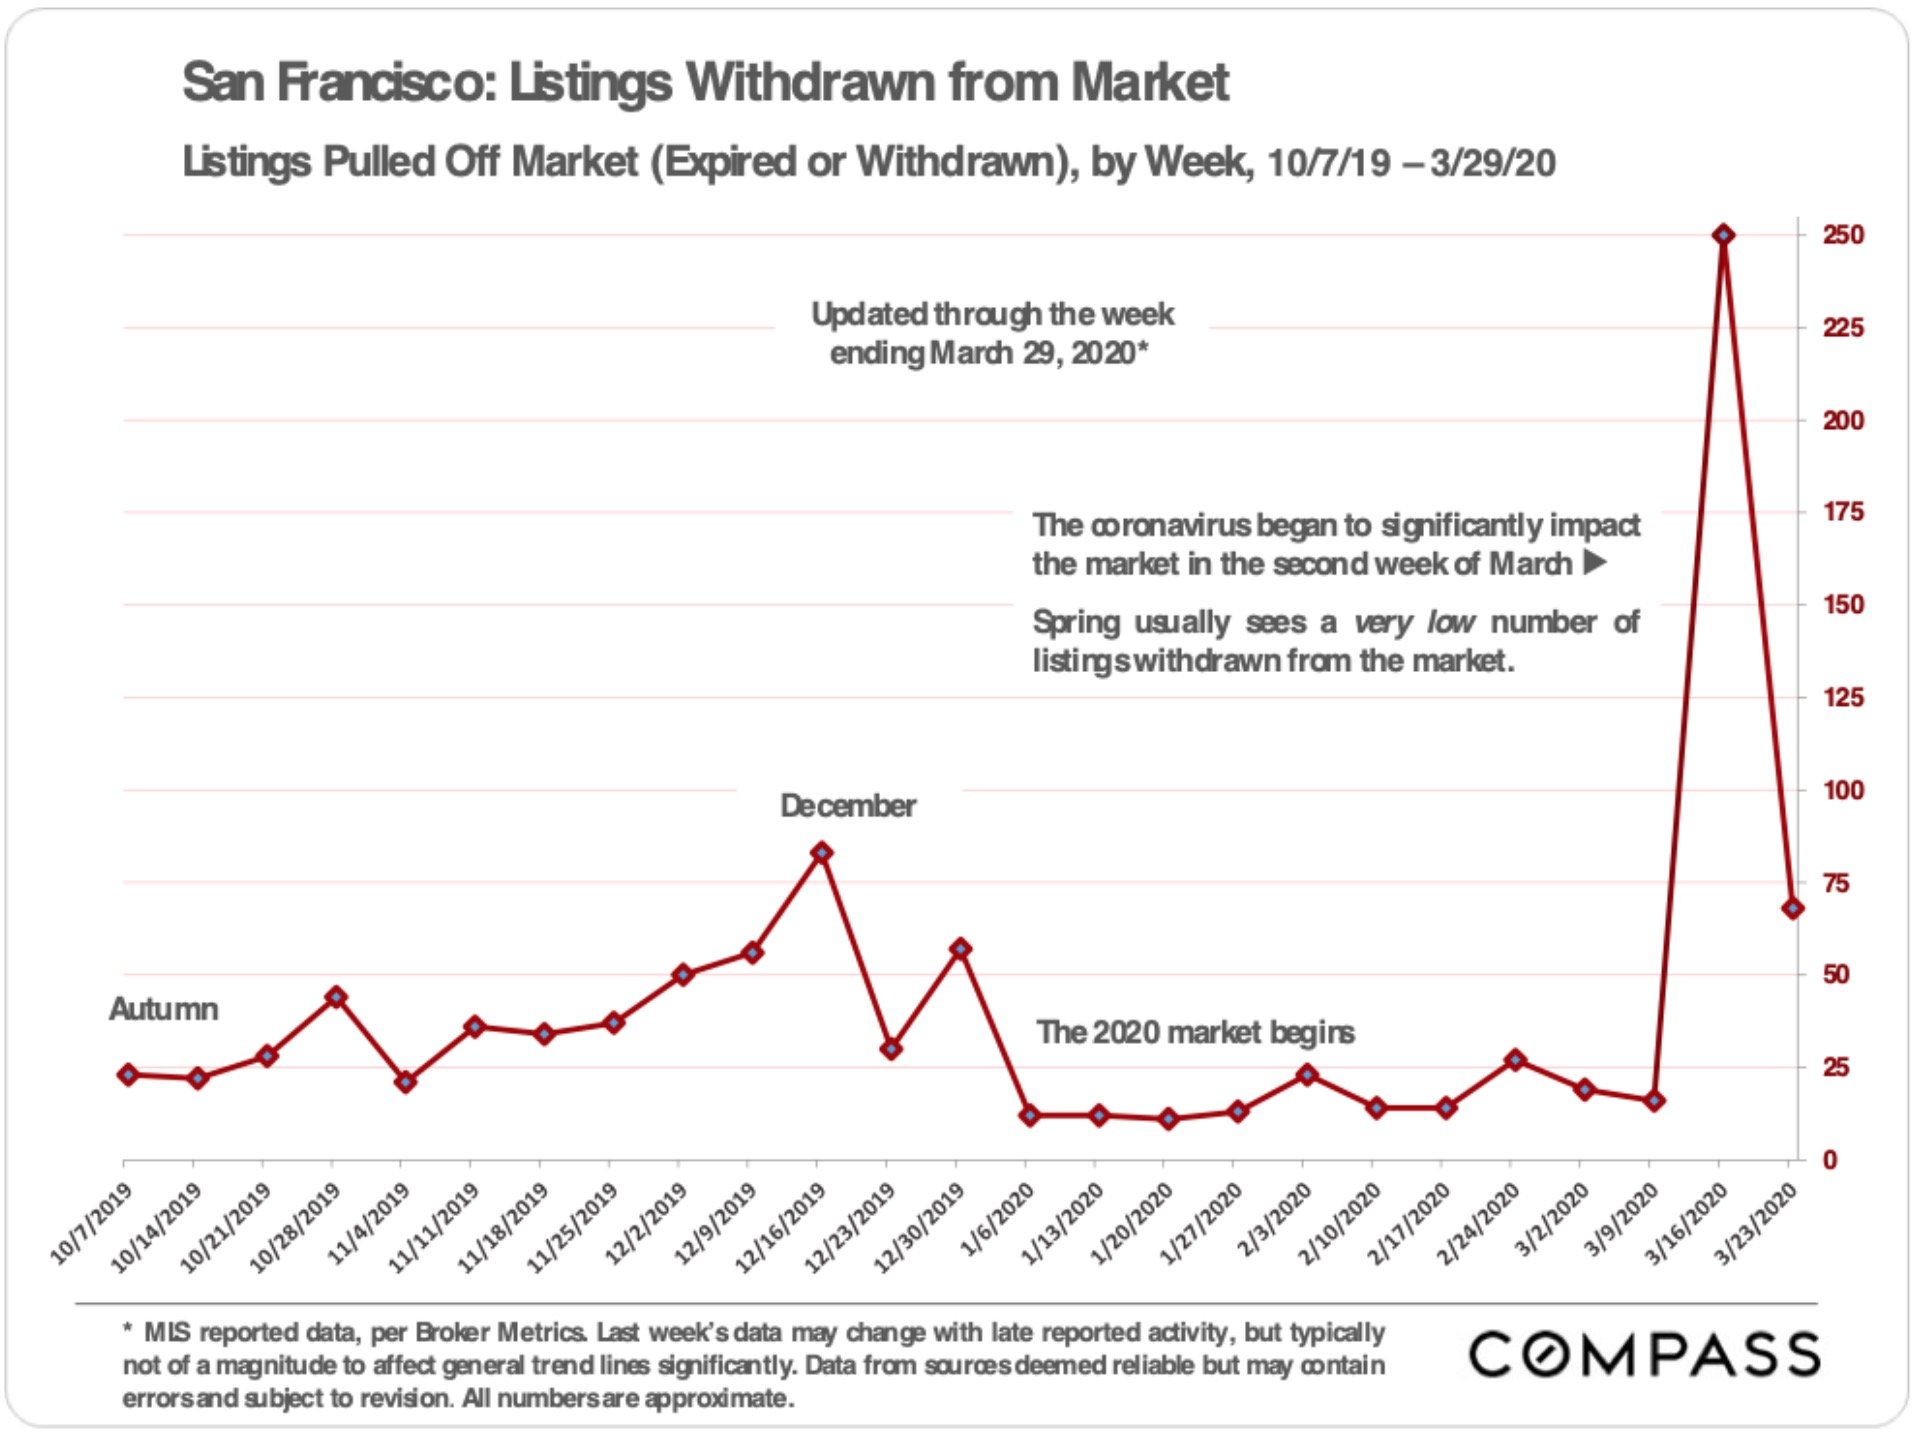
The combined effect of no new listings and a huge number of withdrawn listings has resulted in very few remaining “Active” listings being on the market – the opposite of the usual Spring cycle.

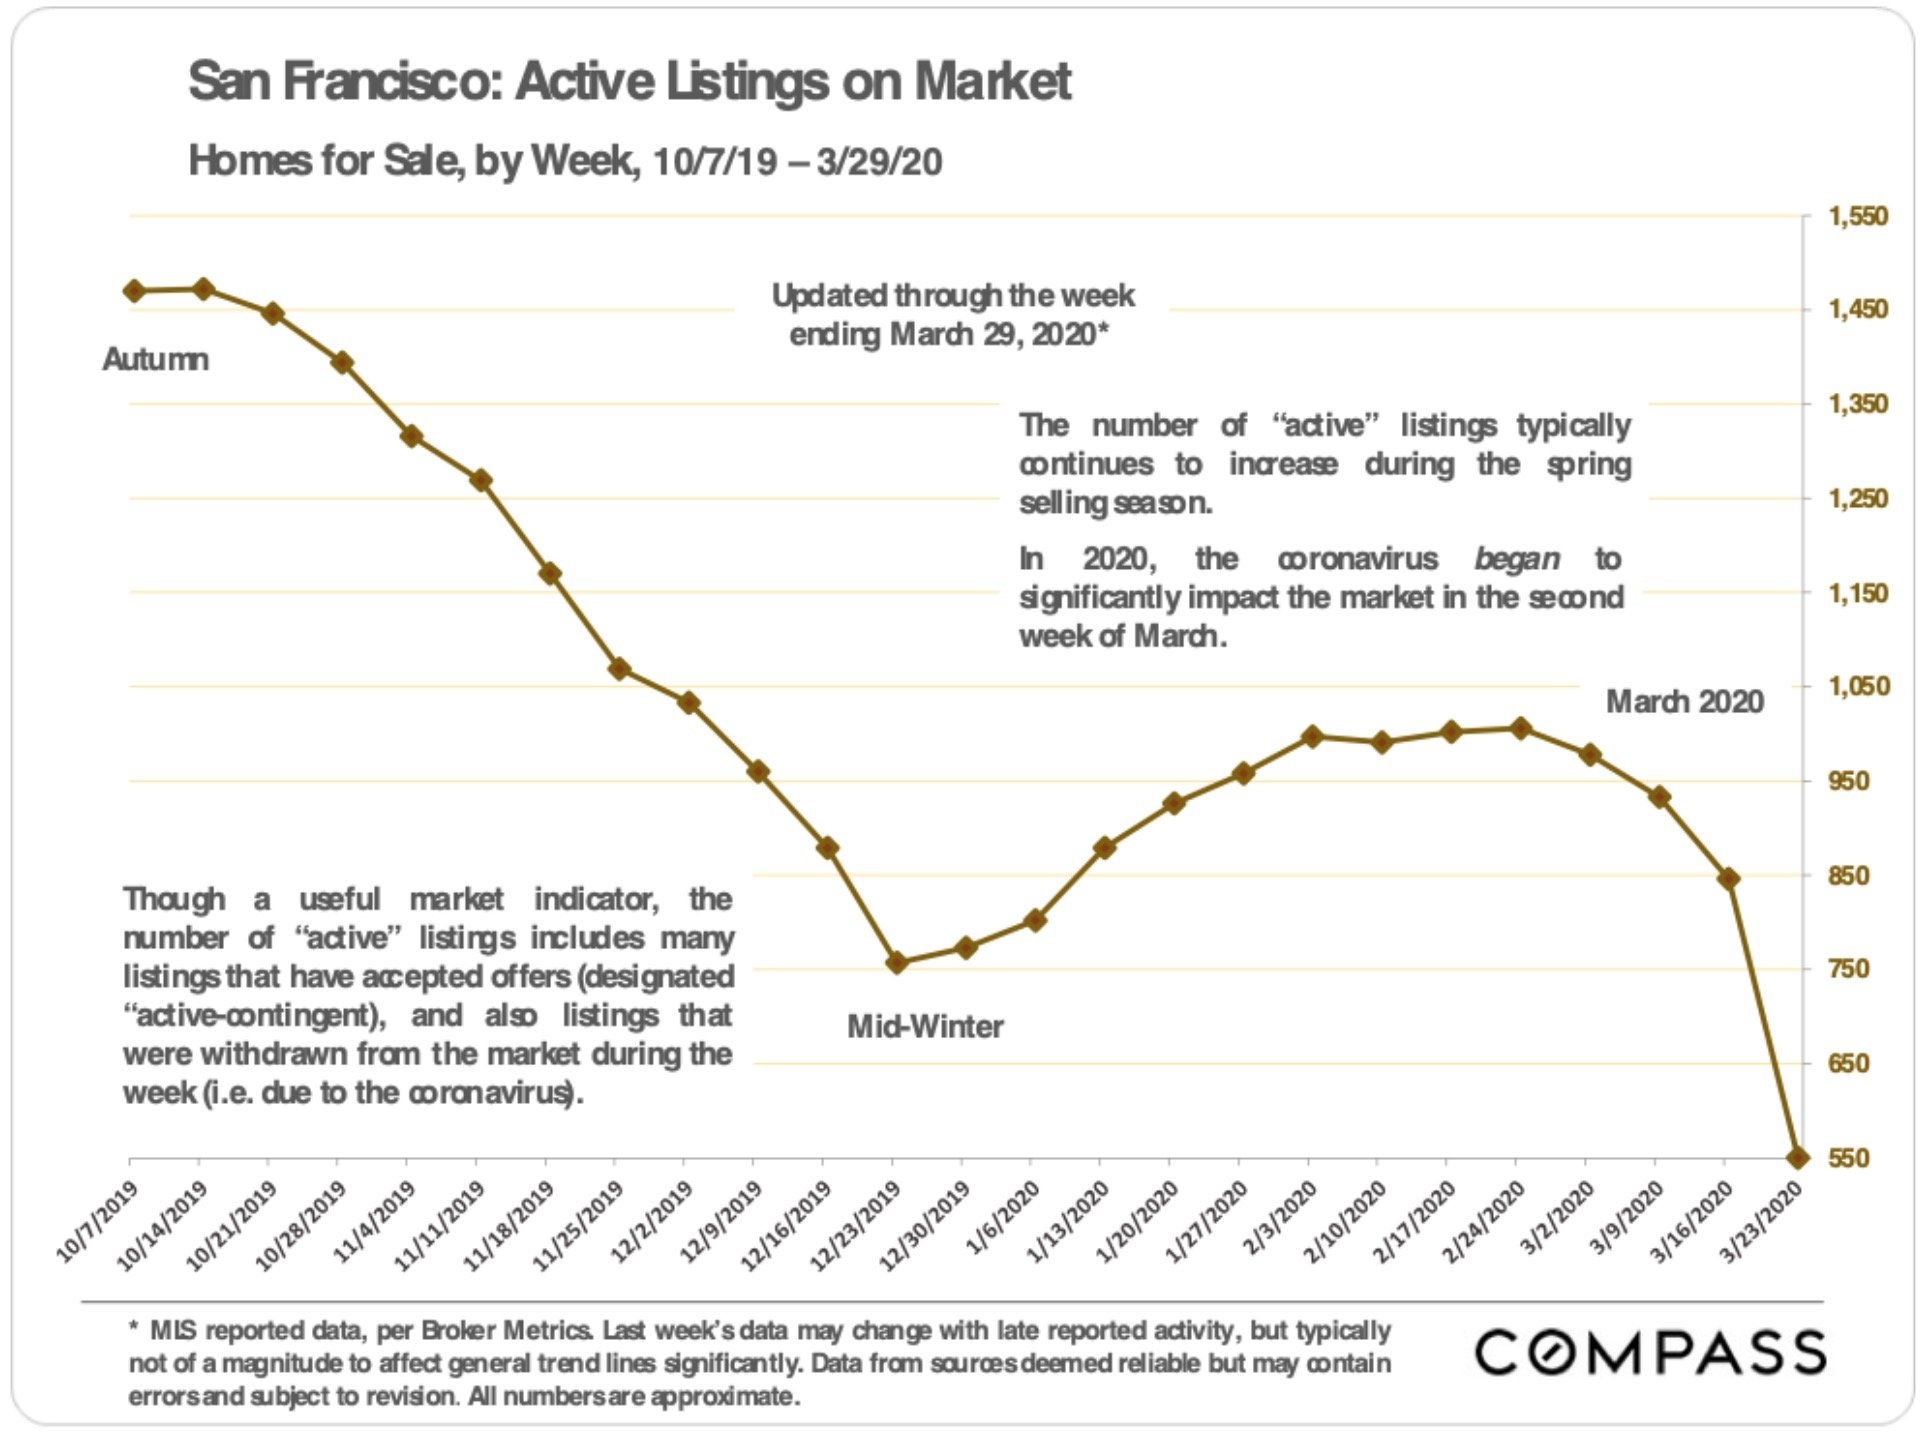
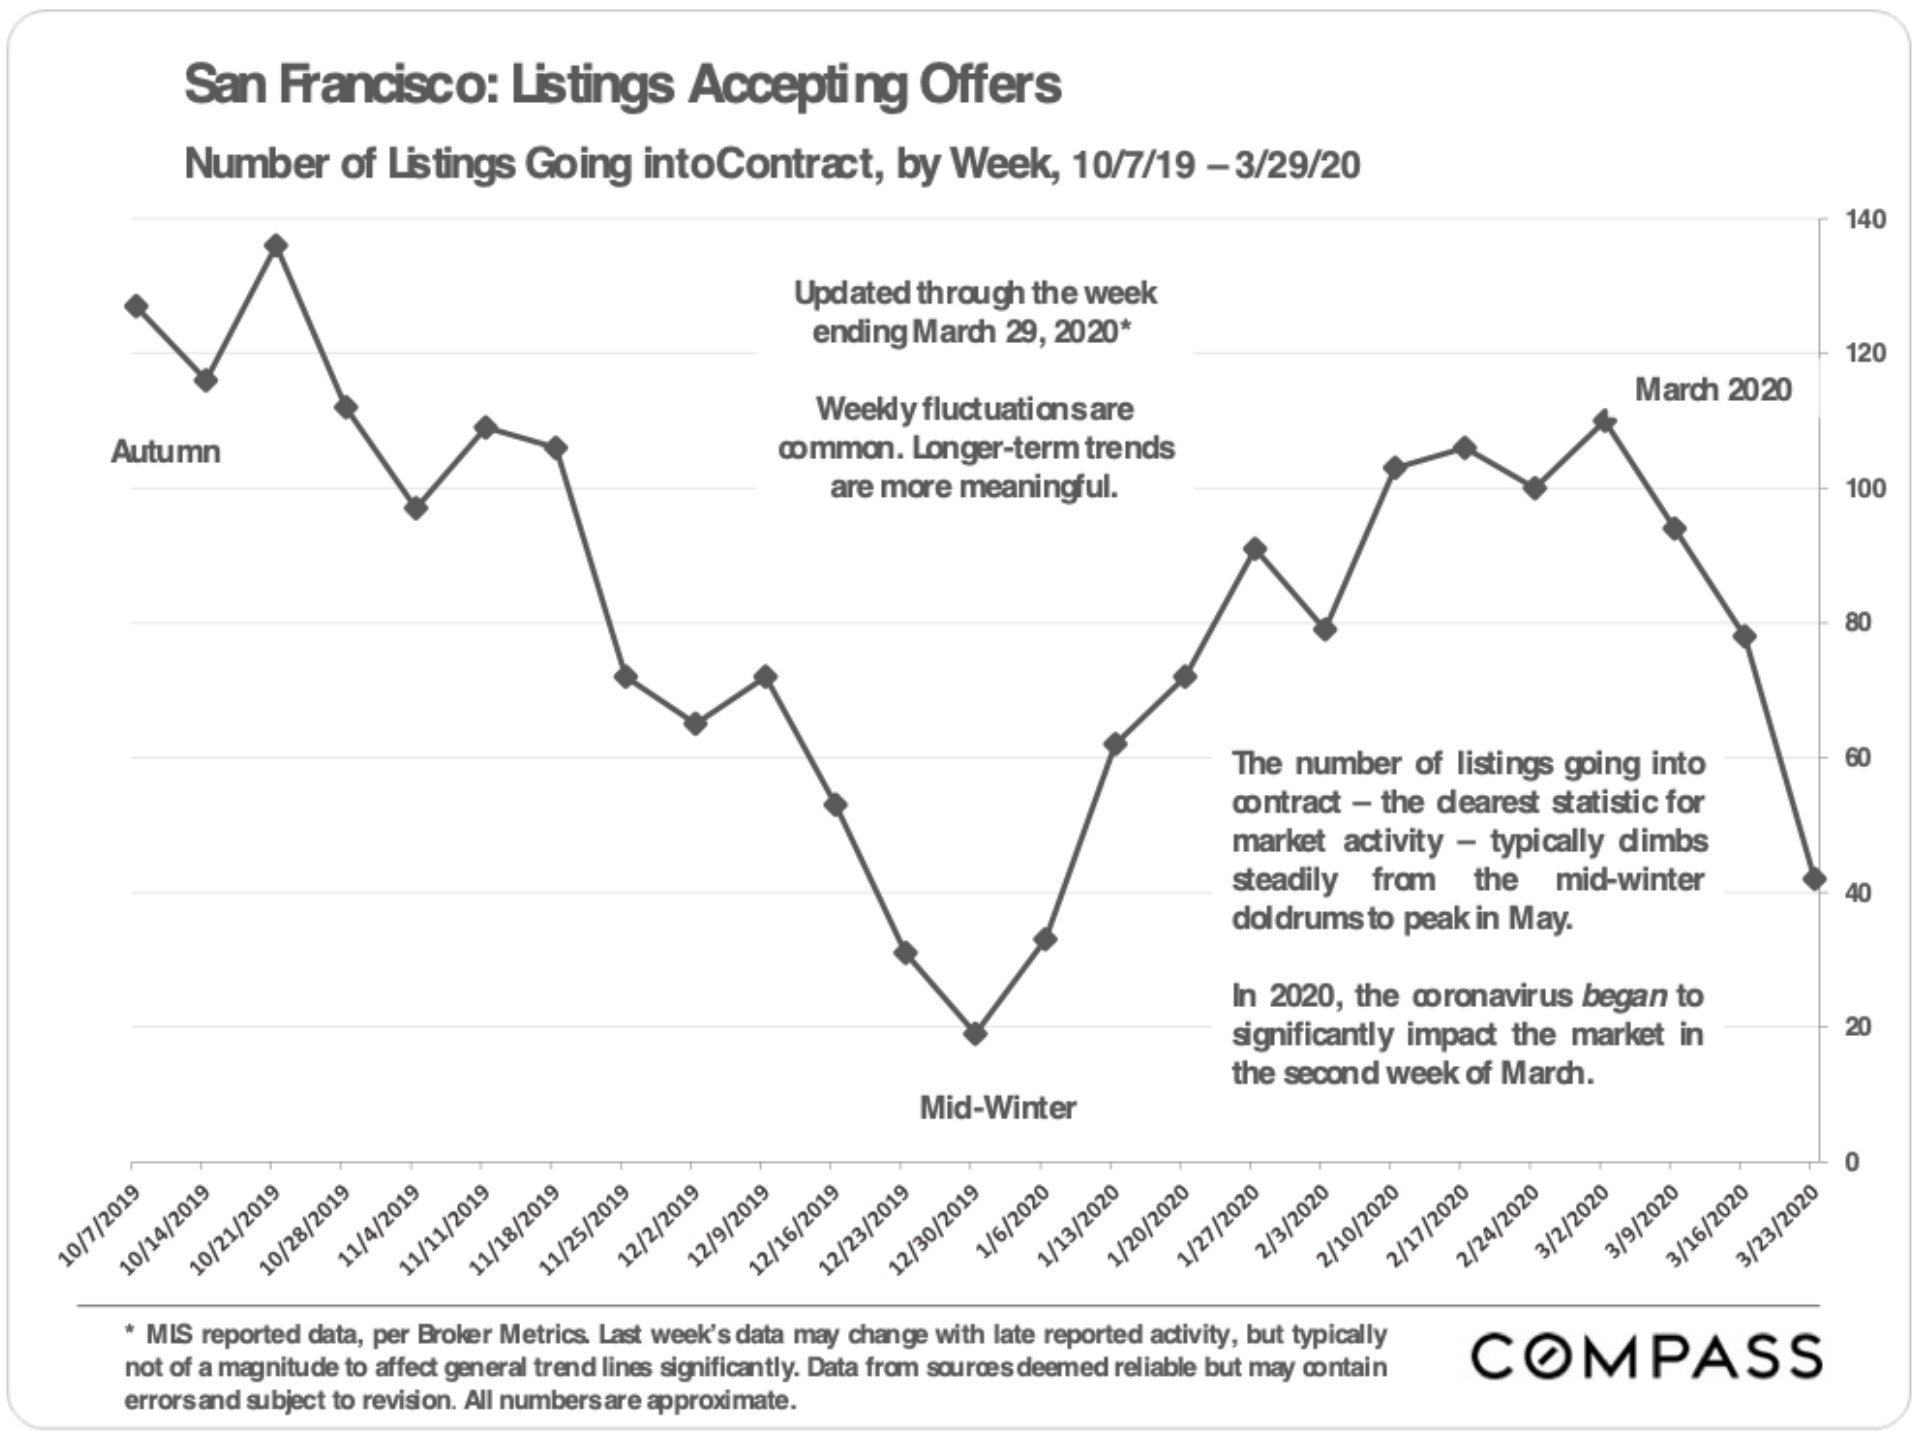
If the supply side has dropped off a cliff, demand is following suit, as the next chart shows.  Furthermore, the accepted offers that are still being recorded probably represent transactions in which buyers had already toured the property prior to the “shelter in place” order going into effect.  The numbers may decline further in coming weeks.

What will the future bring?  Hopefully, an avoidance of the worst outcomes – unthinkable death tolls, lost businesses, lost jobs, lost friends and family. 

For the real estate market, in my view, it’s too soon to tell.  Zillow has a white paper that reviews studies of pandemics including, SARS (2003), the Spanish Flu (2018) and early results from Covid-19 in China.  The conclusion seems to be that real estate market values held steady while activity dropped, and that both activity and values rebounded when the crisis passed.  Whether that will be the case this time is anybody’s guess. 

Here’s my guess: the longer the crisis continues, the more likely it is that it will do long-lasting damage to the economy and the real estate market itself. If the crisis is short and businesses can hire back employees and the self-employed can get back on their feet, then I can certainly imagine a robust bounce back to pre-Covid activity and prices. But as the crisis drags on, I worry that it may take time for lost jobs and lost equity to come back. Like the proverbial tanker, if the global economy really slows, it will be hard to get it going again. An article in today’s NY Times said as much.

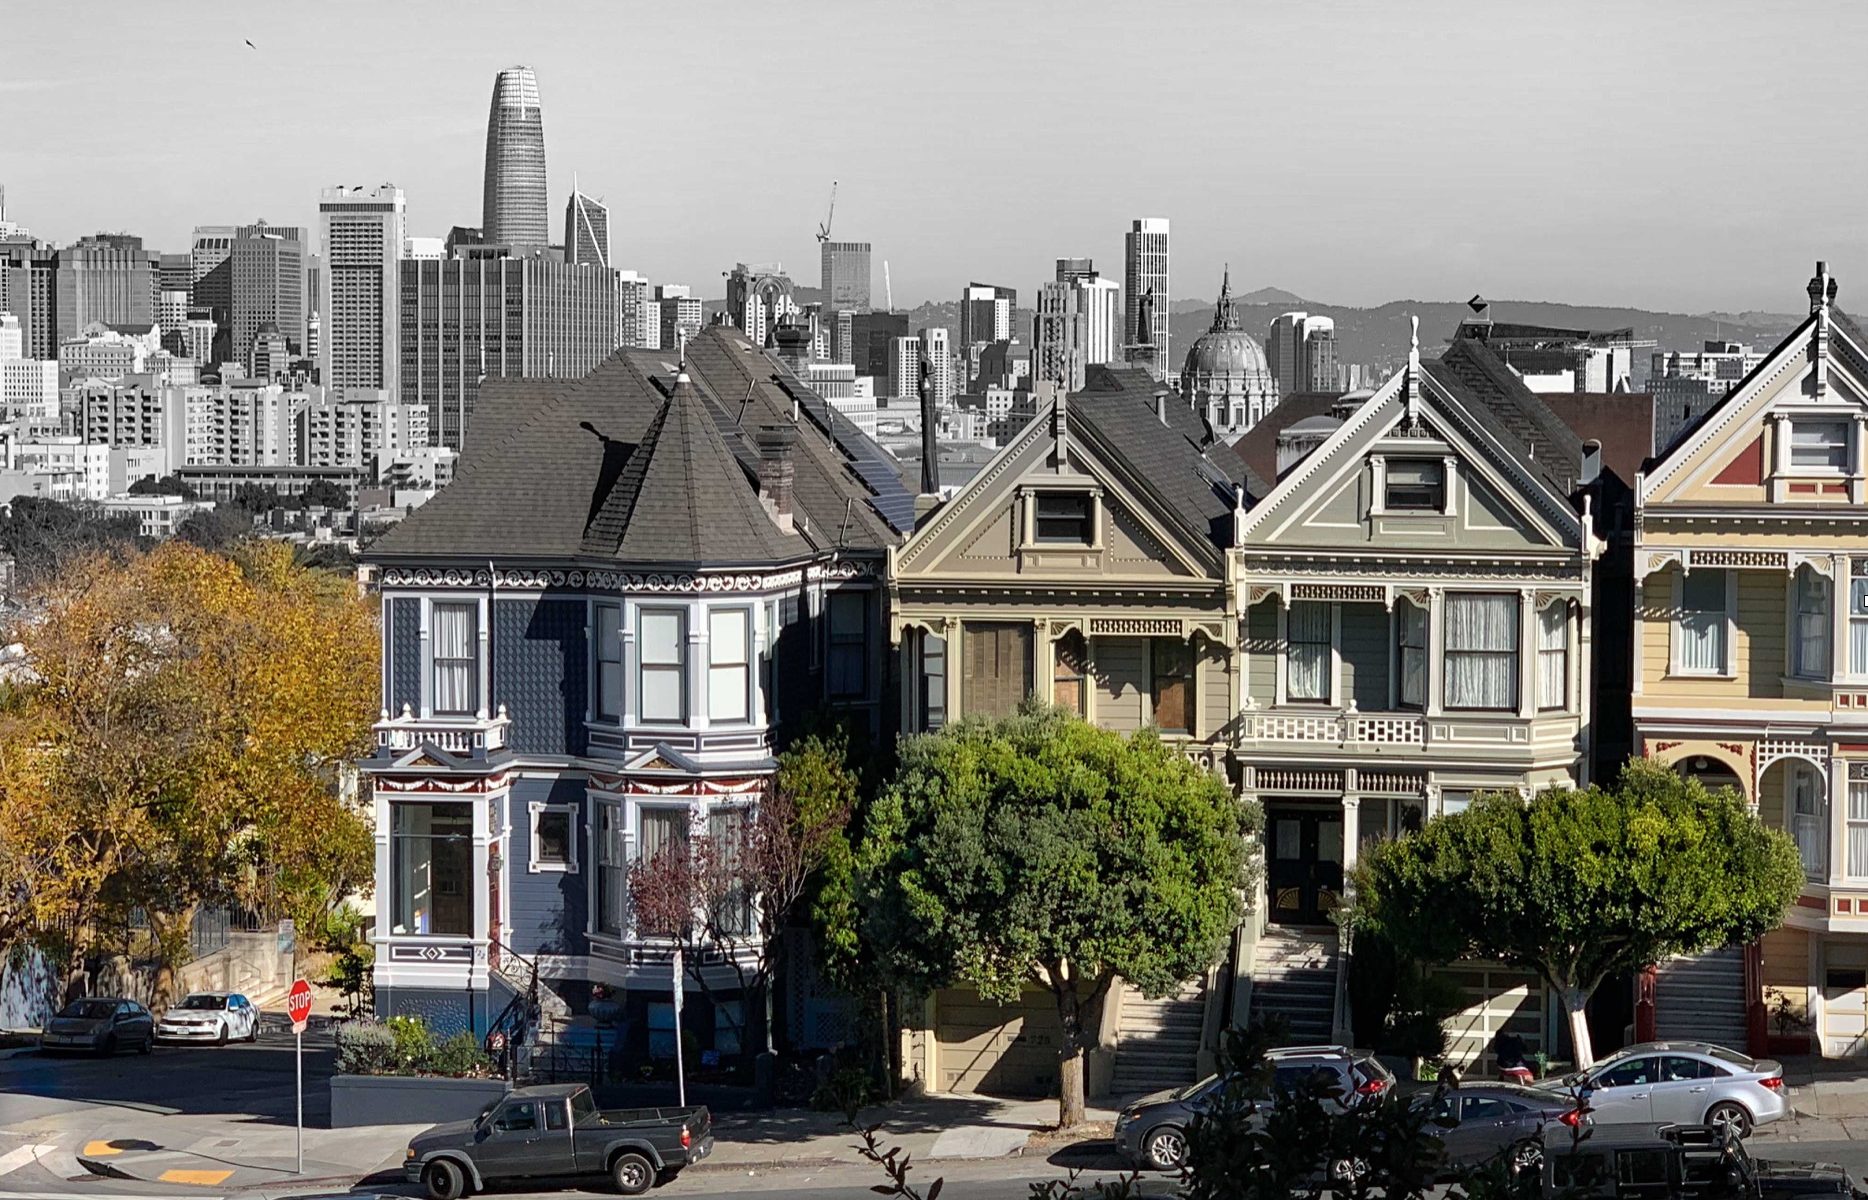
Despite our current challenges, I absolutely believe that San Francisco is better-positioned than most places in the world to weather and ultimately recover from this pandemic, both physically and economically. All of the things that make this a great place to live and work remain in place.

Meanwhile, I am doing lots of walking (Luna is grateful!) and discovering hidden places I never knew about, despite many decades of living here.  One recent discovery:  Tank Hill and Pemberton Lane Stairs, just below Twin Peaks.  You can read more about them here. 

Stay safe, everyone.  As always, your questions, comments and referrals are much appreciated!

Misha

The 2019 Residential Real Estate Wrap-Up

Hello All, and Happy New Decade. Thank you for all the positive feedback I’ve gotten over the last year for my newsletter. It’s a labor of love and it’s nice to know it’s appreciated. I encourage everyone to post comments right on my website to keep the conversation going, but if that’s too much trouble, just email me.

Our Chief Market Analyst, Patrick Carlisle, has done a fabulous job summarizing all the data for 2019 in a set of charts that really speak for themselves, so this month I’m simply going to repost his report without further commentary. Do note, however, that I have additional charts available for any MLS District you’re interested in, so if it’s not one of the three covered in his report, just let me know and I’ll send it to you.

All the best,

Misha

– – – – – – – – – – – – – – – – – – – – – – – – – – –

Generally speaking, after years of high appreciation rates, annual 2019 Bay Area median home prices went down a little bit, went up a little bit or basically remained unchanged as compared to 2018. SF hit new quarterly price highs in spring of 2019 (amid all the IPO excitement), but ended up the year at about flat for houses and a little up for condos. (Since there has been so much new luxury condo construction in recent years, year-over-year median price comparisons may not be exactly apples to apples.)

For 2020, economist Ken Rosen at UC Berkeley has said he expects the Bay Area median price to remain basically flat, within a general range of up or down 2% – in other words, similar to what happened last year. We can’t predict the future, but that certainly doesn’t sound unreasonable, and happily avoids the sensationalism of many other media-grabbing forecasts.

One of the big factors in SF house price appreciation since 2012 has been that fewer house owners are selling (dark green portion of chart below). If demand increases, but supply drops, that puts upward pressure on prices. Overall, house prices have out-appreciated condos over the past 7 years due to 2 factors: All the new condo construction and the fact that condo owners sell their homes more often than house owners. Both those factors increase supply to help meet increased demand.

San Francisco Home Prices by Neighborhood

Below are just two of the tables in our much longer analysis of home prices by property type and bedroom count for every neighborhood in the city. If you’d like the complete report, contact your Compass agent.

San Francisco Luxury Home
Markets by District

Economic Factors Affecting
Real Estate Markets

Homeless in the Bay Area – An Update

After a disconcertingly long and warm Autumn, the weather has finally turned cold and wet.  While we were warm and dry, enjoying the inevitable surfeit of organic heirloom turkey, or more “woke” foods, the Bay Area’s homeless were merely trying to survive.

Two Thanksgivings ago, when I last published a newsletter on this subject, the estimated homeless population in San Francisco was 6,858 based on the “point in time” (PIT) count that San Francisco and other cities are required by the federal Housing and Urban Development Agency (HUD) to conduct biennially.  For 2019, the count is 8,011 – an increase of 17%.  (The charts below is taken from the City’s executive summary).

But the fact is that “counting” the homeless is by its nature imprecise.  The actual number could be double the PIT count.  According to a recent New York Times article, 17,595 homeless people were treated by the City’s Department of Health and Human Services (HSH) this year.  That represents a 30% increase over 2018. 

64% of the Homeless are Unsheltered

Digging into the numbers reveals more misery.  Under the PIT report, fully 64% of the homeless are “unsheltered,” meaning they are living on the streets.  That number hasn’t budged since 2015.  (It was about 61% in 2013). 

As you drive past the tent encampments below the Central Freeway, it’s easy to assume that the majority of homeless are young, male, and either drug addicted or mentally ill.  Indeed, as the chart above confirms 59% are male, and many do suffer from alcohol and drug use and psychiatric and emotional conditions once they’re on the streets (see chart below).

However, the primary cause for people becoming homeless in the first place is not drug and alcohol abuse but loss of a job.  Drug and alcohol use are a distant second.  Twenty-five percent cite eviction or an argument with a friend or family member as the primary reason for their being homeless.

50% of Single Adults are Aged 50 or More

Nor is homelessness primarily a scourge of the young, who, many seem to think, if not to say, can simply “go and get a job.” I recently attended a presentation by Dr. Joshua Bamberger, a physician and professor at UCSF and an expert in homelessness.  He cites studies that show that the homeless population is aging both in San Francisco and nationwide.  Today, 50% of San Francisco’s homeless population of single adults is aged 50 or more.  In 1990, only 11% were.  And 44% of the homeless suffered their first episode of homelessness for the first time after age 50.

40% Cite Loss of a Job or an Eviction as the Primary Cause

When you consider that nearly 40% of the homeless cite loss of a job or an eviction as the primary cause of their homelessness, it’s perhaps less surprising that so many are over 50.  It’s tougher to get a job when you’re older and if you’re evicted from a place you’ve been living in for a long time, you’re less likely to be able to afford a market rental rate in a place like San Francisco.

What’s more, many of the homeless started off life at a disadvantage. 28% of homeless youths under 25 had experienced foster care.

Taken together, these statistics give the lie to the idea that homelessness is a matter of choice; that the homeless are loafers taking advantage of the system.  Rather, they suggest that homelessness is usually the end result of a rough start in life, a sudden job loss or eviction, addiction, or a constellation of all of these.

70% Lived in SF When They Became Homeless; 56% Lived in their County for 10+ Years.

Another misconception is that San Francisco is a “magnet” for the homeless.  70% of the homeless were living in San Francisco at the time they became homeless.  According to the Bay Area Economic Council’s comprehensive Report on Homelessness, “the Bay Area’s homeless population is mostly comprised of long-time residents: 56 percent have lived in their county for 10 or more years, and the vast majority (89 percent) have lived in their current county for more than one year.”  The report’s conclusion is striking:   “Given this information, the region’s crisis is one of its own making, and not a product of the migration of homeless individuals from other states or regions.”

Other takeaways from the Report:

  • The Bay Area’s homeless population is the third largest in the nation, behind only New York and Los Angeles.
  • The Bay Area shelters a smaller percentage of its homeless (33%) than any other metropolitan area other than Los Angeles, making the crisis highly visible.

The Report’s sobering summary:

“The Bay Area’s chronic housing shortage especially at extremely low-income levels, limited growth in wages at the bottom of the income spectrum, an insufficient inventory of short-term shelters and permanent supportive housing, and too few resources for mental health and addiction services, each played a role in leading up to the current crisis.”

As to proposed solutions, that would require at least another newsletter to discuss.  In the meantime, I highly recommend reading the Bay Area Economic Council’s Report.

As someone who works in and profits from an industry that serves people who can afford to buy homes in a city where the average price of a home is around $1.6 million, I feel it’s my responsibility to “give back” where I can.  Volunteering to make dinners at Geary House, a transitional housing facility, run by Larkin Youth Services, is one way I’ve been able to get directly involved; I’m also looking for opportunities to get involved in the governance of non-profits serving the homeless.  My hope is that my occasional  newsletters on this topic will, in some small way, help keep my friends, clients, and readers from becoming inured to the real human suffering that we see each day on our streets.

As always, your questions, comments and referrals are much appreciated.

Misha

_______________________________

List of References:

HUD Point in Time Count Definition

2019 San Francisco Homeless Count and Executive Summary

2019 San Francisco Homeless Count  and Survey – Comprehensive Report

Bay Area Economic Council Report:  Bay Area Homelessness – A Regional View of a Regional Problem

My thanks to Joshua Bamberger, MD, MPH, Professor, Family and Community Medicine, UCSF

Associate Director, UCSF Benioff Homelessness and Housing Initiative, for use of UCSF slide and information on the aging of the homeless population.

Real Estate and Tax Law 101

Recently, several of my clients have asked for a quick rundown of various real estate and tax-related laws.  Here are some of the key laws any current or future home-owner should be aware of.  Note: the laws are complex.  This is intended to provide a starting point only.  Consult with your own attorney or tax advisor, or contact me for a referral.

1.  Home Mortgage Interest Deduction. 

You can deduct home mortgage interest on the first $750,000 ($375,000 if married filing separately) of indebtedness. However, higher limitations ($1 million ($500,000 if married filing separately)) apply if you are deducting mortgage interest from indebtedness incurred before December 16, 2017.  See IRS Pub 936.

2.  Excluding Tax on Capital Gain from the Sale of Your Home. 

If you have a capital gain from the sale of your home, you may be able to exclude up to $500,000 of that gain from your income if you are married and filing jointly (or $250,000 if an individual), provided that you have owned and lived in the home as your principal residence for an aggregate of at least two out of the five years before the sale.  There’s no limit on the number of times you can use this exclusion, provided that you meet the 2 year ownership and use minimums.

“Capital gain” is the home’s selling price minus deductible selling costs and minus your “tax basis” in the property.  Your “tax basis” is what you paid for the property plus some of the costs of acquiring it, plus major improvement costs you’ve incurred during your ownership, so it’s worth keeping track of them.  The best explanation I’ve found for this tax deduction is at Nolo Press’s excellent website, here. You can also take a look at the IRS’s info pamphlet here.

3. One-Time Right to Transfer your Property Tax Assessment:  Props 60 and 90.

Empty-nesters and other long-time home-owners often think about selling their home and “downsizing” so that they can simplify their lives, live closer to family, or untap the home’s increase in value for other purposes (see “Excluding Tax on Capital Gain” above). What can stop them is that they may end up paying far more in annual property tax assessments on the new home, even if it is a more modest home than their current one.  (For an explanation, see my August 2017 newsletter.)

California Proposition 60 gives homeowners 55 or older a one-time right to transfer the property tax assessment on their existing primary residence to a new one purchased for no more than the adjusted sale price of their previous one, provided both homes are located in the same county, and provided it is purchased within two years of the prior residence.

California Proposition 90 allows qualifying homeowners to transfer their property tax assessment to new homes located within eleven counties that have agreed to reciprocal transfer rights.  In the Bay Area, only San Mateo, Alameda, and Santa Clara participate, so San Francisco homeowners looking to move elsewhere are out of luck.  California Proposition 5, which appeared on the ballot in 2018, would have made property taxes transferable anywhere in the state.  It was voted down resoundingly.

4. New State-Wide Rent Control Law (AB 1482).  Effective January 1, 2020, this new law will cap rental increases to 5% plus inflation annually.  The law applies to buildings that are 15 years or older.  Most single-family homes and condominiums are excluded unless they are owned by a corporate-type entity.   

The law does not supersede more restrictive local rent control laws.  So, in San Francisco the local Rent Ordinance will continue to govern.  However, the new law will affect newer apartments with certificates of occupancy dated earlier than 2005; previously, apartments constructed after June 13, 1979 were largely exempt. 

Generally, landlords are free to raise rents to whatever they want after a tenant vacates a unit.

The new ordinance – and especially its interaction with existing San Francisco Rent Control laws – is complicated.  If you are thinking about purchasing rental income property or renting out property you already own, I urge you to consult with a qualified attorney (call or email me for a referral.). In the meantime, you can find more information from a local law firm here.

5.  Community Opportunity to Purchase Act (“COPA”).

“COPA” is a new SF law that requires owners of buildings with three or more residential units to give a right of first offer and a right of first refusal to a designated set of non-profits before they can sell their building to a third party.  I wrote about this new legislation recently.  You can read the details here.

As always, your comments, questions, and referrals are much appreciated!

Misha

San Francisco Real Estate: Doom and Gloom or Vroom and Boom?

Driving with one eye on the rear-view mirror is a good thing.  Driving with both eyes on it is likely to get you into a crash.

At a recent sales meeting where 40 or so agents discussed their impressions of the autumn sales market which opened on Labor Day, quite a few bemoaned the lack of agents showing up on brokers’ tour on Tuesdays and Wednesdays.  Others said that they’d had Sunday open houses with nary a visitor.  Agent and client fatigue?  The “flood” of new listings on the market (though that’s typical for this time of year)? An ominous sign of things to come? 

Another agent got up and spoke about how over 100 people had showed up at her Sunday open house in the Outer Sunset.  Someone else talked about the 1,500 square foot condo that went into contract at 30% over list price.  Another mused that maybe the market was diverging for properties below $2 million (strong) and those above $2 million (weakening).

A recent article in the SF Examiner quoted data produced by our own Chief Market Analyst Patrick Carlisle and concluded that, right now, it’s anybody’s guess which way the market is headed.  The metrics are pointing every which-way. I liked the closing quote, which reflects what I’ve told my clients for years:

If your aim is to keep living where you’ve been living, if you’ve been sitting on a property for more than 10 years or if you plan to buy a house and hang onto it for awhile, all of this should be white noise to you.

What makes predicting where the market is headed so difficult is that all our data points backwards to where we’ve been, not where we’re going.  September’s sales numbers reflect contracts that were entered into 20 to 40 days previous, on properties that might have hit the market 10 to 30 days before that, thus reflecting a summer market whose own dynamics are different and usually slower than the autumn “big-surge-before-winter-shuts-everything down” market we are in today.  If you think there’s any reliable leading indicator for what’s going to happen, please – please! – let me know.

Here are some selected charts from Patrick’s most recent newsletter (email me if you want the full version), starting with a snapshot of Q3 compared to the last three years.

Prices for single family homes eked out a 1.8% gain year-over-year.  That still leaves home prices up 16% from Q3 2017.  Meanwhile condos are up a healthy 7.6% over last year, but up “merely” 11% from Q3 2017.

If there are any warning signs here it may be that both the number of sales and the percentage of listings sold are stalling.  Is this the buyer and agent fatigue that agents mentioned in our sales meeting?  Remember, the chart above shows what happened July – September, whereas discussions at our recent sales meeting reflect current sentiment.  If that sentiment shows up in this quarter’s numbers too, then maybe – just maybe – we are looking at a slowing market.

Here’s another chart that suggests a bit of a plateau in home prices – but only because we’re used to a stream of double-digit gains.

Price reductions, however, which can obviously indicate a slowing market, do not seem to be signaling an imminent slowdown; they’re about the same as last year and maybe a tad lower than earlier years.

And “Days on Market,” which signals very directly the “heat” of the market, seems to show a continuing and robust sellers’ market when compared to recent years.

And for what it’s worth, from a global perspective, some analyses suggest that San Francisco may be over-valued but is not in bubble territory.  Here’s a chart from a recent UBS report on global cities (email me if you want a copy of the full report). A recent article in The Economist also concluded. that prices in San Francisco had room to run.

My personal view is – as the 8-ball so wisely says – “Ask again later.”  There’s nothing in these numbers that suggest that we’re heading into the kind of feeding frenzy that the IPO’s of Lyft, Uber and the like were predicted not long ago to ignite.  (I got that one right.) Nor is there evidence that suggests things are going to change dramatically for the worse in the near term. 

That said, if you’re thinking of selling I wouldn’t wait. Despite the (rear-view) numbers, I’d say there’s more downside risk then upside potential ahead. Prepare your home as well as possible for sale (I can help, and Compass Concierge can help pay for the costs upfront) and price it right. Homes that “check the boxes” and are move-in ready continue to sell well.

Conversely, if you’re a buyer, think about focusing on properties that have been on the market for three weeks or more and may not be “perfect.” That’s where you’ll find the values.

As always, your questions, comments and referrals are much appreciated!

Misha


San Francisco’s new “COPA” Law could turn Owners of 3+ Unit Buildings into, um, Sausage

“Coppa” with two “p’s “ is a delicious dried pork salume of Italy and Corsica.  “COPA” is a new SF law that requires owners of buildings with three or more residential units to give a right of first offer and a right of first refusal to a designated set of non-profits before they can sell their building to a third party.  If a seller fails to comply with the statutory requirements, they may well feel that they’ve been through the COPA meat-grinder.  Penalties can include disgorgement of profits and a fine equal to 10% of the sale price they received.

COPA (for “Community Opportunity to Purchase Act”) is intended to aid non-profits that are active in efforts to preserve affordable housing.  The rationale behind the Act appears to be that by providing qualified non-profits a first and second shot at buying a building subject to the Act, more buildings will come under the control of these non-profits who are then required to keep low-rent tenancies in place “in perpetuity.”  However, there’s no requirement that sellers accept below-market rate offers from the non-profits; no additional mechanism for getting more money to the non-profits so that they can compete with market-rate offers; and no proof that a market-rate sale to a private party necessarily results in evictions or rental increases anyway.  Indeed, the City has enacted numerous laws over the decades to make it increasingly hard for owners of multi-tenant buildings to increase rents (for buildings constructed before June 1979) and to permit owner move-in evictions. Buyers are already willing to pay a premium for two-unit buildings because, for the moment at least, they are not subject to San Francisco’s condo conversion moratorium whereas buildings with three or more units are.  This legislation, I suspect, will only increase the delta.  Perhaps that’s the point:  by burdening buildings of three or more units with this additional legislative hurdle to sale, they’re making them more affordable for non-profits to potentially buy. 

That kind of reasoning seems like a stretch to me.  More likely, in my view, this will result in extra fees for attorneys who have to guide sellers of these buildings through a potential minefield.  I have not researched this but I suspect the reason why non-profits are not buying up more buildings to “preserve” low-rental housing is not because they’re not aware of them being for sale but because they simply can’t compete with for-profit buyers.  This legislation does nothing to change that.

Anyone who needs more information should start with the Mayor’s Program Rules, available here.  The next step should be to consult with a qualified real estate attorney.

As always, your questions, comments and referrals are much appreciated!

How Does San Francisco Rank as a Global City?

“Home ownership has dropped, evictions and homelessness have climbed sharply, surging demand for rental units has led to a shortage, and soaring rents are fodder for daily conversation…. In the last few years, [it] has become one of the world’s 10 most expensive places to rent, ahead of cities like Tokyo, Sydney and Singapore.”

San Francisco?  Actually, Dublin, Ireland, according to a Deutsche Bank Report cited in a New York Times article a few days ago. But before you heave a sigh of relief, consider this:  Dublin ranked 8th most expensive city in the world to rent a mid-range 2 bedroom apartment, clocking in at around USD $2,000.  San Francisco came in second – just after Hong Kong and ahead of New York.  The quoted rent for SF: a whopping $3,631, down slightly from 2018.

And yet our currently foggy piece of heaven’s Quality of Life Index still ranks among the Top 10 for major global cities covered by the Report, clocking in at number 9.  The only major U.S. City that does better is Boston, at number 8.  (New York ranks 31.). Topping the global index:  Zurich.


Expensive Bad Habits and No Cheap Dates

The Report extracts its Quality of Life rankings from Numbeo.com, which covers cities large and small all over the world and bases its rankings on a combination of individual indices that include Purchasing Power, Pollution, Safety, and the like.

But the Report also includes its own quirky indexes, like the “Bad Habits Index” (cost of 5 beers and 2 packs of cigarettes), “Cheap Date Index,” and “Men’s Standard Haircut in an Expat Area Index.”  No surprise: San Francisco is expensive under all those metrics.  Surprise: San Francisco doesn’t even make the top 54 for (most expensive) Five Star Hotel Rooms with a View.  That honor goes to Milan, Madrid, and Vienna in that order.  Another surprise:  San Francisco ranks third most expensive under Monthly Internet Service, behind Dubai and Dublin.  Thank you, Silicon Valley!

But Lots of Income

One of the major takeaways of the Report: San Francisco tops the charts for both Monthly Income (after taxes) and Monthly Disposable Income After Rents.  It’s jumped 7 and 21 places, respectively, in just the last 5 years.  So, while it’s expensive to rent here, it seems that incomes have more than kept up the pace – though I can’t think of anyone who feels that way.

Boom or Gloom?

With San Francisco real estate prices recently hitting new highs (see chart below), people often ask me where I see the real estate market going.  That’s particularly true now, with so much volatility in the stock market, not to mention underlying geo-political concerns like Brexit, the trade war with China, and oil supplies coming out of the Straits of Hormuz.

Alas, I have no crystal ball.  But our global ranking is a good part of the reason why I feel bullish about San Francisco in the long-term.  We are a global city, blessed by a thriving and diversified economy; an educated work-force; stunning scenery; and a decent climate (except right now!).  While we aren’t immune from economic downturns, there’s every reason to expect that people will continue to want to live and work here – despite the expense and challenges – for the foreseeable future.

As always, your questions, comments and referrals are much appreciated!

Signs of a Slowdown? The Economist Doesn’t Think So.

The chart below appeared recently in The Economist along with an article describing a new prediction model that they’re trying out (you’ll have to have a paid subscription to see the article). They point out that globally, in most countries, homes have made back most of their losses sustained in the Great Recession. That’s true of the U.S.

Nor are they predicting a major correction during the next year or so. Their conclusion: “The most likely scenario is that the rally has room left to run.”

Here’s the news locally in San Francisco according to our latest market report (text or email me for a complete copy): “High stock markets, low interest rates, surging luxury home sales, limited inventory, a spring full of unicorn IPOs, and San Francisco – once again – hits new highs in median home sales prices.” The median house sales price was $1.7 million in Q2 2019.

At the same time rates of appreciation have stuttered a bit in recent quarters. Whether this is because we are reaching a “top” or whether these backward-looking statistics are simply reflecting the hangover from the stock market turmoil that occurred in Fall 2018 is anyone’s guess. Stay tuned.