San Francisco Luxury Home Market

San Francisco Luxury Home Sales & Prices
Continue to Climb Past Previous Peaks

July 2014 Update by Paragon Real Estate Group
With 7 Custom Charts & Tables

The luxury segment of San Francisco’s real estate market was the last to peak, in 2008, while most other housing segments started to lose steam in 2006-2007. After the financial markets crash in September 2008, the city’s high-end home market generally lost the least value on a percentage basis, 15-20%, as compared to the 20-60% drops seen elsewhere. Then it was the first to recover in late 2011/early 2012. Now, SF luxury home values have accelerated well past the previous peak values of 6 years ago. The factors include the increasing strength of the Bay Area economy; the huge, local surge in high-tech and affiliated wealth; an increase in well-heeled foreign buyers; and the fact that the highly affluent have, by far, profited most from the recent, tremendous appreciation in stocks and other financial assets.

The net result: There is an enormous amount of new and old money sloshing around the Bay Area looking for beautiful homes to buy, many of which are being purchased all-cash.

Luxury homes in San Francisco are typically defined as condos, co-ops and TICs selling for $1,500,000 and above, and houses selling for $2,000,000 or more. These are relatively arbitrary thresholds since $2,000,000 might buy a small-ish, fixer-upper house in Pacific Heights or a large, gracious home in another neighborhood. It is also true that the significant appreciation since 2011 has simply moved more sales into the “luxury” price category, which at current trends will soon require reassessment.

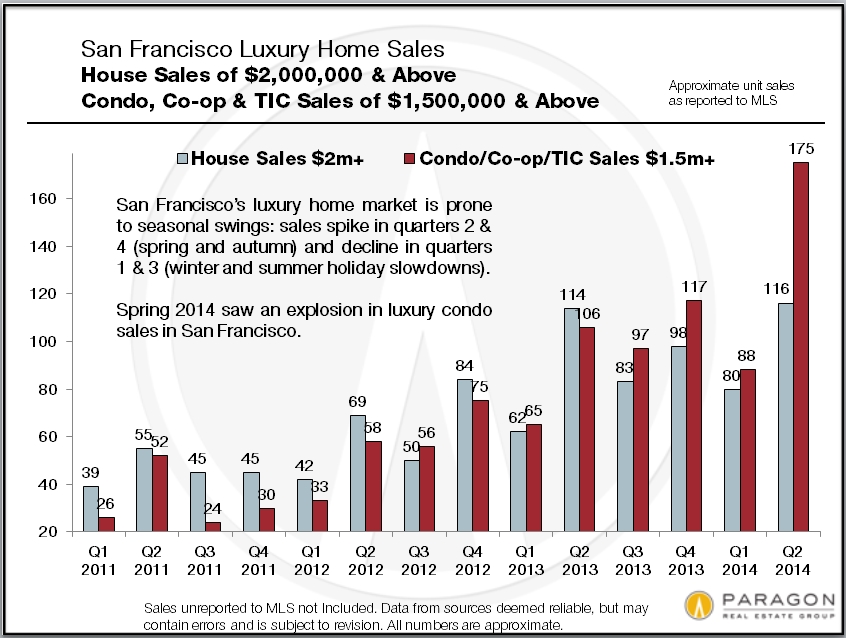
San Francisco Luxury Home Sales by Quarter

The number of SF luxury home sales in the 2nd quarter of 2014 was more than twice the number sold in the 2nd quarters of 2007 or 2008 before the market crash. Luxury condo sales in particular are skyrocketing.

LuxHome_Unit_Sales_by_Qtr

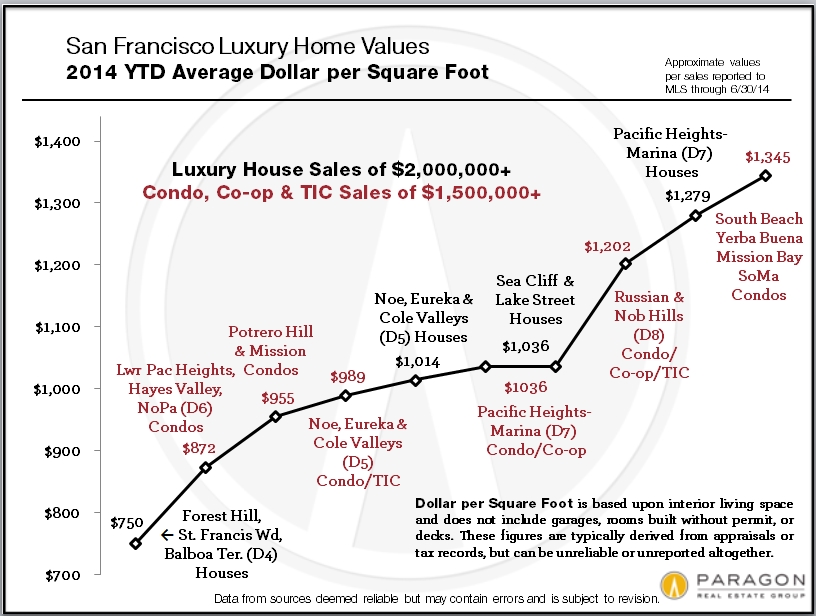
Average Dollar per Square Foot Values 
for San Francisco Luxury Homes

Average dollar per square foot is a very general statistic, but this chart gives an idea of the extraordinary values now being achieved by San Francisco luxury properties in different neighborhoods of the city. These are just averages: Some homes are selling far beyond the values seen here, including a few over $2000 per square foot.

LuxHome_AvgDolSqFt_by-Neighborhood

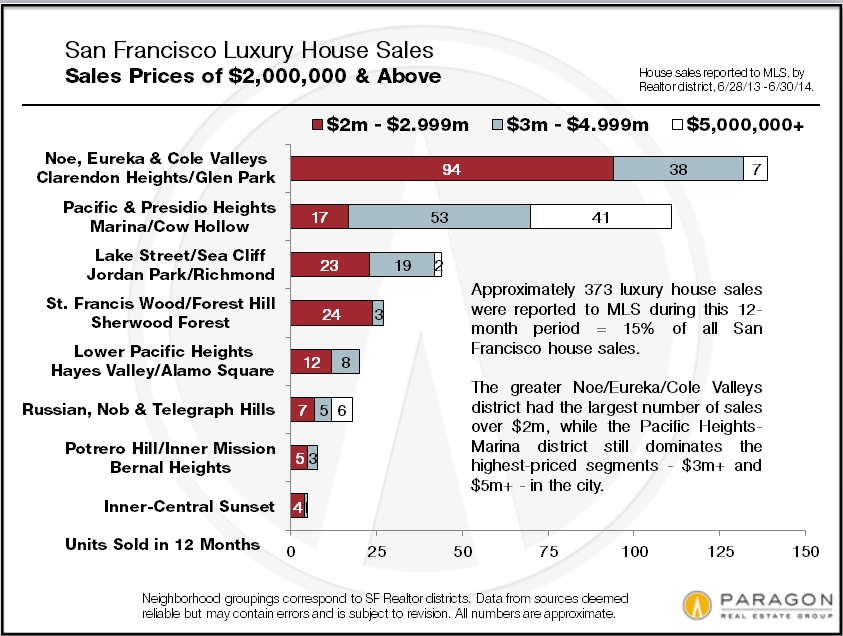
San Francisco High-End Home Sales by Neighborhood

Luxury house sales in San Francisco are dominated by the swath of established, prestige, northern neighborhoods running from Sea Cliff and Lake Street through Pacific & Presidio Heights and Cow Hollow; by the greater Noe-Eureka-Cole Valleys district (which has seen explosive growth in this market segment since the mid-nineties); and, to a lesser extent, the smaller neighborhoods around St. Francis Wood and Forest Hill.

Lux-SFD_Sales_2m-plus

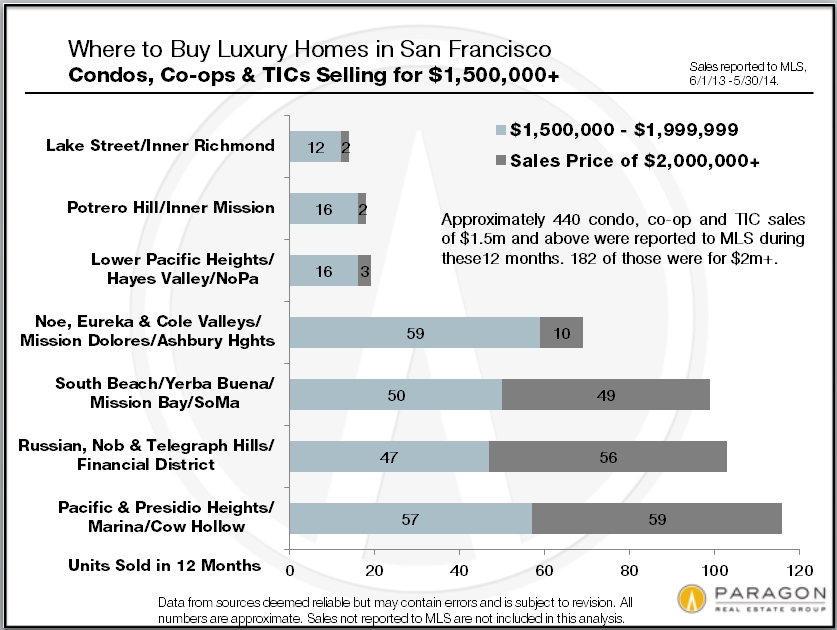
High-end condo sales have now overtaken luxury house sales in the city because of all the new-condo construction which occurred over the past 10-15 years – and this building boom, which lapsed in the 4 years after the 2008 market crash, is accelerating once again. (Very few new houses are built in SF anymore, though those few are typically quite expensive.) Besides the older Pacific Heights-Marina and Russian & Nob Hills districts, and the greater Noe-Eureka Valleys district, the newer neighborhoods of South Beach, Yerba Buena and Mission Bay have a rapidly growing footprint in luxury condo sales. And just very recently, high-priced, high-tech, condo buildings are being constructed in areas such as the Mission, Hayes Valley, and the Market Street and Van Ness corridors that were not previously considered luxury-home locations.

Condo-Sales_1500k-plus

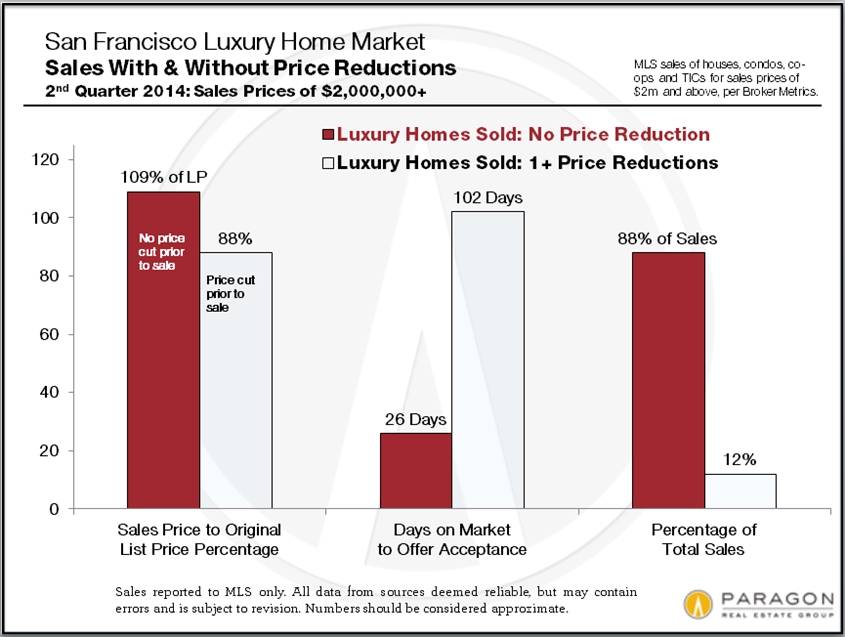
Luxury Home Sales With & Without Price Reductions: 

Sales Price to Original List Price Percentage & Average Days on Market

For the sake of simplicity, this chart looks at all SF home sales of $2,000,000 and above in the 2nd quarter of 2014. The 88% of these listings that sold without price reductions averaged a sales price 9% over asking price, with a very low average days-on-market of 26 days. These statistics are an indication of a very high-demand market. Still, not every home sold quickly: Listings that were price reduced averaged a sales price 12% below original price and spent 2.5 months longer on the market. And then a fair number of listings expired without selling, typically due to being perceived as overpriced: Even in a red hot market, one can overprice one’s home – and doing so will severely impact the market response.

Lux_Homes_SP-OP_DOM_by_Price_Reduct

House Values in San Francisco’s Prestige Northern Neighborhoods

This table includes neighborhoods of varying home values, but still gives a fair representation of high-end home-price trends over the past 20 years. Average sales prices and dollar per square foot values have blown past their previous peaks of 2007-2008.

Prestige_SFD_Avgs_Numbers

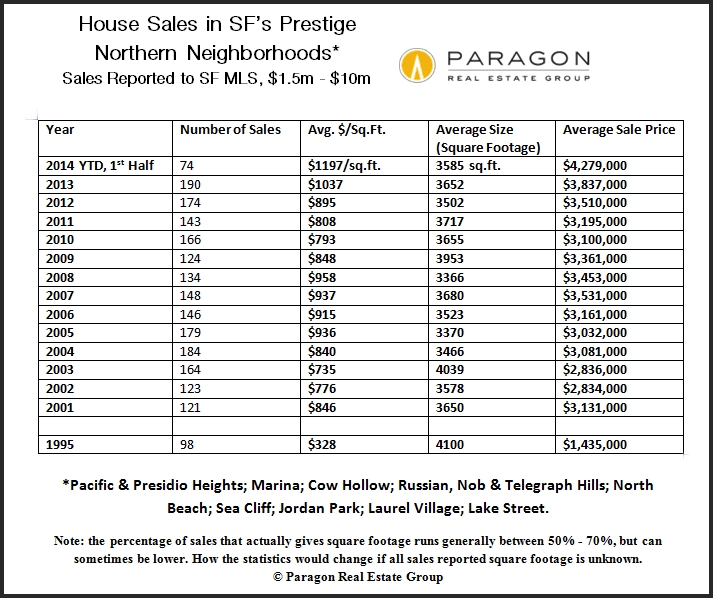
As mentioned before, other neighborhoods besides the “Prestige Northern Neighborhoods” now feature significant luxury home markets. More details on those districts can be found in the Neighborhood Values section of our website.

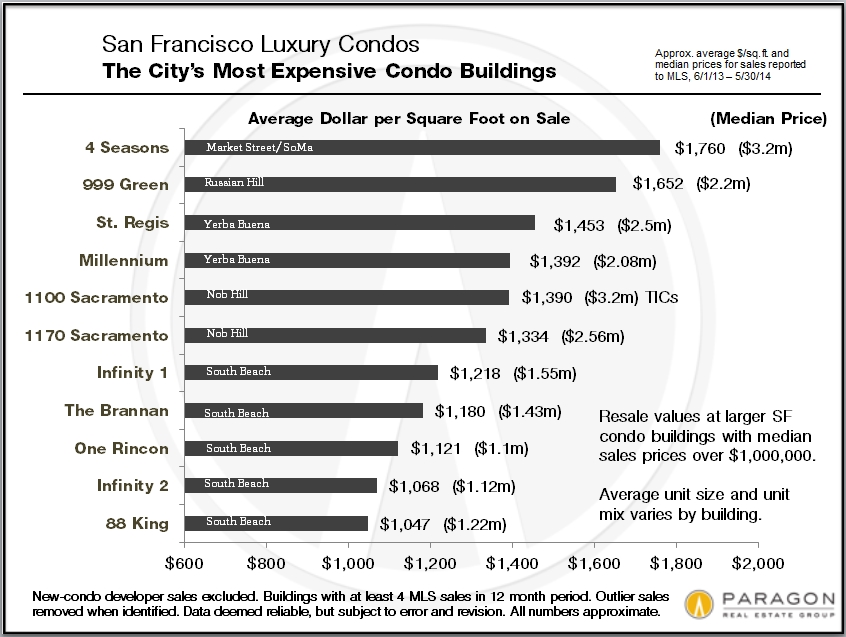
San Francisco’s Most Expensive Condo Buildings

Here one can see the impact of newer, luxury high-rise buildings such as the 4 Seasons, the Millennium and the Infinity Towers, all located in the greater South Beach-Yerba Buena area. However, this list ranks only the largest condo buildings and since many of the condos in the older neighborhoods are in much smaller buildings, they won’t show up here even though they have extremely high values as well. Besides location, premium services and expensive amenities, probably the most common element of luxury condos in San Francisco is spectacular views, which can add hundreds of thousands or even millions of dollars to the sales price. (The city’s most expensive condo sale ever – a penthouse at the St. Regis – closed for $28m in 2011.)

Condos_Most-Expensive-Buildings

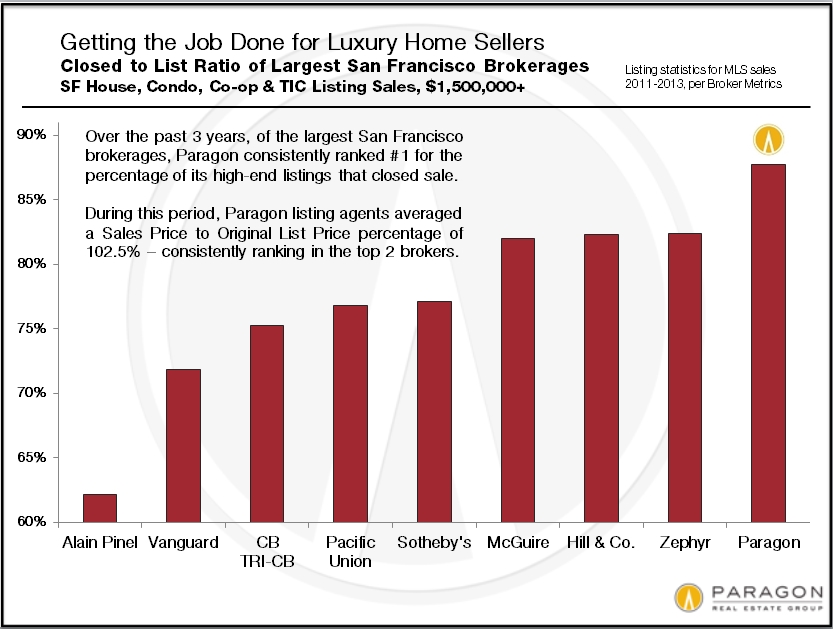
Paragon is one of the top 4 brokerages in San Francisco for luxury home sales 
and has the highest Closed-to-List ratio of any of the city’s major luxury property firms.
 

LuxHome_Closed-to-List_Ratios_by-Broker

For your convenience, below is a map of San Francisco neighborhoods.

San_Francisco_Neighborhood_Map

New Case-Shiller report: new jump in Bay Area home prices

The new S&P Case-Shiller Home Price Index for April 2014 came out today and it showed another bump in home prices for the 5-county San Francisco Metro Statistical Area. For homes in the upper tier of home values – as most of San Francisco’s are – prices are up approximately 17% in the past 12 months and up 41% since the recovery began in early 2012. 

Based upon what we are seeing on the ground in the market, we expect another bump in the May Index, which will come out at the end of July.

image001 image002 image004

Bay Area Home Purchase vs. S&P 500

Return on Investment: 1994 – 2014

May 2014 Report

We recently put together an analysis comparing the comparative investment returns of buying a San Francisco Bay Area house, gold, Apple stock, an S&P 500 Index fund or putting money into a bank CD in January 2012 (Of Real Estate, Gold & Apple Stock). Not unreasonably, the issue arose regarding returns over a longer term. Now, whatever time period is used will always be fundamentally arbitrary, and different periods will often generate dramatically different results. Twenty years is a round number, which allows a nice mix of recessions, bubbles, crashes and recoveries to be encompassed within our inquiry.

Stock and home purchases cannot really be compared apples to apples: This is a simplified, good faith illustration pertaining to the investment of $100,000 in January 1994. February 2014 was chosen as the home sale date because that is the last published Case-Shiller Index (as of 5/20/14). Home prices in San Francisco have actually surged yet again in the past few months, but this is not reflected below. April 2014 was chosen for the stock sale date because that was last published update for the DQYDJ S&P 500 calculator.

S&P 500 Index Investment, 1994 – 2014

In hindsight, 1994 was an excellent time to put money into the stock market.
If hindsight investing was viable, we would all be rich as Russian oligarchs.

Invest-ROI_S&P-500_20years

Bay Area Home Purchase, Buy in 1994, Sell in 2014

1994 was an even better time to purchase a San Francisco Bay Area home.

Invest-ROI_Home_20years

Return on Cash Investment: S&P 500 vs. Bay Area Home

Certain benefits to U.S. homeownership boost return on investment over stock market.

Invest-ROI_S&P-vs-Home_20years

Including dividend reinvestment, the S&P 500 appreciated approximately 9% per year for a total of 473% over the 20 year period. (If account and transaction fees were deducted, the return would be somewhat reduced.)

Bay Area home prices appreciated much less than the S&P 500 during this period, approximately 5.5% per year for a total of 189%, but the return on cash down-payment investment would be approximately 733%, significantly out-performing stocks. This difference increases when taxes on gain are included in the equation.

Note: Adjusting for inflation, investment returns would be about 2.5% lower per year (the approximate, average inflation rate over the past 20 years). Both stocks and home investments significantly outpaced inflation.

Financial Advantages Peculiar to American Homeownership

1) Leverage: 189% appreciation of a $500,000 home = over 900% appreciation, before closing costs, of the $100,000 down-payment. If one pays all cash this advantage disappears, but one’s monthly cost of housing plunges (though probably not close to making up for losing the supercharging that leverage adds to investing).

2) Long-term, fixed-rate home loans: Which substantially lock in monthly housing costs (while other costs, such as rents, continue to increase) and can be refinanced at opportune times. When one can get a 30-year mortgage at what is, historically speaking, an extremely low interest rate, it makes an enormous difference in total interest expense and monthly housing costs. As an example, in 1994, the average 30-year rate was 8.4%; now, in mid-May 2014, it’s 4.2%, (in 2013, it dipped to below 3.5%) i.e. today’s million dollar loan charges the same interest as 1994′s $500,000 loan.

3) Multiple homeownership tax deductions: Such as the mortgage interest deduction, which effectively subsidize monthly housing costs. (Consult with a qualified accountant regarding your own tax situation.) These deductions, along with low interest rates and ongoing principal repayment of the loan, generally make net monthly homeownership costs comparable to and often less than the cost of renting the same home. (Rent vs. Buy Calculator)

4) The huge, capital-gains exclusion on the sale of a primary residence: $250,000 for singles/ $500,000 for couples. It’s a rare investment that allows you to walk away with large, untaxed profits. For a couple selling their home in the above investment scenario, it means an extra $75,000.

It’s worth noting that advantages 2, 3 & 4 above are not found in most other countries, and indeed some of them remain issues of political contention in our country as well.

Homeownership as Investment & Homeownership as Housing

In this analysis, home-ownership is divided into two distinct financial spheres: 1) the investment return on the $100,000 down payment: you put in $100k cash and upon sale, you receive a certain amount of cash proceeds back. And 2) the cost of living in the home you purchase, i.e. the monthly net homeownership cost (principal, interest, taxes, insurance and maintenance, after tax deductions and principal pay-down), which is minimally assumed to be, over the course of time, comparable to the cost of renting.

Upon purchase in 1994, with interest rates at over 8%, the net homeownership cost probably exceeded the cost of renting by a good margin. But interest rates then started to decline: to under 6%; then under 5%; and in 2013, to under 3.5%. As of mid-May 2014, it is 4.2%. Refinancing at selected times over the 20 year period would have dropped net monthly homeownership costs substantially, while San Francisco rents over the same period have soared to historic highs. Ultimately, the monthly cost of owning would be far below – probably more than 50% below – the market rental rate for the same home.

The cost of housing issue is not figured into the return on investment scenario, because the equation simply gets too complicated. This is one of the ways in which comparing homes to stocks is not an apples to apples comparison.

Asset Building One Loan Payment at a Time

This analysis does not adjust proceeds of home sale for the reduction of outstanding loan balance over the 20 years, i.e. of the original $400,000 loan, only $153,000 remains due and payable upon sale. If this was done, then cash after-tax proceeds of sale would be almost $250,000 higher.

Homeownership over time — especially longer periods of time — not only typically delivers a good return on investment, but as long as one doesn’t refinance out increasing home equity to buy yachts or finance a child going to college, it acts as a lay-away savings account that grows each month as your loan payment reduces the principal loan amount due. In earlier generations, this was a classic strategy: buy a home, live in it for 30 years, retire, and then either live in it at a very low cost, since there is no longer a mortgage payment, or sell it and recoup not only appreciation but the initial purchase loan amount which has turned into home equity. Many of us are not that good at saving: Mortgage repayment can act as a “forced” savings account to be tapped far in the future, such as upon retirement.

If you want to read even more analysis regarding leverage, inflation and home equity, please see our October 2013 article: Home-Buying as Investment

Real estate markets, like other financial markets, typically move in cycles:
Where you buy and sell within these cycles can dramatically affect the outcome.
 

New Case Shiller Index

The new February S&P Case-Shiller Index for high-price-tier homes in the 5-county San Francisco Metro Area increased almost 1% from the January reading. This puts the Index up about 20% over the past 12 months, and up about 34% since the recovery began in earnest in early 2012. Based upon what we are seeing in the market, I expect another increase in the March Index. (The Case-Shiller Index is published 2 months after the month specified.)

Case-Shiller_High-Tier_2011


Case-Shiller_from_1990

New Case-Shiller report: SF Metro Area bumps up again

While the nation as a whole saw a tiny decrease in the S&P Case-Shiller Home Price index in the January report released today, the San Francisco Metro Area Index (for 5 northern counties) bumped up again. The C-S Index for higher priced houses has now completely re-attained the previous market peak set in 2006, as measured by January data points. The city of San Francisco itself has exceeded the rise in the 5-county area and has generally surpassed previous peak values – many SF neighborhoods by substantial margins.

Based upon what we are seeing on the ground, we expect to see further increases once the late winter/early spring selling season is reflected in the Index.

This first chart shows market cycles over the past 30 plus years. The second chart shows appreciation since our current market recovery began.

image001

This chart tracks the most recent market recovery which began in earnest in early 2012. In both 2012 and 2013, the spring seasons saw substantial jumps in home values. We recently thought the likelihood of yet another significant jump in 2014 to be relatively low, but the market we’re seeing on the ground – a very high demand/very low supply dynamic – is leading us to suspect otherwise.

image002

Case-Shiller measures a 5-county metro area comprised of San Francisco, San Mateo, Marin, Alameda and Contra Costa counties. The numbers used relate to a January 2000 value of 100; thus 184 signifies 84% home price appreciation over the past 14 years. The Index is published 2 months after the latest monthly reading, i.e. the January Index has just been published today, March 25th.

The full report can be found online here.

September Case-Shiller Index Released

The Case-Shiller Index for the San Francisco Metro Area covers the house markets of 5 Bay Area counties, divided into 3 price tiers, each constituting one third of unit sales. Most of the city of San Francisco’s house sales are in the “high price tier.” The Index is published 2 months after the month in question and reflects a 3-month rolling average. September’s Index was just released today, November 26th.

This first chart illustrates the price recovery of the Bay Area high-price-tier home market which really got under way in 2012. In both 2012 and 2013, home prices surged in the spring and then plateaued in the summer-autumn. The surge in prices that occurred in spring of 2013 was particularly dramatic, reflecting a frenzied market of huge buyer demand, historically low interest rates, increasing consumer confidence and extremely low inventory. In San Francisco itself, it was further exacerbated by the high-tech-fueled explosion of new wealth. The market has since calmed down somewhat and that cooling is reflected in the Index readings of the past three months (through September).

Case-Shiller Index numbers all reflect home prices as compared to the home price of January 2000, which has been designated with a value of 100. Thus, a reading of 180 signifies home prices 80% above those of January 2000.

1

This second chart reflects what has occurred since 1996 showing the cycle of recession, recovery, bubble and decline/recession.

2

This third chart compares the 3 different price tiers since 2000. The low-price-tier’s bubble was much more inflated by the subprime lending fiasco – an absurd 176% appreciation over 6 years – which led to a greater crash than the other two price tiers. All 3 tiers have been undergoing dramatic recoveries, but because the bubbles of the low and middle tiers were greater, their recoveries leave them well below their artificially inflated peak values of 2006. It may be a long time before the low-price-tier of houses regains its previous peak values. The high-price-tier, with a much smaller bubble, and little affected by distressed property sales, is now pretty much back to its previous peak of 2007. Many specific neighborhoods in the city of San Francisco have now surpassed previous peak values.

It’s interesting to note that despite the different scales of their bubbles, crashes and recoveries, all three price tiers now have similar overall appreciation rates when compared to year 2000: ranging from 72% for the low-tier, to 80 to 83% appreciation for the mid and high tiers, over the past 13 years. The gap is relatively small and has been converging in recent months.

Different counties, cities and neighborhoods in the Bay Area are dominated by different price tiers.

Remember that if a price drops by 50%, then it must go up by 100% to make up the loss: loss percentages and gain percentages are not created equal.

3

Bay Area Home-Value Map

Home Values around the San Francisco Bay Area

A map of median house sales prices by city and town
for 3rd quarter 2013 sales reported to MLS.

Paragon

In the map above, “k” signifies thousands of dollars and “m” millions of dollars. In one or two instances where the number of sales was insufficient for meaningful statistics, the median sales price is for the 2nd and 3rd quarters combined.

Maps that break down median sales prices and average dollar per square foot values for houses and condos in the different San Francisco neighborhoods can be found here:

SF Neighborhood Values Maps

Median Sales Price is that price at which half the sales occurred for more and half for less. The single median price for a town, city or neighborhood almost always disguises an enormous variety of sales prices in the underlying, individual home sales: For example, median house sales prices in the city of San Francisco range from under $500,000 to over $4,000,000 by neighborhood. Median sales prices may be and often are affected by other factors besides changes in value, such as seasonality; changes in financing conditions, buying patterns and available inventory; and significant changes in the distressed and luxury home segments. Short-term fluctuations are much less meaningful than long-term trends.