
While single family home prices for San Francisco as a whole can’t seem to recover beyond being around 18% down from their all-time highs, Noe Valley home prices have come roaring back since the start of the year. The three month moving average for April was down just 1% from its all-time high of March 2008. In May, the moving average slipped back to 6.5% off the all-time high. Take a look (click to enlarge): Continue reading “Noe Valley Comes Roaring Back”
2010 San Francisco Residential Wrap-Up: Why condo owners may not be celebrating.
![]()
Given the amount of bad news coming out of the housing market these days, you’d think that San Francisco condo and TIC owners would be celebrating the fact that values increased 4.5% in 2010.
If no one feels like popping corks, it may be because prices have been stuck in a narrow range since they hit their post-bubble bottom two years ago. Take a look (click to enlarge):

Continue reading “2010 San Francisco Residential Wrap-Up: Why condo owners may not be celebrating.”
Of Mixes and Medians: Interpreting Noe’s Valley
My last post was about the fact that Noe Valley median home prices are still down 30% from their all time highs despite a smart recovery in median home prices city-wide. This, despite my sense that there seem to have been a burst of Noe Valley homes hitting the market in the $2 million range and above recently. Continue reading “Of Mixes and Medians: Interpreting Noe’s Valley”
Noe Valley: The Condo/TIC market
At long last, here’s the promised data on Noe Valley condos and TIC’s.
First, a look back (in anger?) at the make-up of Noe Valley sales in 2009.
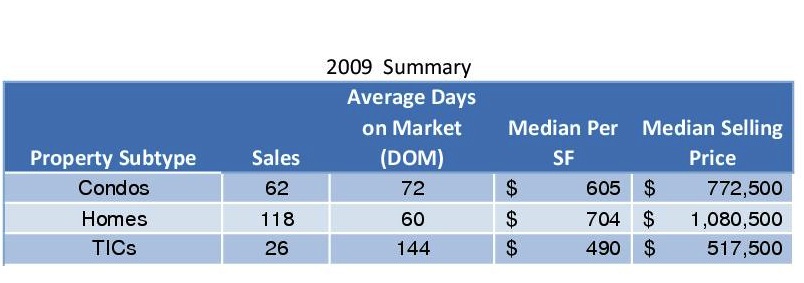
Note that there were more than twice as many condos sold as TICs, and more homes sold than condos and TICs put together. (What’s a TIC? — Check out my series of posts on Tenancy-In-Common Interests, starting here.)
Also, that absurdly long DOM for TICs was distorted by 3 TICs at 201 Hoffman that took 410 days to sell. Still, without those sales, DOM for TICs (tired of the acronyms yet?) was still 99 days. And I’d be somewhat skeptical of the whopping difference in price between TICs and condos as well: TICs sales often don’t have a price per square foot listed, so there are very few data points — and there are very few sales to begin with.
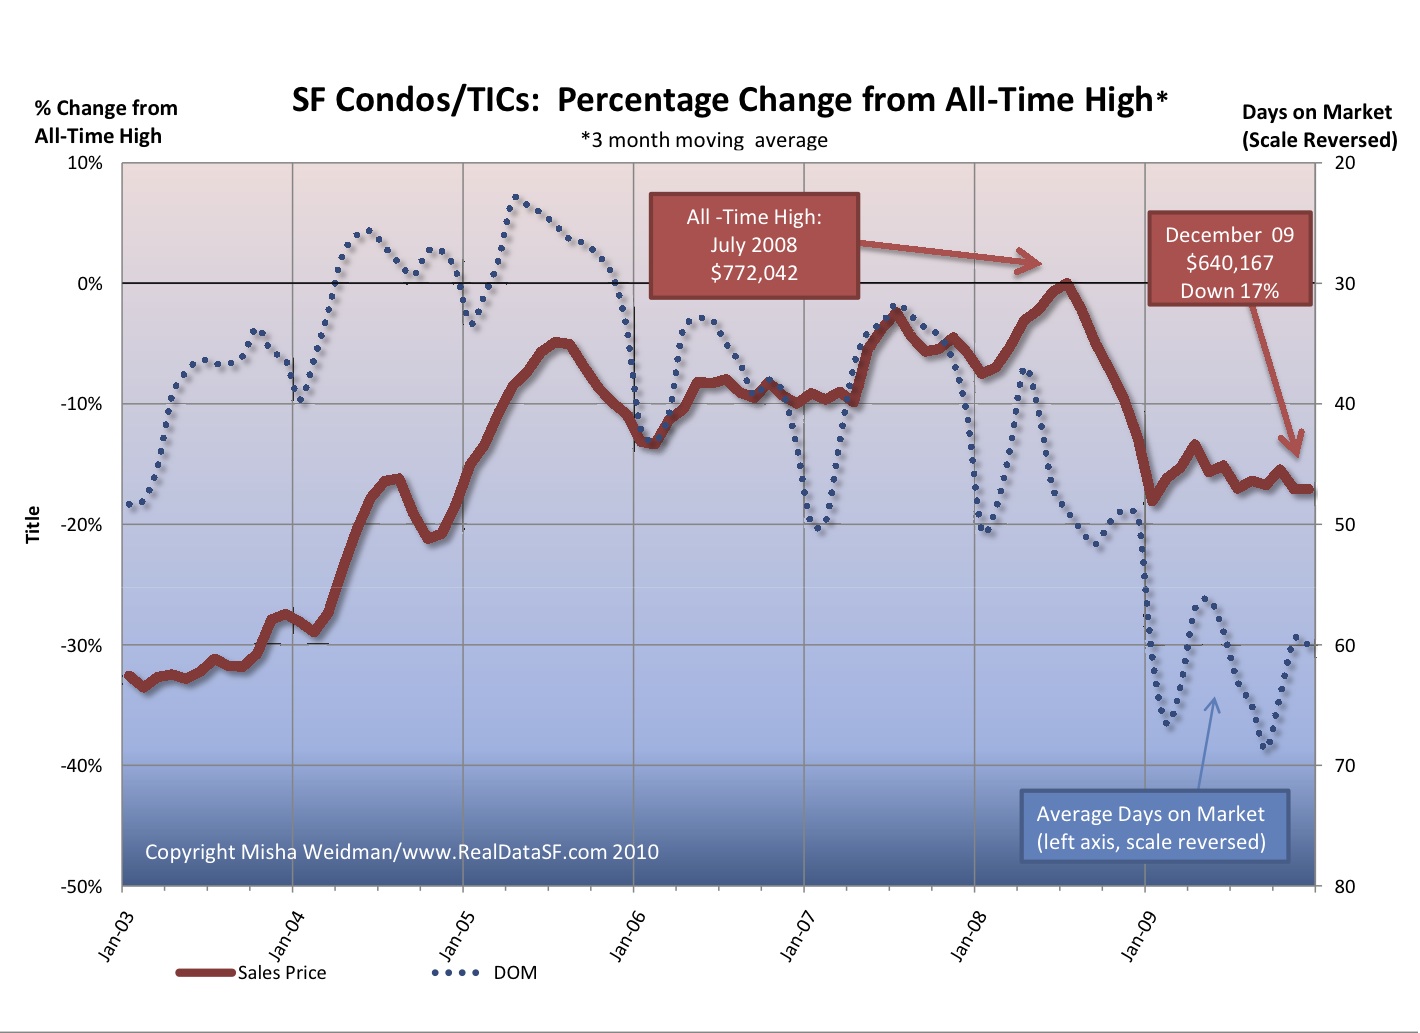
Here’s how condos and TICs have been doing as a combined group, versus their all-time highs.
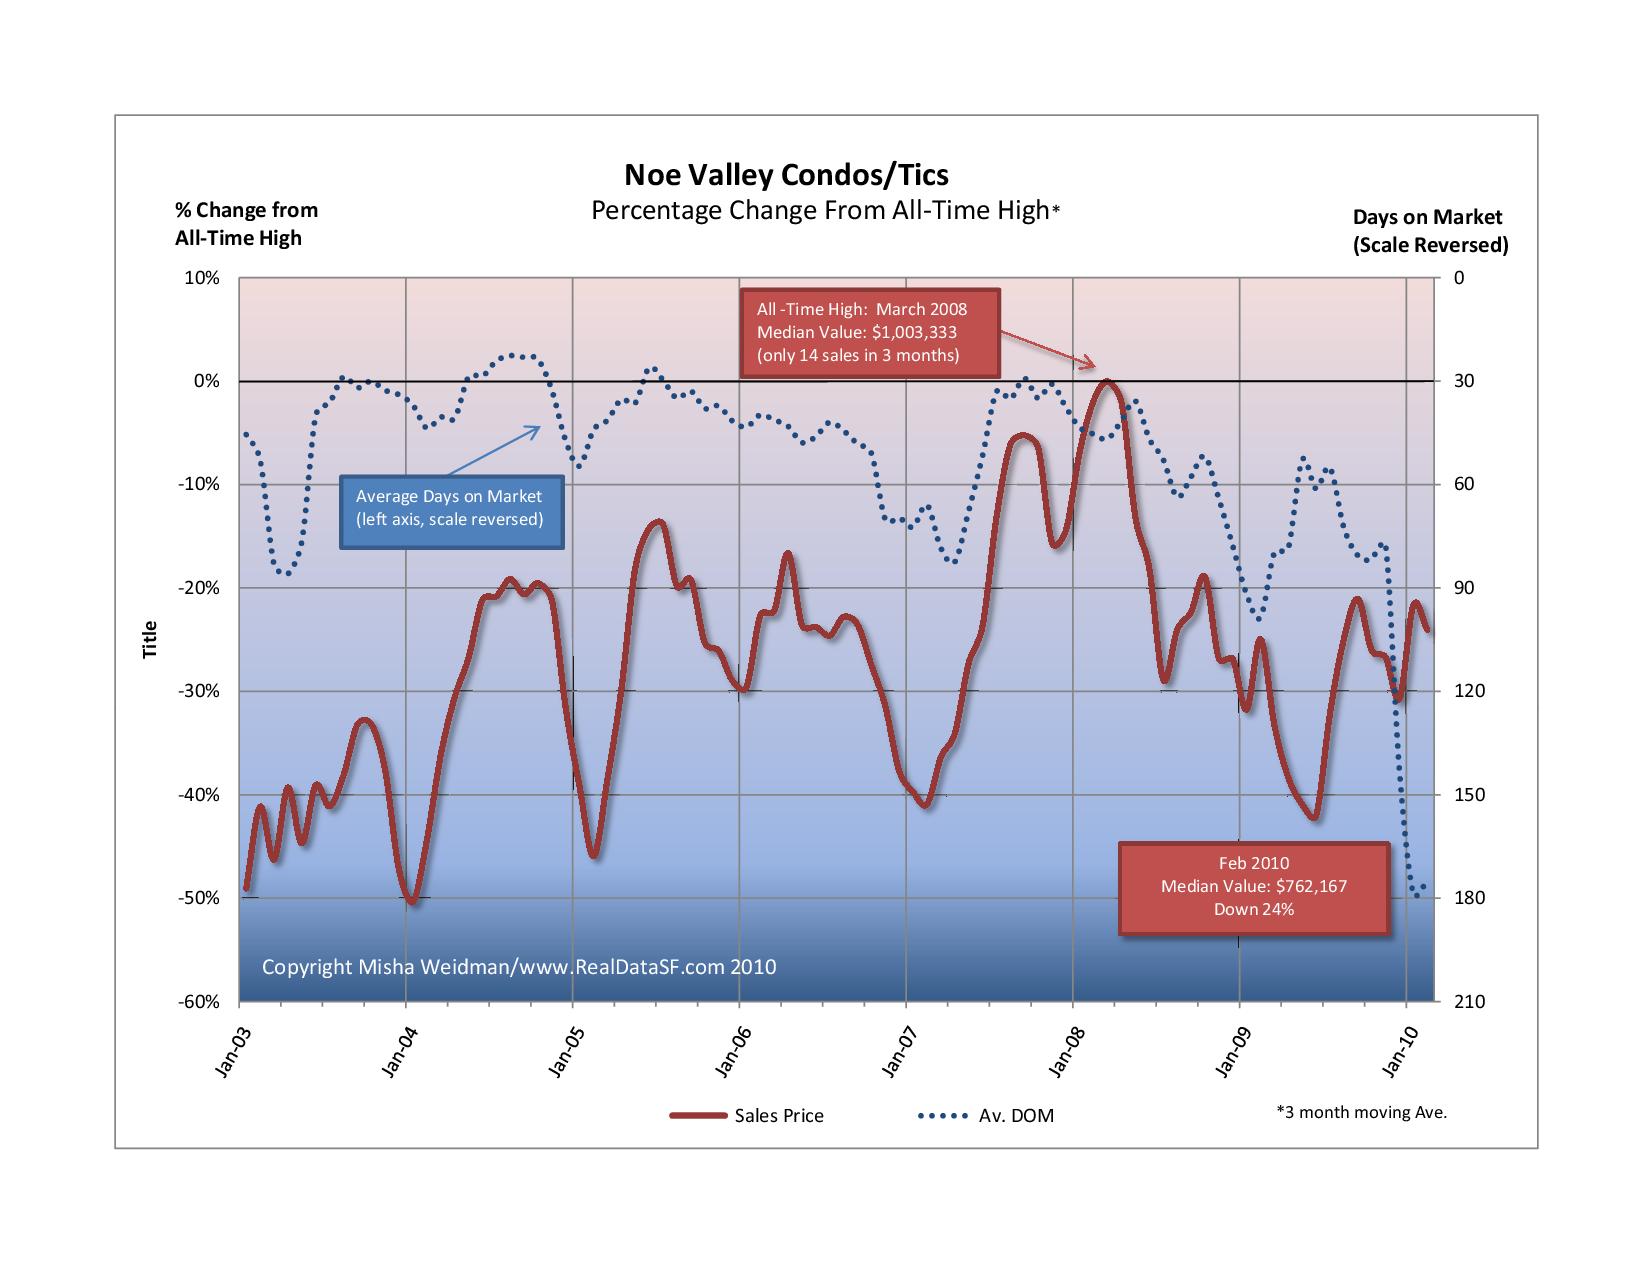
That precipitous plunge (actually a huge increase since the scale is reversed) in DOM at the end of 2009 was also due to the lingering effects of 201 Hoffman.
For a shorter term view, prices through February 2010 are up 11% from January 2009 and are up a whopping 31% from the trough of June 2009. Since I use trailing 3 month averages, I think this is a belated reflection of the deep credit freeze of Spring 2009 when we thought the world might come to an end.
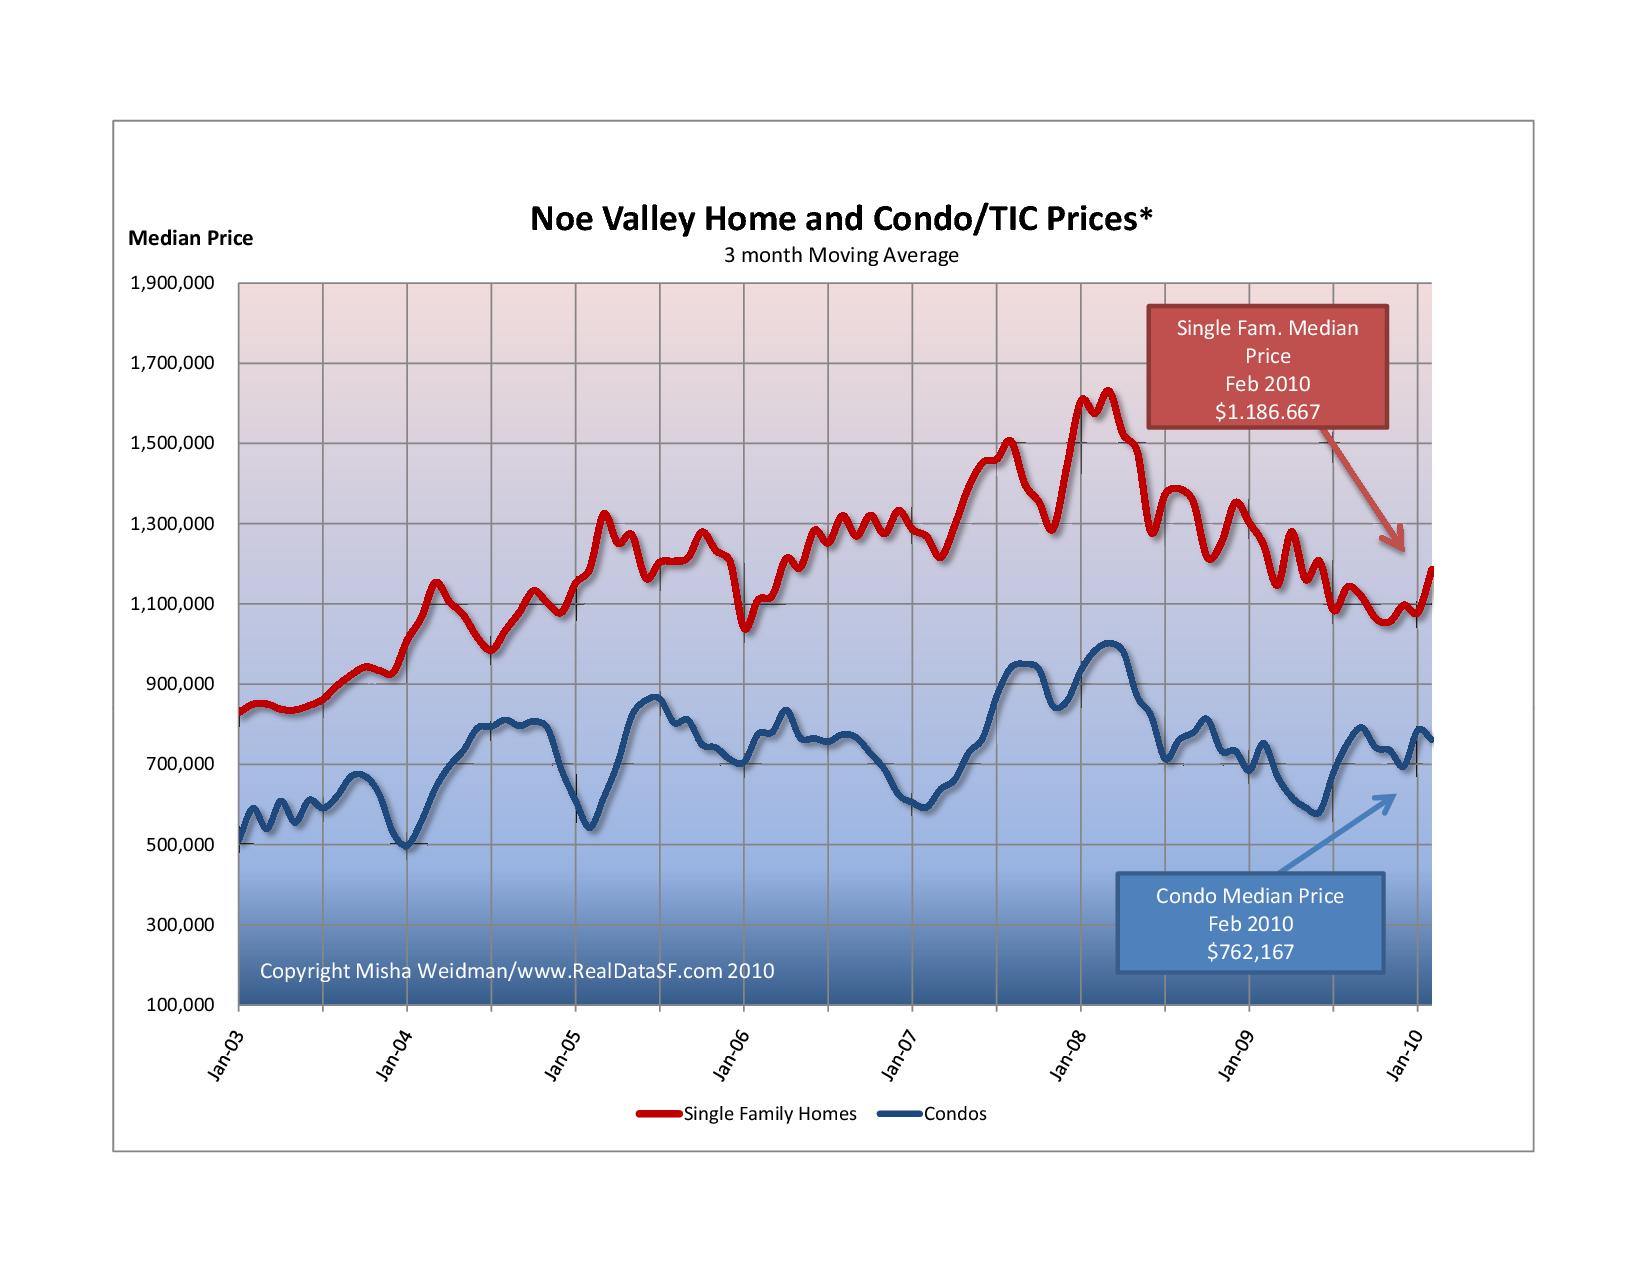
And here’s how condos and TICs stacked up against homes.
For what it’s worth, it feels like spring has really sprung. Nice-looking condos/tics are swarming with people and are moving fast — no kidding. Whether it will last is anybody’s guess.
Noe Valley Still Goin’ Down?

Back in May 2009, I showed that Noe Valley was not immune from the slump in prices affecting the rest of the city, despite suggestions to the contrary from real estate agents, mavens and media.
Have things gotten any better? Well, no. And maybe.
Here’s a chart showing percentage change in single family home prices for the last 14 months, relative to their all-time highs (click to enlarge). (All figures are 3 month moving averages.)
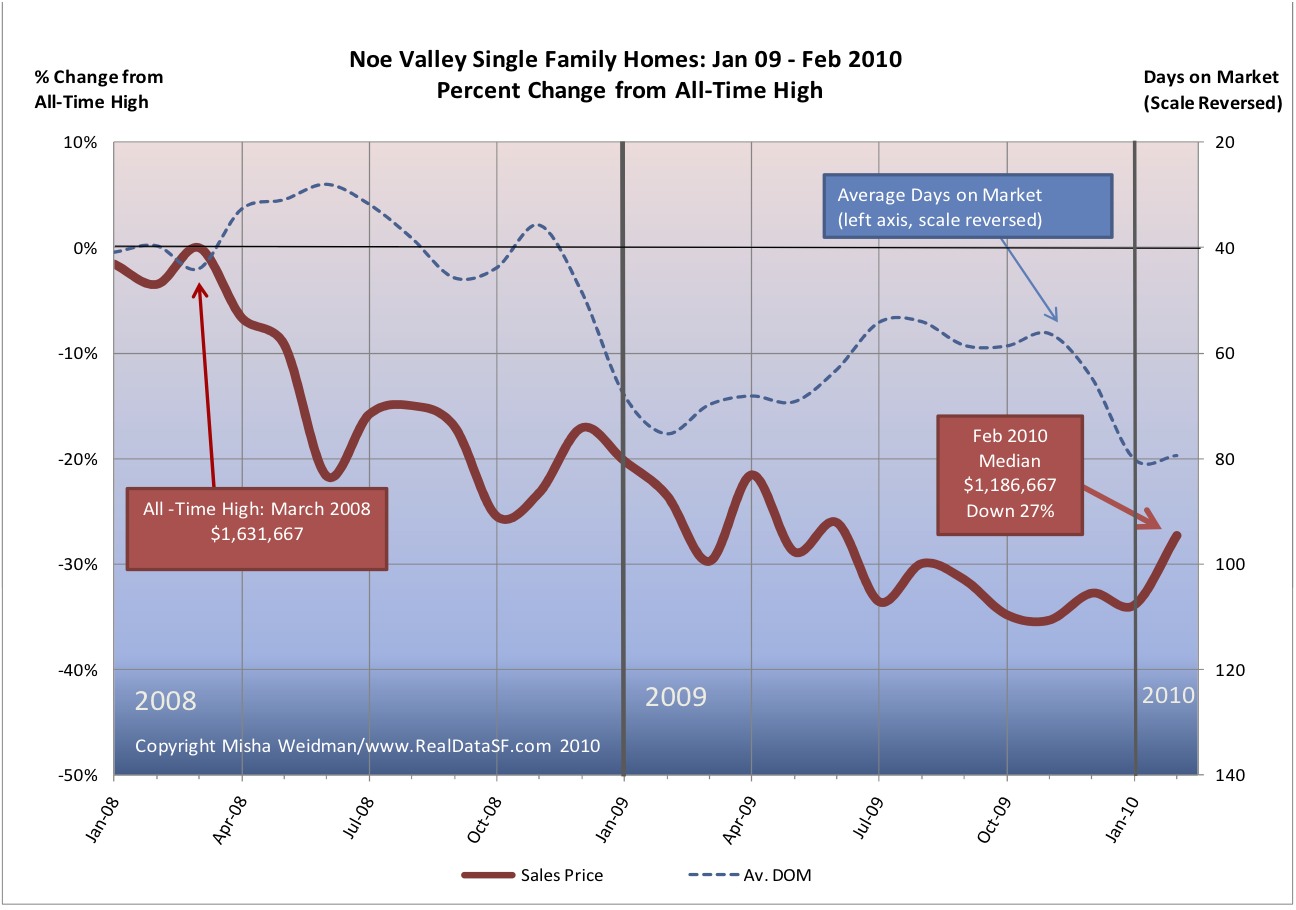
After reaching an all time high in March 2008, prices plummeted. Just a year later, in the midst of fears of a global Depression, home prices were down 30%. Did things get better? No, they got substantially worse. Despite an impressive city-wide recovery in 2009, with prices going from 30% down to around 18% down for single family homes at year’s end (see more detail here) , Noe Valley home prices continued to retreat. In October and November 2009, prices were down 35%. At year’s end, they’d barely clawed back two percentage points. Not surprisingly, days on market (DOM) remained stubbornly high for all of 2009.
Still, with cherry blossoms busting loose all over Noe Valley’s quiet streets, there certainly seems to be a change in the air. There are many more listings coming onto the market and there’s even the occasional feeding frenzy over a clean, well-priced home. These go in a matter of days, not weeks. Maybe that upturn in prices for January and February suggests a continued warming trend.
In the next few posts, I’ll look at Noe Valley in more detail, including how condos have fared.
Looking Back at 2009: Condos/TICs
Pretty much everything I said about how single family homes fared in 2009 also applies to the condo/TIC market. (TIC’s, aka Tenancy In Commons are similar to condos. For more information on TICs, see my three-part series starting here.)
Condo/TICs hit their all-time highs about a year later than homes did — in July 2008. But they’ve fallen from their highs almost exactly as much as homes have. Condos/TICs were down 17%, just one percent better than single family homes.
For those who prefer their data on a per square foot basis, the picture is pretty much the same. The all-time high was $711 — reached in November 2008 and the price per square foot stood at $592 at year’s end, also a drop of 17%.
While condos/TICs ended the year at the same point, the pattern has not been the same. Condos/TICs have been stuck near the bottom of their 2009 range after bouncing up in the first quarter. Homes, on the other hand, appear to have bounced up and stayed up.
What’s in store for 2010 remains anybody’s guess, but on the streets it certainly feels like spring is in the air. There are more listings coming onto the market and more people looking at them. Will that translate into sales and higher prices? That’ll depend on macro-economic trends I’ve discussed elsewhere, but one thing’s pretty clear: interest rates are heading higher, as evidenced by the Fed’s recent increase in the discount rate. If the economy continues to strengthen, that trend will continue. And, for many people, that will result in less buying power and reduced affordability.
Looking Back at 2009: Half-Empty or Half-Full?
Less than two months into the new year and a brand new decade and already 2009 may seem as far away as a bad dream – assuming you still have a job.
It’s hard to remember just how close to the brink of catastrophe we seemed to be just a year ago. Major financial institutions – failed. Credit – impossible to get. Sales—anemic.
With the benefit of hindsight, not to mention survival, some are now criticizing Paulsen, Bernanke, et al., for their haste in rescuing the financial system, but I, for one, will reserve my scorn for the appalling judgment of the likes of Morgan and Goldman and their obscene bonuses.
How did the San Francisco market do? Here’s where we are for single-family homes (click to enlarge).

We ended the year still down 18% from our all-time high of June of 2007. That puts us at around the price levels of the spring of 2005. Not great, but during those scary first months of the year when there was no bottom in sight, we were down to price levels not seen since early 2004.
It’s also interesting to see how Days on Market (DOM) inversely correlates with price, at least over longer periods. In addition to the very regular seasonal dips in price every December/January, it’s easy to see that as DOM lengthens over time, prices decline. While DOM remained less than 40 days, prices stayed high. The correlation isn’t perfect – and certainly not on month-to-month time-scales — but it looks pretty good to me.
So for the “half-empty” crowd, the bottom line is that we’re still down 18% from our all-time highs. The story looks much more positive, however, if you look at 2009 in isolation.

Now a 23% gain for the year ought to be making people feel pretty good. Note that median prices have been in the $700,000 to $800,000 bandwidth for the last three quarters. The dip in the waning months of the year can be attributed to seasonal factors.
I can already hear the nay-sayers arguing that looking at year end numbers is arbitrary or, worse, distorts the picture. (These are the same people who don’t believe in celebrating their birthdays!).
I’m certainly not arguing that happy times are here again. But , if nothing else, that 23% increase confirms just what a wild ride the last two years have been.
As for 2010, I confess I’m beginning to feel a bit more optimistic than I was a few months ago. Manufacturing seems to be continuing to expand. There are some signs of job growth. Still, Europe is now looking shaky and, closer to home, one should never discount the ability of our politicians to screw up the recovery.
All things considered, though, I’ll take my glass half-full please.
Alphabet Soup: What Shape Will the Recovery Take?

On the anniversary of Lehman Brothers’ demise and the near-collapse of global markets, it seems appropriate to take a step back from our little corner of heaven for a wider view.
Given where we were a year ago, the world seems to have heaved a huge, if cautious, sigh of relief. During the chill days of February, the stock market had lost more than half it’s value. Now it’s down “only” 35%.
San Francisco home prices have also improved. In January home prices were down 37% from their all-time highs. By July prices had recovered 11%. In August, however, prices fell back 2%. That’s a pretty stiff drop. (Click the chart for a big version.)

A sign of things to come? Who knows. Everyone seems to have a different letter of the alphabet – or at least the nether end of it — to describe the shape the recovery will take.
Ben Bernanke’s is a long, flat “U”: he thinks we’re on the way, but it’s going to be slow going.
Liz Ann Sonders, Schwab’s chief forecaster and one credited with having seen the train-wreck coming, holds out the possibility of a “V”, in which the economy bounces back like a “coiled spring,” propelled by low inventories and a recovering housing market. You can dismiss that view as self-serving, but I prefer to give her the benefit of the doubt, especially since she’s been right before. Though I’m not sure she’s right this time.
The one that worries me the most, though, is the “W” , otherwise known as the dead-cat bounce or “double-dip” to cat-lovers. Nouriel Roubini, no slouch at forecasting himself, has recently said that there’s a “small probability but rising” that we’ll not only run out of steam but fall back again, victim to enormous deficits and the premature closing of global cash spigots, among a host of other ailments. To that rosy picture, he adds the specter of stagflation, as unsustainable budget deficits lead ultimately to higher interest rates while the economy remains weak. Perhaps that’s the “X” scenario.
As for San Francisco, the housing market certainly seems sunnier these days, with volume at decent levels. But I wouldn’t be surprised to see it turning colder, along with the weather.