San Francisco Home Values by Neighborhood & Bedroom Count
The March 2013 Paragon Market

We’ve just completed our semiannual review of SF house and condo values by average and median prices, average size and average dollar per square foot for sales occurring September 1, 2012 – February 28, 2013, as reported to MLS.
The maps contain median sales price data only, while the tables include the full range of value statistics. (The tables are easier to read, but they’re not as colorful.) If a price is followed by a “k” it references thousands of dollars; if followed by an “m”, it signifies millions. Remember that medians and averages are very general statistics.
Further down in the newsletter are charts tracking supply and demand dynamics and price appreciation trends for the city’s residential real estate market. Statistical definitions can be found at the very bottom. For the smaller images, you’ll need to click-to-expand them to really make them decipherable.

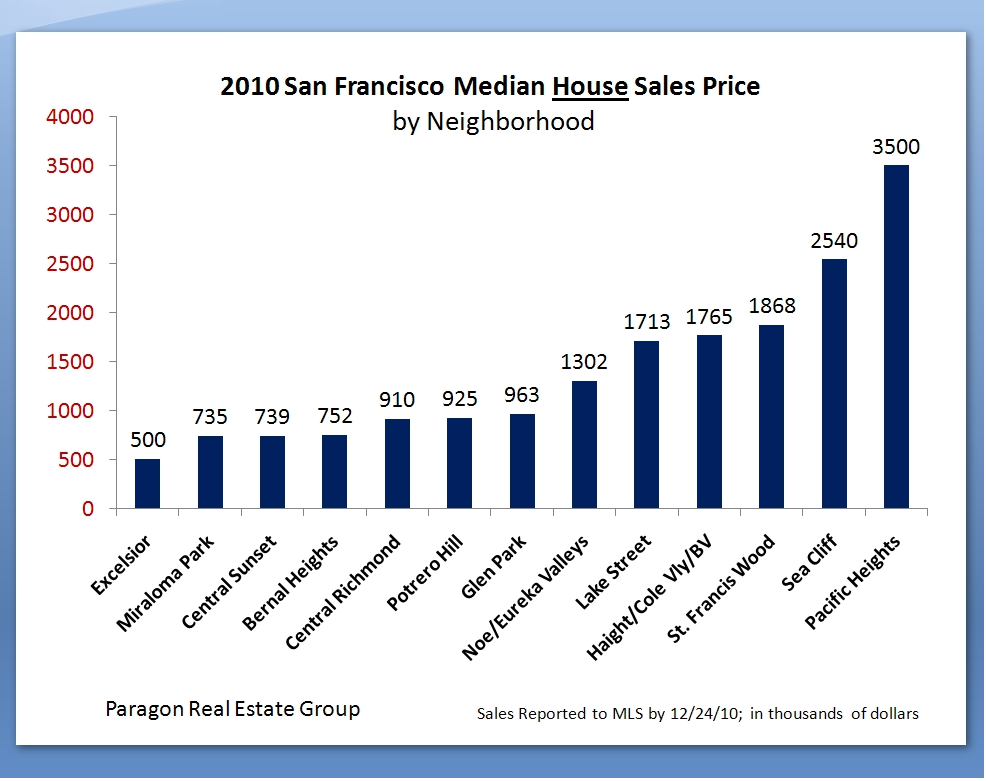
4-Bedroom House Values
This is the table for 4-bedroom house sales over the past 6 months. This link goes to the full analysis by property type, neighborhood and bedroom count.
Neighborhood, Property Type, Bedrooms

2-Bedroom Condo Median Price Map
A map of median sales prices for 2-bedroom condos around the city. The table in the full analysis provides further statistical measures.
Full Analysis

Trends in Inventory & Sales Volume
Sometimes there’s nothing like a chart to depict trends. Here one can clearly see the drastic decline in inventory. And this link goes to a chart on Months Supply of Inventory, another statistic of supply and demand:
Months Supply of Inventory
 New Listings Coming on Market
The quantity of new listings ebbs and flows by season, however even accounting for seasonality, the number of new listings coming on market is much lower than usual. And this link shows the increasing demand since the market recovery really got underway in 2012:
Percentage of Listings Accepting Offers
 Median Price Trends by Month
Monthly price data often fluctuates due to a variety factors. For example, median and average prices almost always drop in January since the higher end of the market usually checks out for the holidays: Values haven’t changed; the demographic of buyers and available inventory changed. However, the clear upward trajectory of prices over the past year is clear in both median and average sales prices.
Average Price Trends
The MEDIAN SALES PRICE is that price at which half the properties sold for more and half for less. If there were 3 sales, at $1, $2 and $10, the median price would be $2. If there were 4 sales at $2, $2, $5 and $10, the median would be $3.50. Median sales price may be affected by seasonal trends, and by changes in inventory or buying trends, as well as by changes in value.
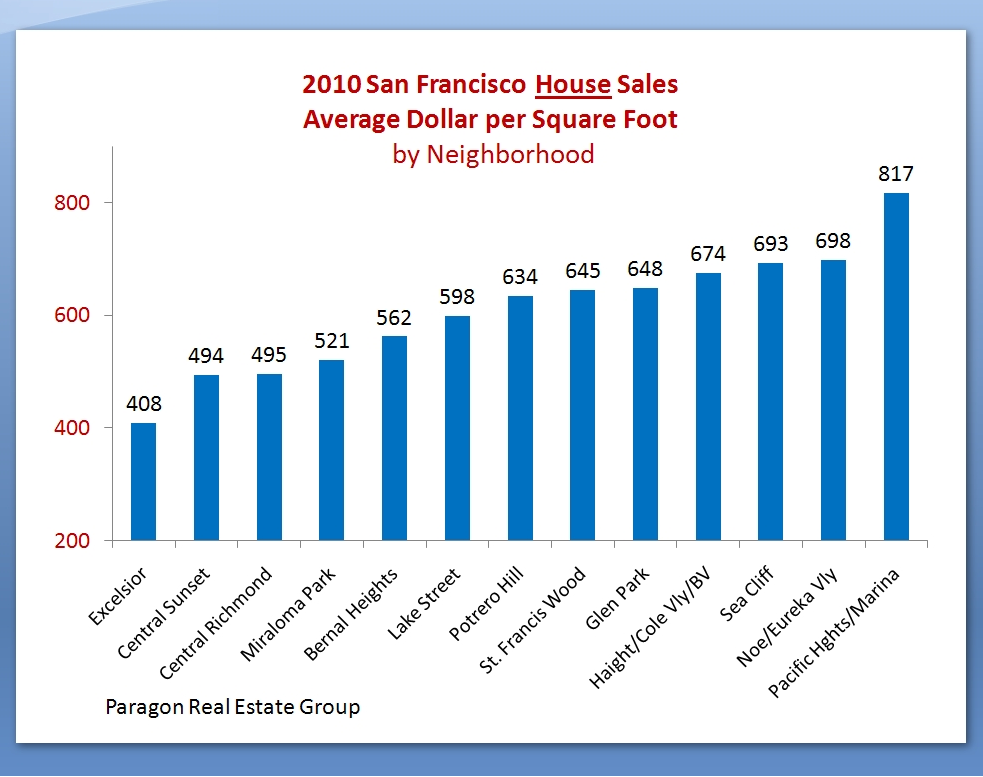
AVERAGE DOLLAR PER SQUARE FOOT is based upon the home’s interior living space and does not include garages, storage, unfinished attics and basements; rooms and apartments built without permit; decks, patios or yards. These figures are typically derived from appraisals or tax records, but can be unreliable, measured in different ways, or unreported altogether: thus consider square footage and $/sq.ft. figures to be very general approximations. Generally speaking, about 60-80% of listings report square footage, and dollar per square foot statistics are based solely on those listings. All things being equal, a house will have a higher dollar per square foot than a condo (because of land value), a condo will have a higher $/sq.ft. than a TIC (quality of title), and a TIC’s will be higher than a multi-unit building’s (quality of use). All things being equal, a smaller home will have a higher $/sq.ft. than a larger one. The highest dollar per square foot values in San Francisco are typically found in upper floor condos in prestige buildings with utterly spectacular views.
The AVERAGE SIZE of homes of the same bedroom count may vary widely by neighborhood: for example, the average size of a 4-bedroom house in Pacific Heights is much larger than one in Noe Valley; and the average of a Marina 2-bedroom condo is larger than one in South Beach. Besides the affluence factor, the era and style of construction often play large roles in these disparities.
Some neighborhoods are well known for having additional ROOMS BUILT WITHOUT PERMIT, such as the classic 1940′s Sunset house with “bedrooms” and baths built out behind the garage. These additions often add value, but being unpermitted are not reflected in $/sq.ft. figures.
Many aspects of value cannot be adequately reflected in general statistics: curb appeal, age, condition, views, amenities, outdoor space, “bonus” rooms, parking, quality of location within the neighborhood, and so forth. Thus, how these statistics apply to any particular home is unknown.


