A belated Happy New Year everyone. One of my new year’s resolutions is to blog more frequently. I love blogging about real estate! I just need to get faster at it. This can be a challenge if you care about getting the facts right. For example, I just spent about 4 hours over 2 days unearthing a discrepancy between my 2010 data on San Francisco home sales and the data provided by my generally excellent real estate feed, which you can find under the Market Trends tab. Turns out they’d incorrectly included sales from the northern part of San Mateo County, which resulted in a much lower median home sales price for 2010 and a very inaccurate read on what had happened in the SF Market over the last year. My next blog will cover those results.
Meanwhile, here is the best “rent vs. buy” calculator that I’ve seen, courtesy of the NY Times. A lot of the calculators out there are either too simple or too complex. This one hits the right balance and wraps it all up with a nice graphic. Here’s a screenshot. Continue reading “Rent or Buy: The Best Calculator”
Say you want to spend around a million bucks to buy a house. Wouldn’t it be useful to know how much houses typically go for per square foot in that price range? Then you could take the square footage of the house you’re looking at, multiply it by the price per square foot and come up with a rough idea of value.
Now say you’re in the happy position of having $2 million dollars to spend. Could be that $2 million dollar houses cost that much just because they’re bigger than $1 million houses, in which case their price per square foot would be the same. Or they might cost more because of the area they’re in, or their finishes and amenities. Whatever the reason, it would be useful to know how much they go for on a per square foot basis. Continue reading “Size Doesn’t Matter”
My last post was about the fact that Noe Valley median home prices are still down 30% from their all time highs despite a smart recovery in median home prices city-wide. This, despite my sense that there seem to have been a burst of Noe Valley homes hitting the market in the $2 million range and above recently. Continue reading “Of Mixes and Medians: Interpreting Noe’s Valley”
Judging by the number of houses I’ve seen being redone from the studs up, together with the number of homes that seem to be hitting the market at over $2 million these days, you’d think that Noe Valley real estate is doing very well once again, thank you very much.
Woke up this morning to NPR announcing that new home sales were the lowest they’d been in 15 years. The housing market is already in a double dip, with some additional price declines on the horizon, though we’re near the bottom. As for the broader economy, we’re skating awfully close, but nobody really knows yet whether we’ll eke out some anemic growth or slide back into recession.
This charming news was followed by another bit of analysis that makes so much sense in retrospect that I’m surprised we haven’t heard it stated more often. What’s well known is how the wave of foreclosures has affected millions of people directly and the corresponding effect on the economy as they lose their homes, their savings, and their credit ratings. But second only to that in terms of its drag on the economy is the effect that declining values have had on people’s ability to move to where the jobs might be. Simply put, there’s a huge number of people who would move, but they can’t because they’re so underwater on their homes. Since they can’t move, they remain unemployed or underemployed, and since there won’t be any significant recovery in the housing market until jobs come back, they remain stuck in a vicious downward cycle. You can find the transcript here.
And a post script. You may have noticed a drop-off in my blogs lately. Summer vacation and the need to work on my development project have taken a toll on the amount of time I have had available to research and write. But don’t erase me from your blog roll yet, please! My eyes and ears are open, and I will try, try, try to post more often as soon as I get my head above water.
I first saw this house, advertised as a fully remodelled 4 BR, 2BA, Potrero Hill View Home,” back in October 2009. With its Spanish Mediterranean, sunny yellow exterior, it had curb appeal, together with terrific if industrial views over the working end of the Central Waterfront and I-280. The main floor showed started off well, with an open layout, great sun and expansive views. I don’t recall the exact layout any more, but I do recall that a lot of the home’s square footage, including “an expansive fourth bedroom/media room” and “informal office space” were located on a lower floor basement conversion that still felt like a basement.
I like to try to guess what things will sell for when I see them on Broker’s Tour. Listed at $1,198,000, this one seemed high, even though the “stats” seemed pretty good. 130 days later, they dropped the price by $50,000. Thirty days after that, they dropped it by another $50,000. It finally sold last month, 223 days after it was first listed. Price? $1,040,000 — 13% off the original asking price.
With space so tight in SF, basement conversions are an obvious place to shoe-horn in extra space. But they have to be done right or they’ll feel cramped and dark. Most of the time, I’ll take an attic instead.
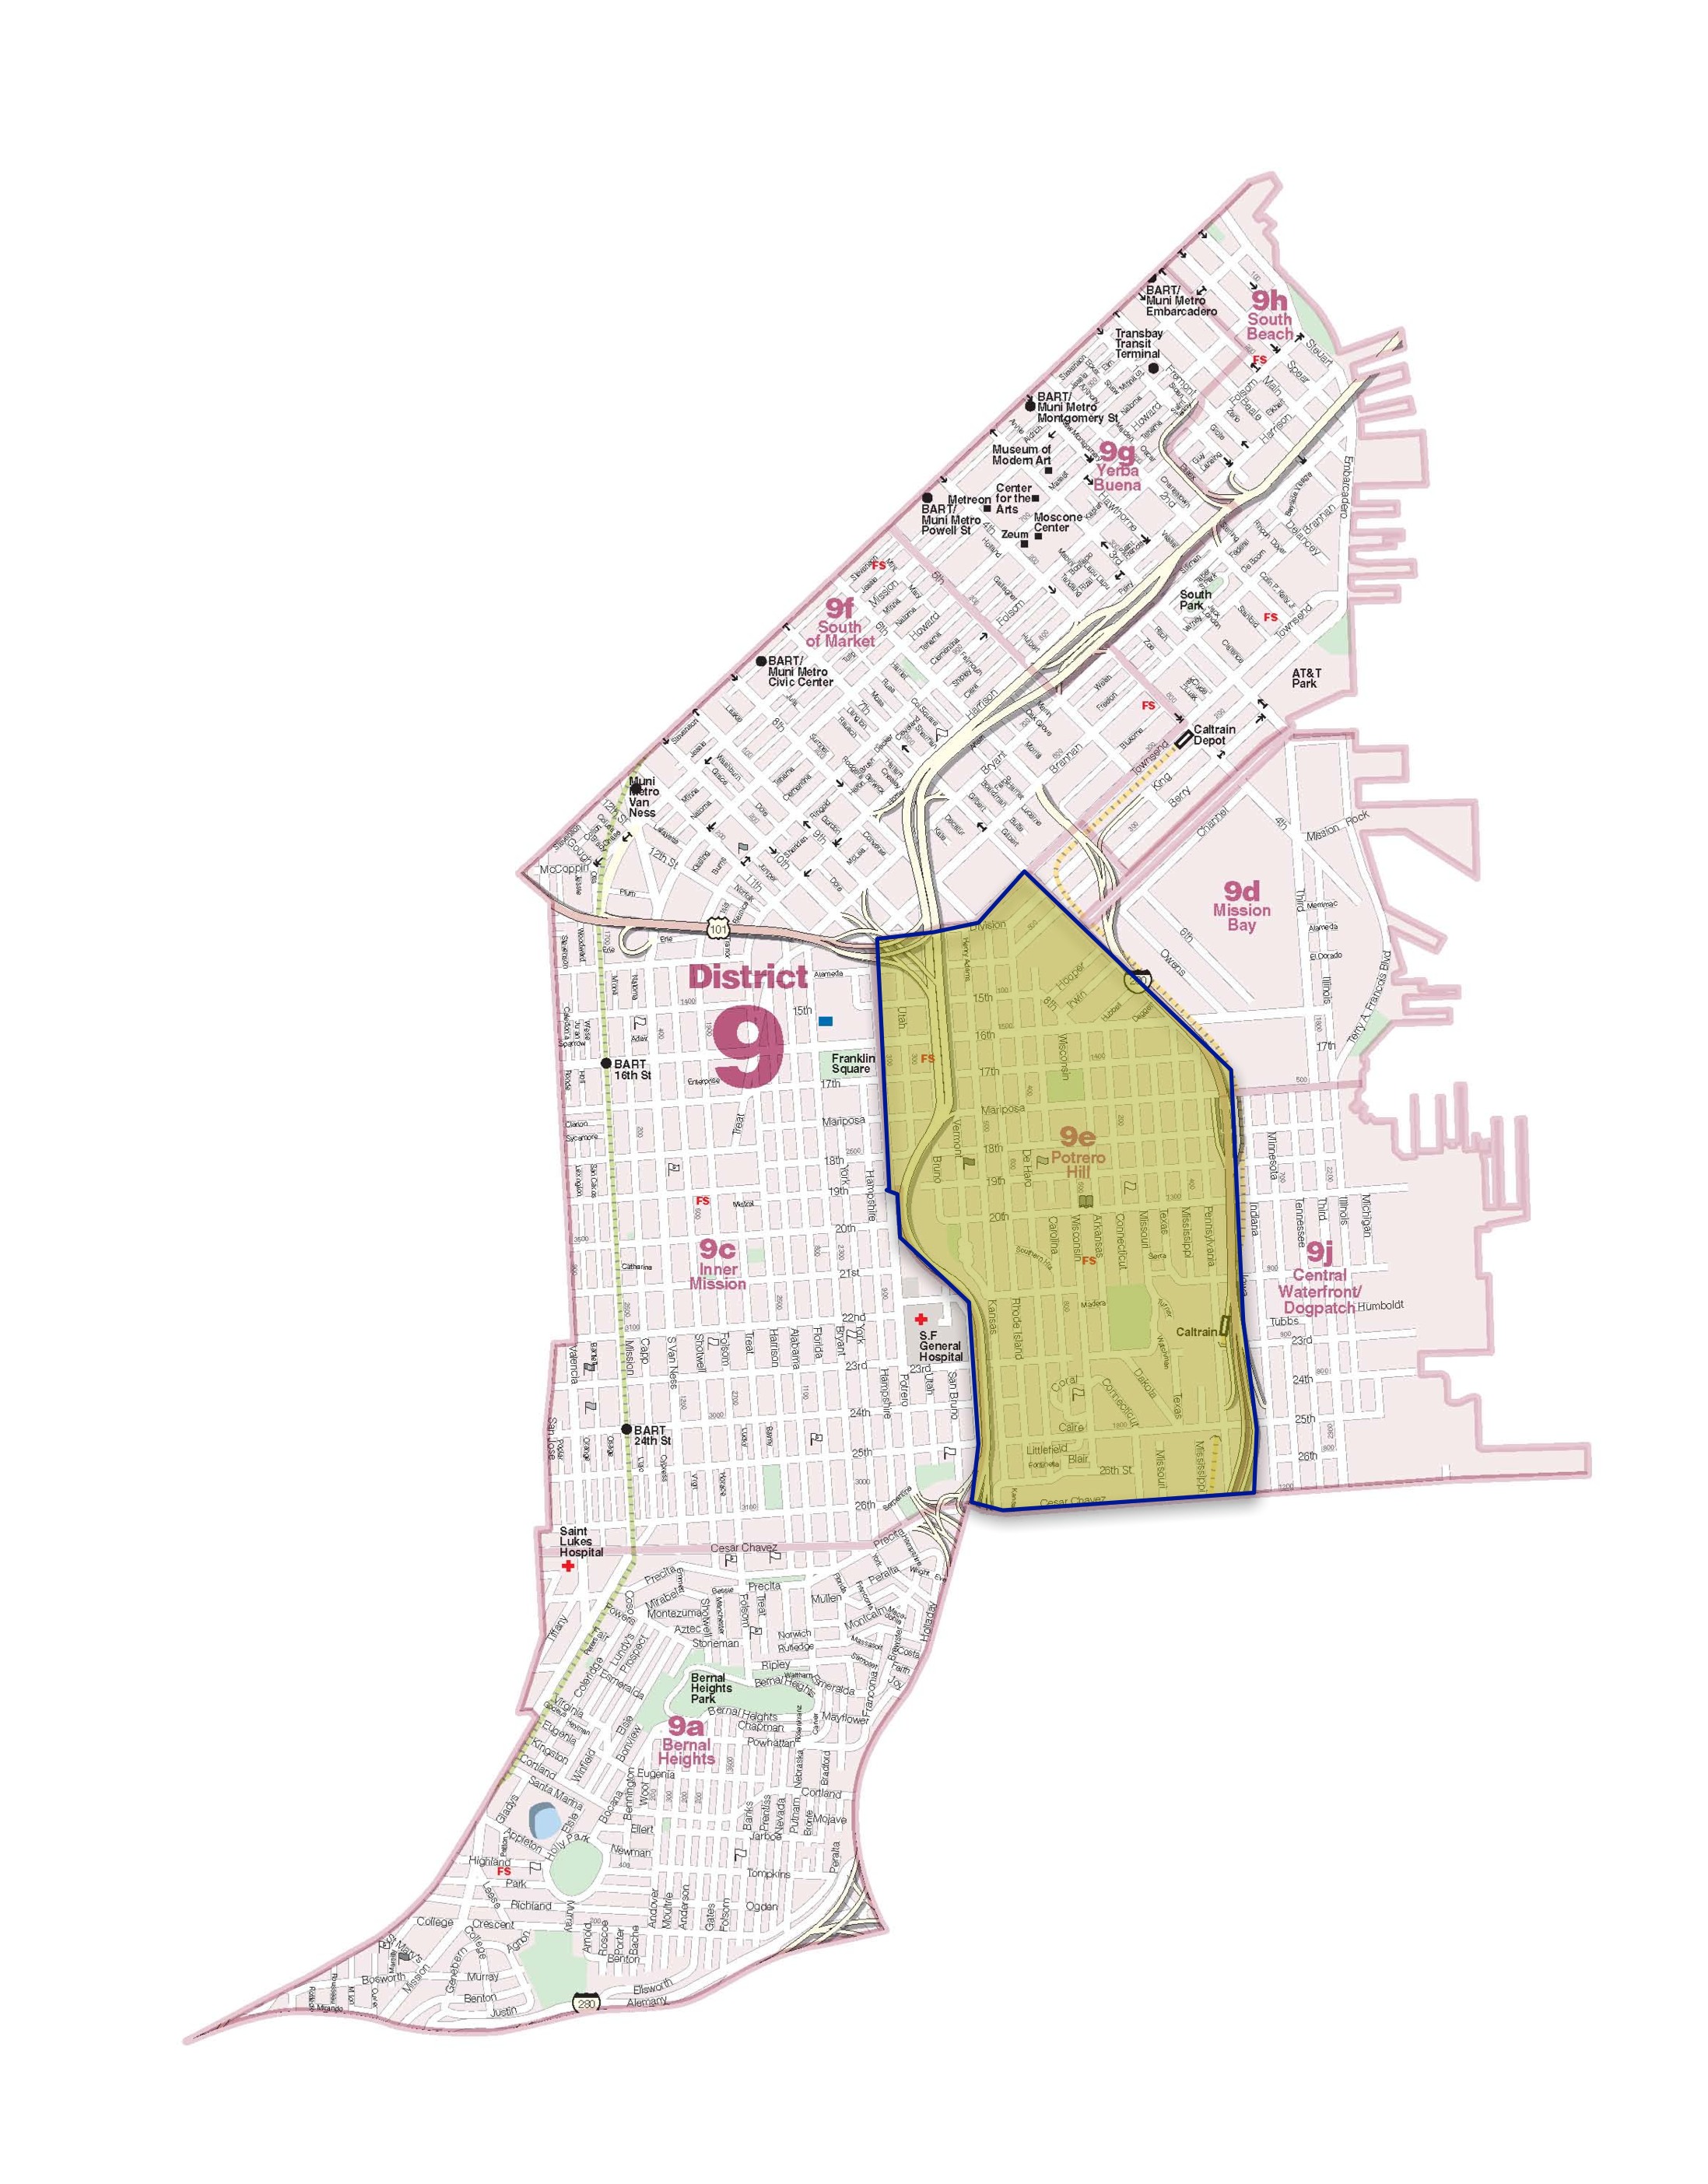
I’m currently working with a couple of clients looking for homes in the Potrero Hill District. Here, we’re talking specifically about subdistrict 9.E under San Francisco’s MLS (Multiple Listing Service).
It’s an area that roughly sits between I-280 and I-101, with Cesar Chavez at its the south end and the tangle of 101/Design District/Division at its north end. With major arteries at all ends as well as proximity to Caltrain, it’s a favorite for people who need good commute access. It’s also got some of the best weather in San Francisco. The crest of Potrero Hill sits at intersection of Carolina and 22nd Street. Homes on the “north slope” — ie. north of 22nd Street — boast spectacular views of downtown SF and the Bay and therefore fetch a premium. Potrero Hill has a small but upscalish shopping/cafe strip located on 18th between Connecticut and Texas. The recently opened Whole Foods at Rhode Island and 17th hasn’t hurt either. Architecture is a mix of broad two-story Victorians and newer modern structures designed to take advantage of the weather and the views, especially on the north slope.
Apparently the denizens of Potrero Hill like their neighborhood because there are very few sales. In fact, based on my review of sales of single family homes back to 2003, there’s an average of just 4 sales per month. Sometimes there are none at all. With so few sales each month, I’ve used averages to look at values rather than medians. Prices seem to have remained incredibly stable over a long period of time. This chart shows price on a per square foot basis (click to enlarge).
Potrero Hill SFD sales
Potrero has the reputation of being a relatively affordable area, and perhaps it is if you’re talking about Noe Valley or Pacific Heights. In June 2010, the average home sales price for the city as a whole (based on 217 sales) was $1,107,000 — about $100,000 over the average for Potrero. However, the average price per square foot for the city as a whole came in at $523 — substantially below that for Potrero. With so few monthly sales available in Potrero, I’d be cautious about drawing any conclusions from one month. As the chart trend line shows, Potrero’s price average price per square foot looks remarkably stable at around $560 currently. That seems consistent with the idea that Potrero Hill is one of San Francisco’s better, if not poshest, neighborhoods.