Continued Improvement in the Housing Market or Borrowing from the Future?

CB104955

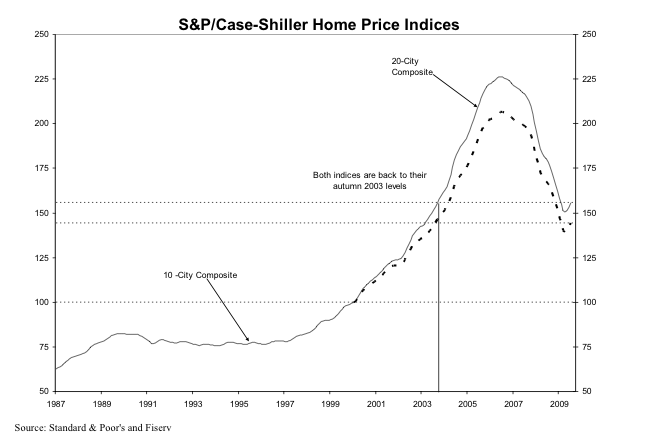
The National Association of Realtors (NAR) reported yesterday that existing home sales in October rose to their highest level in more than two years.  Nationally, sales were up 10.1% over September and up 23.5% year over year.

Most of the increase in sales, however, was not in the western region, where sales were  only up 1.6% from the previous month.  (Oh, the devil is always in the details.)  And more “good news”:  The western region median price of $220,200 — clearly this is not San Francisco — was down 14.7% year over year.

Not surprisingly, the article stresses the positive.  Inventories are shrinking, especially at the lower price levels where foreclosures and REOs are slowly being digested by the system.  Prices have fallen by the smallest amount in over a year (don’t you love that!).

You can argue that any press release by NAR is going to be self-serving, but its Chief Economist, Lawrence Yun, doesn’t mince words when he says that a lot of the sales surge was fueled  by the anticipated expiration of the First Time Homebuyer Tax Credit.  The $8,000 tax credit was originally scheduled to expire in November, but has now been extended  through April 30, 2010. Yun goes on to caution that “with such a sale spike, a measurable decline should be anticipated in December and early next year before another surge in spring and early summer.”

We can only hope that he’s right about that surge….

Fears of a New Chill In Home Sales

winter home

That was the title of an October 27 article in the New York Times, and, as one of my readers and clients pointed out, it’s what I’ve been tentatively suggesting as a possible scenario for this winter. See here, for example.

And, ironically, the gloomy head-line announced yet another “positive” month of data from the Case-Shiller Home Price Index. The little up-tick in the index from last month’s July data that I discussed as a possible “dead cat bounce” continued in August.

Picture 4

“San Francisco”  — remember, this is a Metropolitan Statistical Area (MSA)  consisting of 5 of the 9 Bay Area Counties — improved 2.6% on a seasonally adjusted basis from July 09.  The New York Times has a cool inter-active chart that shows the CS Index for various MSA’s here.

So why so glum?  The NY Times article points to a number of factors that suggest the improvement may not continue:

  • an unexpected fall in consumer confidence in October.
  • the end of the stimulus provided by the first-time home-buyer tax credit (though there’s pressure to extend this).
  • doubt about how long the The Fed will keep interest rates so low.

Especially troubling for California is “strong evidence that foreclosures may be spreading from sub-prime inland areas to the more exclusive coastal region.”

My view hasn’t changed.  If you’re thinking about buying, this is probably a good time to be out there looking, with a view to buying some time during the winter months when activity slows and prices tend to soften somewhat.  Nobody knows how long interest rates are going to remain low — and some economists think that they may well remain low for a while — but with the government having thrown so much money at the economy to keep us from the brink of disaster, it’s hard to argue that the long-term trend is going to be anything but up.

As for whether we’ve hit bottom yet, it’s anybody’s guess.  While Mr Case of Case-Shiller continues to think that the worst is over, the NY Times article quotes another eminent economist who thinks that the recent improvement in the CS Index is an aberration and who wouldn’t be surprised by another — if limited — down-leg.

It’s a fool’s game to try to time the market to the nth degree.  And in this environment, with so many contradictory signs pointing in so many directions, you might as well flip a coin, or an economist, and see whether he lands on his head or his arse.

Me, I’m dusting off my magic 8-ball.

magic_8_ball_3

Dead Cat Bounce?

deadcatbounce

At the end of last month, the media was full of Case-Shiller’s upbeat report on the national housing market for July 2009, its most recent reporting month. Three months of improving sales “continue to support an indication of stabilization in national real estate values,” according to the September Report.

Here’s the chart, by the way, which also shows that on a national basis we are back to Autumn 2003 price levels.

Picture 3

See that little up-tick at the very end of down side of the mountain?  That’s what every one is celebrating, folks.  Indeed, it’s hard not to laugh when the Report includes tortured phrases like “the rate of annual decline … seems to be decelerating”  or “all metro areas are showing an improvement in the annual rates of return, as seen through a moderation in their annual declines.” Whoopee!

Locally, “San Francisco” — keep in mind that for the CS Index, this means 5 of the 9 Bay Area Counties — posted its fifth straight gain, with a seasonally adjusted gain of 2.9% over June 09, which followed a seasonally adjusted gain of 3.2% in June over May.  Before you break out the champagne, “San Francisco” was still down 17.9% year over year.

This is now old news.  But in this Sunday’s New York Times, Mr. Shiller mused about what all this meant for the real estate market. The article is not a model of clarity, but Shiller’s conclusion is pretty stark:  “At the moment, it appears that the extreme ups and downs of the housing market have turned many Americans into housing speculators.”  He suggests that people are looking at the huge amount of money the fed is pumping into the system, the first-time home-buyer tax credits, and other short-term infusions, and basically “trying  to time their home-buying decisions” and thus artificially causing the spike in prices. Here’s the takeaway:   “The sudden turn could signal a new housing boom, but it is more likely just a sign of a period of higher short-run price volatility.”

Indeed, after noting that the recent change in direction in the CS Index is the sharpest he’s ever seen, he takes a look at the last time a similar turnaround occurred.  It was at the end of the last housing bust, after the 1990-91 recession.  Five years later, however, home prices were down 13.8% in inflation-adjusted terms from the highs they’d reached in the “turnaround” month.

Meanwhile, the stock market continues its giddy gains — perhaps for many of the same reasons as the housing market has bounced back.

Personally, I’m not terribly fond of cats, but if I owned one I’d be keeping it away from any open windows.

Waiting for the Other Sheep To Drop… Or Not

sheep_off_cliff

Does anyone really know what’s going on?  Despite the gloom and doom of my recent posts (Waiting for the Other Sheep to Drop, Alphabet Soup:  What Shape will the Recovery Take?), the latest publication of the Conference Board’s Leading Economic Index (LEI) on Tuesday trumpets:  “Fifth Consecutive Increase!”  The LEI is supposed to predict economic activity approximately 6 months into the future, so you’d think that a five-month run would mean it’s time to celebrate, especially given what looks like the impressive bounce shown in this graph.

Picture 1

(The Coincident Economic Index — blue line — shows what’s happening to the economy currently, and — no surprise — it shows we’ve bottomed out.)

To be sure, The Conference Board hedges its bets and says that while a recovery is near, “the intensity and pattern of that recovery is more uncertain.” You can find the full report here.

Meanwhile, today’s WSJ headline reads”Rebound in Home Sales Hits a Bump” , with national sales declining last month after four straight months of increases. (Thank you, X-Man, for the heads-up on this article.)

What does all this mean?  I think it means two things.  1. The worst is over.  2.  You might just as well go consult your magic 8-ball (“signs point to yes,” “ask again later”…) as consult the experts on what the recovery will look like.

Alphabet Soup: What Shape Will the Recovery Take?

CB005684

On the anniversary of Lehman Brothers’ demise and the near-collapse of global markets, it seems appropriate to take a step back from our little corner of heaven for a wider view.

Given where we were a year ago, the world seems to have heaved a huge, if cautious, sigh of relief.  During the chill days of February, the stock market had lost more than half it’s value.  Now it’s down “only” 35%.

San Francisco home prices have also improved.  In January home prices were down 37% from their all-time highs. By July prices had recovered 11%. In August, however, prices fell back 2%.  That’s a pretty stiff drop. (Click the chart for a big version.)

S&P 500 vs SF Home Sales

A sign of things to come?  Who knows.  Everyone seems to have a different letter of the alphabet – or at least the nether end of it — to describe the shape the recovery will take.

Ben Bernanke’s is a long, flat “U”: he thinks we’re on the way, but it’s going to be slow going.

Liz Ann Sonders, Schwab’s chief forecaster and one credited with having seen the train-wreck coming, holds out the possibility of a “V”, in which the economy bounces back like a “coiled spring,” propelled by low inventories and a recovering housing market.  You can dismiss that view as self-serving, but I prefer to give her the benefit of the doubt, especially since she’s been right before. Though I’m not sure she’s right this time.

The one that worries me the most, though, is the “W” , otherwise known as the dead-cat bounce or “double-dip” to cat-lovers.  Nouriel Roubini, no slouch at forecasting himself, has recently said that there’s a “small probability but rising” that we’ll not only run out of steam but fall back again, victim to enormous deficits and the premature closing of global cash spigots, among a host of other ailments.  To that rosy picture, he adds the specter of stagflation, as unsustainable budget deficits lead ultimately to higher interest rates while the economy remains weak.  Perhaps that’s the “X” scenario.

As for San Francisco, the housing market certainly seems sunnier these days, with volume at decent levels.  But I wouldn’t be surprised to see it turning colder, along with the weather.

The Worst May Be Over According to Big Brain, Ken Rosen

male_brain

Ken Rosen, Chair of the Fisher School For Urban Economics over at UC Berkeley, has good news for San Francisco home owners.  “The recent rise in home prices and sales activity lead us to believe that the worst part of the correction in home prices is behind us and that housing market conditions are showing signs of improvement.”

This report, based on June results, is the first of what will be a monthly analysis of the San Francisco real estate market undertaken by The  Rosen Consulting Group on behalf of The San Francisco Association of Realtors.  You can download it here.

I’m a big fan of Rosen.   I listen to him speak once or twice a year at a real estate symposium put on by the Fisher School; he and others bring a level of sophistication and breadth of view to the analysis of the real estate market that is hard to find when we are toiling in our own back yards.  I blogged on his predictions about the market  in a couple of posts entitled The View From Space at the end of last year.  Does that mean you won’t be needing me to crunch the numbers any more, gentle reader?  Not necessarily:  I believe the report miscalculated the median year-over-year price change for single family homes from June 08 to 09.  Rosen says it’s 6.8% down.  SFAR’s own numbers put it at 4.9%.  (I have us down 5.7%:  some discrepancies, alas, are inevitable — a result of delays in agents and brokers putting “sold” information into the MLS system from which all this data is derived.)  Anyway, I’ve notified SFAR — we’ll see what happens.  Besides, I’ll continue to try to get as fine-grained as I can in my analyses.  Rosen is a big picture guy.

Quibbles notwithstanding, Rosen makes some interesting points and one of them has caused me to rethink a previous post of mine.

His report points out that nearly a quarter of active and closed sales in June were in District 10, which encompasses “distressed” areas like the Bayview and Hunters Point.  Back in May, I argued against the commonly-heard thesis that District 10, along with District 3, were dragging down values in the city as a whole.  My chart showed that the City taken as a whole was about as far off its all-time high as Districts 3 and 10 were off of theirs.  Well, I was right.  And wrong.

It turns out that both statements are true:  Districts 3 and 10 were doing no worse than the city as a whole in terms of where they were relative to their all-time highs.  But it’s also true that the high volume of low-priced sales in those districts, combined with many fewer sales at the top end of the market, did pull down the median value for the City as a whole.   How did I miss it?  I didn’t look at the distribution of sales across the various districts. Rather, I compared the medians for each data set without looking at relative sales volumes.

Data analysis is tricky stuff.  It’s easy to pick and choose your metrics to match your agenda.  But it’s just as easy to miss a detail that changes the picture considerably.

Here are some more tidbits from the report:

  • Despite the concentration of low-price sales in Districts 10, there has been a significant jump in sales volume in high priced Districts 5 and 7, which encompass neighborhoods like Noe Valley and the Marina.
  • The large number of condos on the market from new down-town and SOMA high rise projects is continuing to put downward pressure on condo values.
  • Rosen expects home prices to be soft but to continue to improve through the remainder of the year.  “With for-sale inventory still at elevated levels and expectations for a continued rise in the unemployment rate through the end of this year, buyers will still have good purchasing opportunities.”

I got that part right.

Case Shiller Chimes in With Good News: US Down only 17%!

Picture 1

Case-Shiller published its closely watched indices yesterday.  Hooray! The broadest CS index shows that the rate of decline in the nation’s largest housing markets has reversed in recent months.  Now we’re only going down 16% year over year instead of 20%.

They also point out that we are now back to 2003 values, which also holds true of San Francisco.  Here’s my chart from an April blog:

Core Area Medians vs All Districts

Before you go out and celebrate, Case-Shiller has “San Francisco” down a whopping 26.1% year over year.  Why the quotes?  Because it’s really the “San Francisco-Oakland-Fremont, CA Metropolitan Statistical Area” and it includes ALL of Alameda, Contra Costa, Marin, San Mateo, and … San Francisco County. That’s 5 counties folks, a factoid often omitted even by such august publications as the New York Times (see today’s front page article).

Now here’s the “good” news.  My data says that the San Francisco we live in was down “just” 5.7% in June 09 year over year for homes.  Take a look under the Market Trends tab for annual and monthly data for the City and specific MLS Districts.  (By contrast, condos are down 15% year over year.  That also happens to be how much they’re down from their all-time highs, which occurred right about a year ago.  See my previous post.

More Grim News on Housing

Saturday’s NY Times proclaims “A Gloomy Outlook for Home Sales’ Big Season.” The headliner, by the way, was “Job Losses Hint at Vast Remaking of U.S. Economy.” Is it really any wonder we have difficulty sleeping a’ nights?

Here are some of the cheery highlights:

  • One out of every seven apartments and houses in the US are vacant, a level not seen since the 1960’s. That’s about 19 million units
  • Less than a third of those are actually for rent or for sale, meaning that many more could yet come onto the market.
  • New contracts for previously owned homes fell at their fastest pace for two years.
  • Some areas that have fallen fastest, like inland California, are seeing improved sales.
  • Urban areas that have withstood the recession reasonably well, like San Francisco and New York, are “frozen.”

We pass Elk Grove on our way up to Tahoe.  Beautiful spot east of Sacramento.  You can buy a 3 BR house there for $193,000.  The same house sold for $336,000 four years ago.  The mortgage is a $100 less than it costs to rent a 2BR apartment.  It’s hard not to think of that as positive.  That is, unless you were the one who lost $143,000 in equity.

They’re predicting the housing market will get “worse” before it gets better.  Why “worse”?  Because a lot of people are going to feel — and be — a hell of a lot poorer than they used to.   And the people for whom an increase in housing affordability might make a difference are the ones who are getting hammered the worst.

Here’s a chart showing future’s contracts on home prices.  It shows prices deteriorating further this year, followed by a long, flat recovery starting some time in 2010.

picture-4

Sounds like it’s going to be chilly spring.