At long last, here’s the promised data on Noe Valley condos and TIC’s.
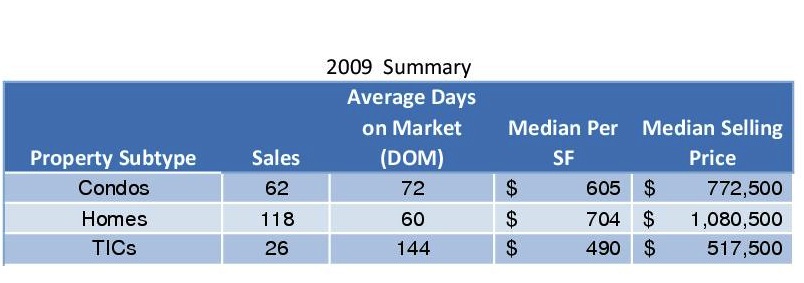
First, a look back (in anger?) at the make-up of Noe Valley sales in 2009.
Note that there were more than twice as many condos sold as TICs, and more homes sold than condos and TICs put together. (What’s a TIC? — Check out my series of posts on Tenancy-In-Common Interests, starting here.)
Also, that absurdly long DOM for TICs was distorted by 3 TICs at 201 Hoffman that took 410 days to sell. Still, without those sales, DOM for TICs (tired of the acronyms yet?) was still 99 days. And I’d be somewhat skeptical of the whopping difference in price between TICs and condos as well: TICs sales often don’t have a price per square foot listed, so there are very few data points — and there are very few sales to begin with.
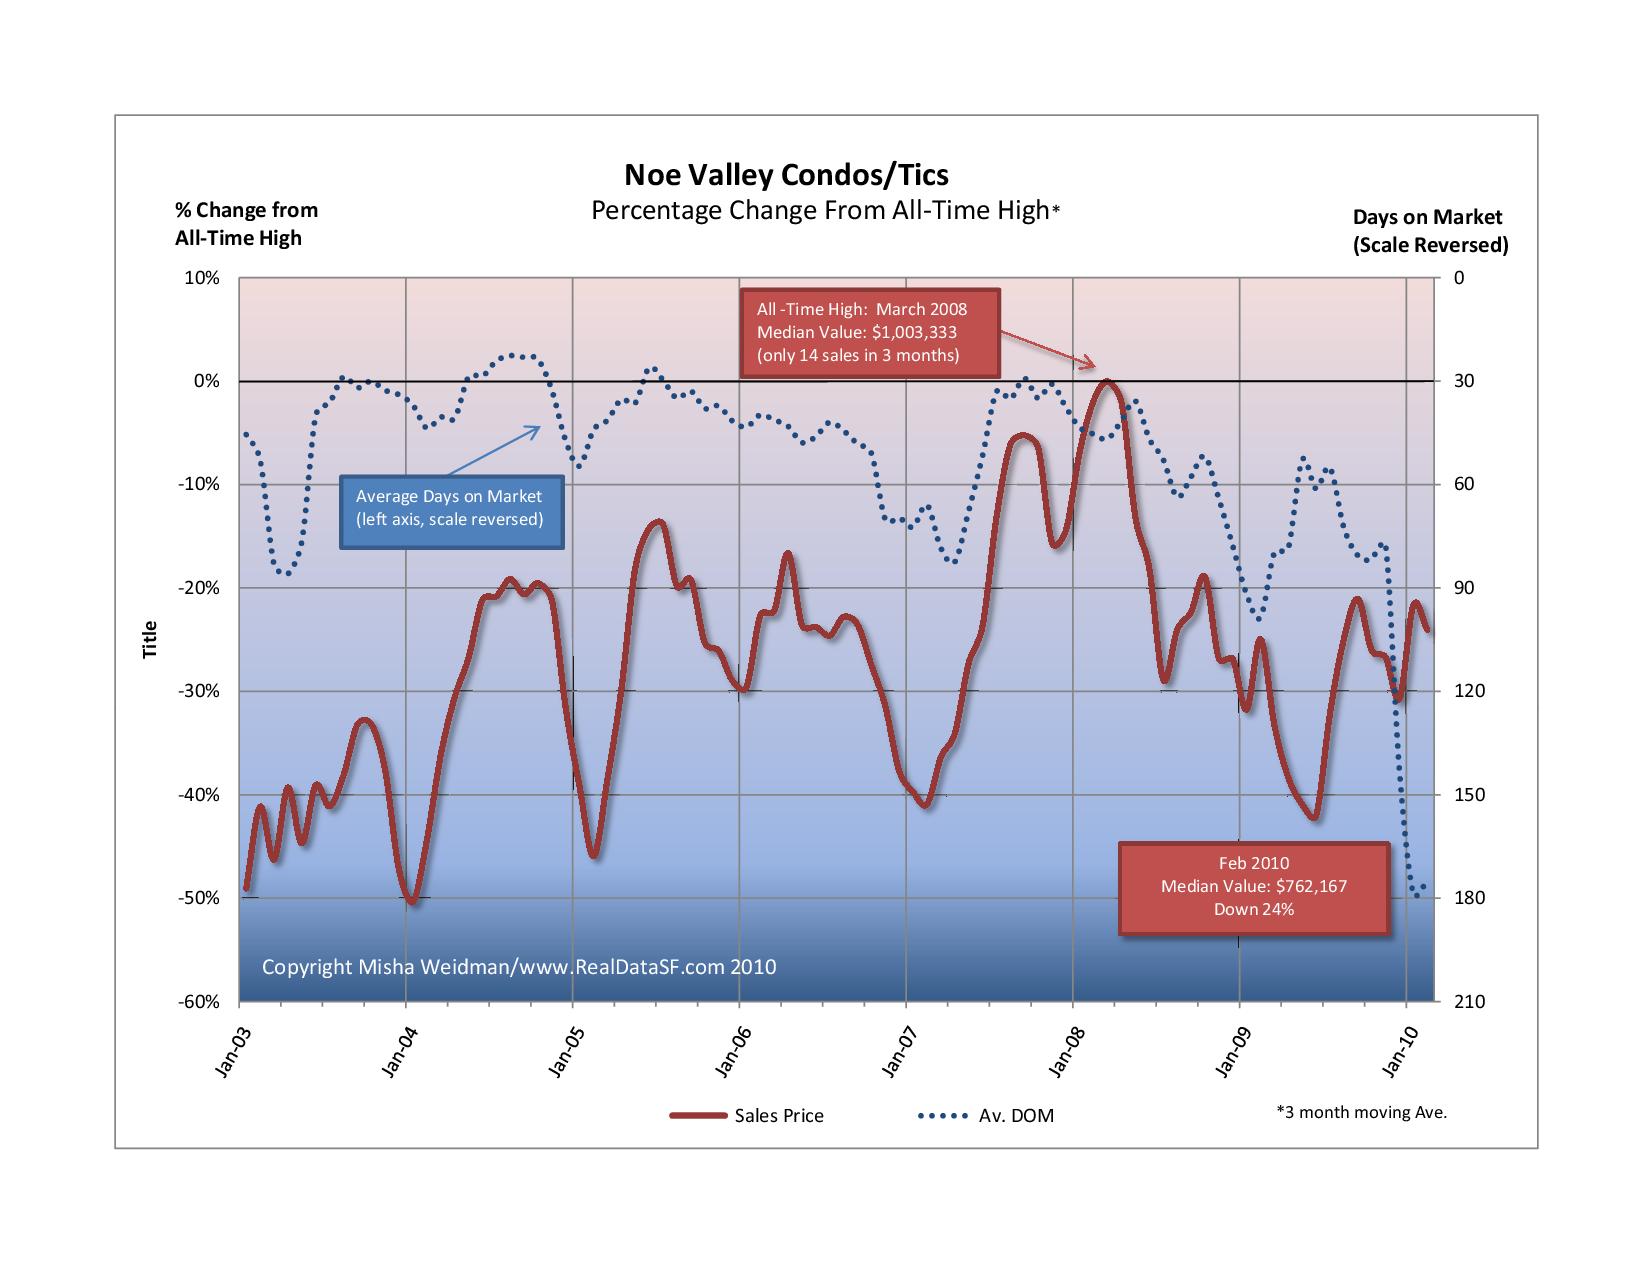
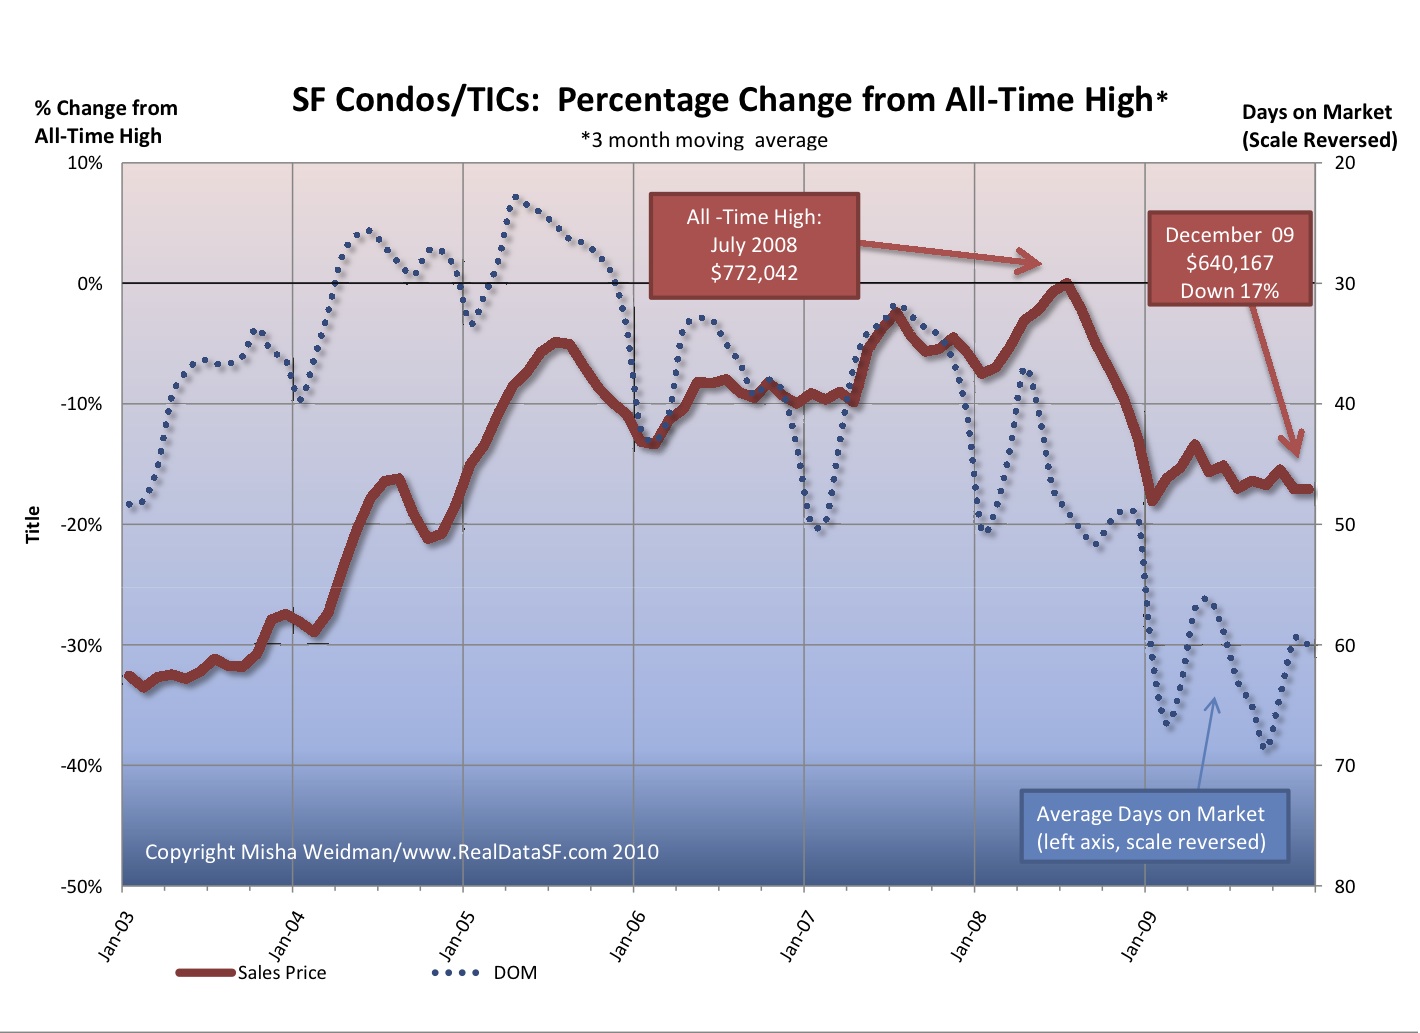
Here’s how condos and TICs have been doing as a combined group, versus their all-time highs.
That precipitous plunge (actually a huge increase since the scale is reversed) in DOM at the end of 2009 was also due to the lingering effects of 201 Hoffman.
For a shorter term view, prices through February 2010 are up 11% from January 2009 and are up a whopping 31% from the trough of June 2009. Since I use trailing 3 month averages, I think this is a belated reflection of the deep credit freeze of Spring 2009 when we thought the world might come to an end.
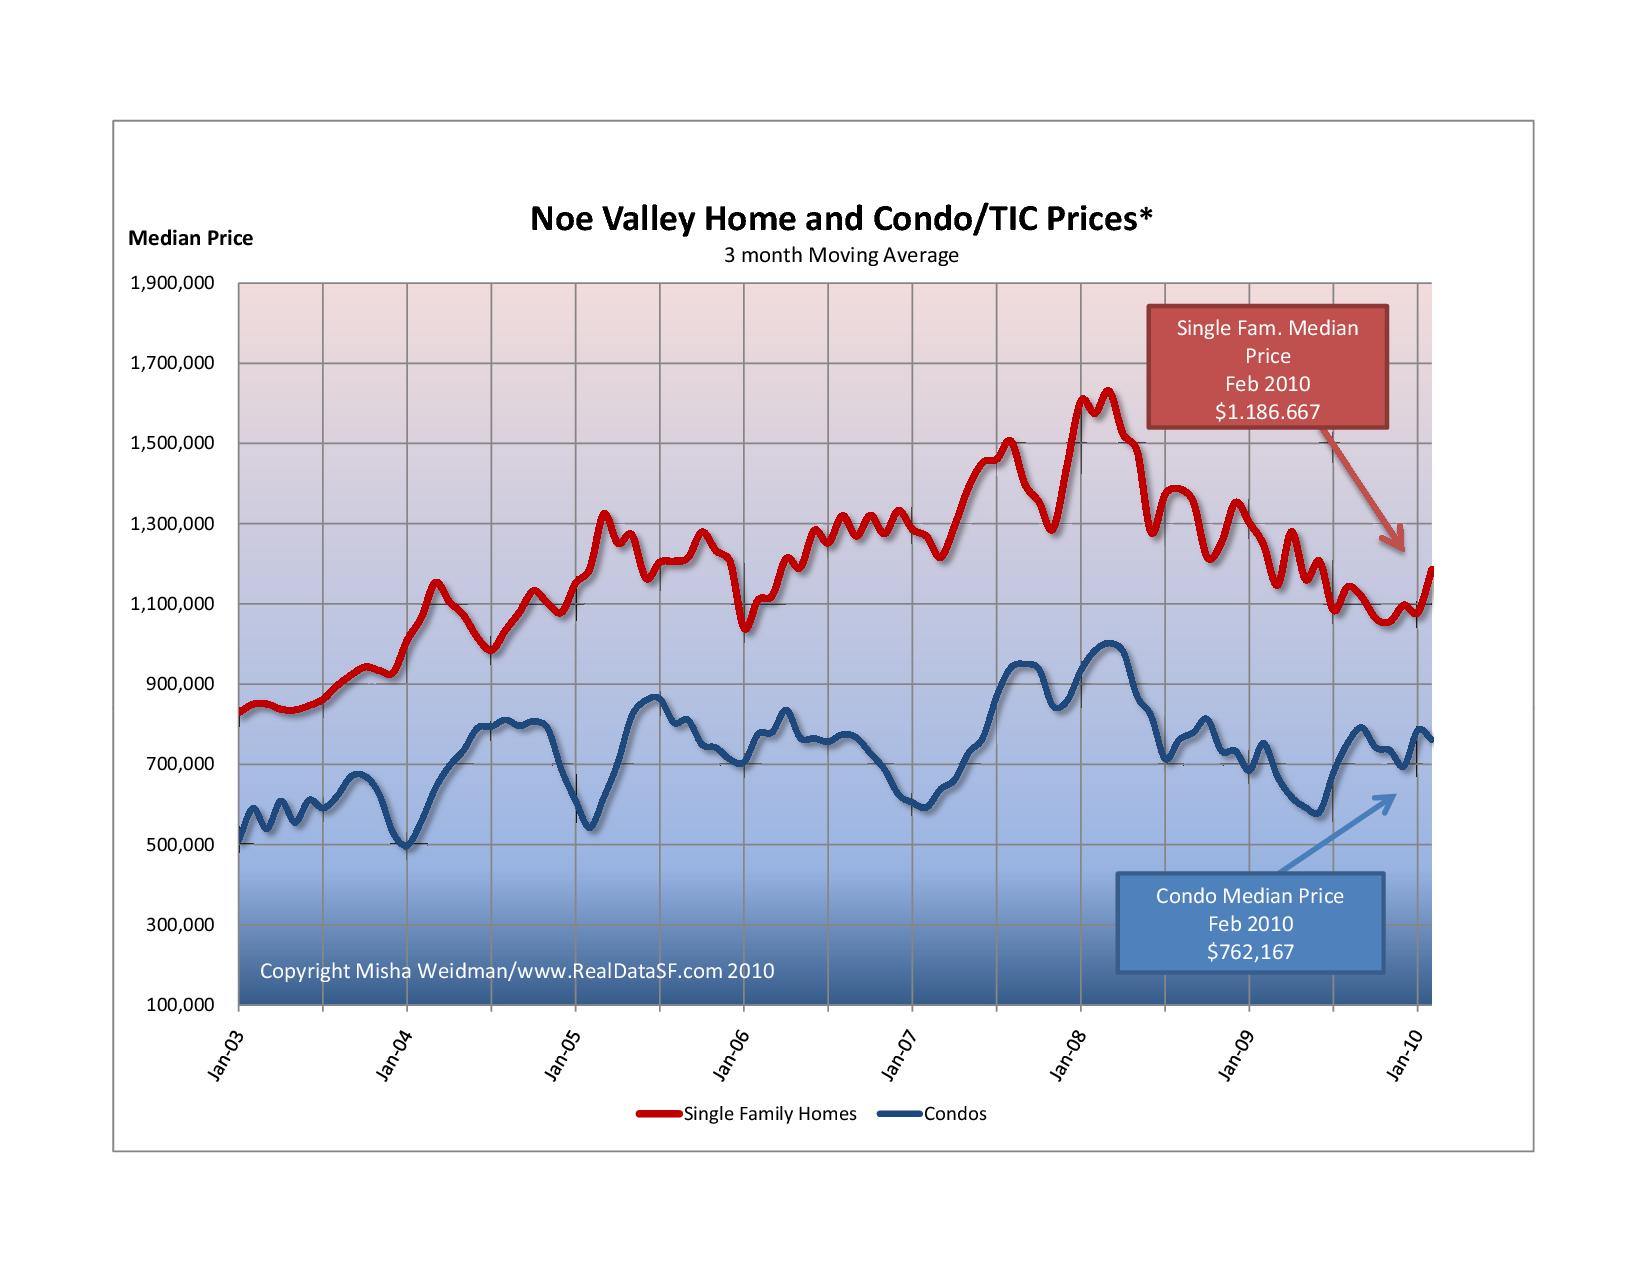
And here’s how condos and TICs stacked up against homes.
For what it’s worth, it feels like spring has really sprung. Nice-looking condos/tics are swarming with people and are moving fast — no kidding. Whether it will last is anybody’s guess.
In an article entitled Great Time to Buy (Famous Last Words), last Sunday’s New York Times took a swipe at perennially optimistic real estate agents who have never seen a time that wasn’t a good time to buy a house. Fair enough. Self-interest and magical thinking are not limited to the real estate profession.
For the record, I’ve never suggested to anyone that buying a home is a good “investment.” You can do much better in the stock market and probably even in bonds.
However, I am beginning to think that if you’re going to shackle yourself to a home, now may not be a bad time to buy. And I think the NY Times article supports my position.
Why do I think so? Most of the articles I’ve been reading suggest that the worst is over in terms of price declines, this article included. That doesn’t mean that prices couldn’t drop another 5 to 10%. But it’s a fool’s errand to try to predict the bottom (or top) of any market.
At the same time, the consensus seems to be that interest rates have nowhere to go but up, given the huge stimulus that the government’s been giving to prop up the economy. One can argue whether and when the government should choke off the spigot of easy credit, but when it does, rates are going to have to go up.
Here’s the takeaway from the NY Times article:
“Instead of betting on home prices, you make a bet on whether money will become cheaper or more expensive, allowing you to buy more or less house.”
Now it’s true that increasing interest rates ultimately lead to declining prices as tighter credit drives down demand. That’s the theory anyway. But after the huge declines we’ve already seen, it’s anybody’s guess as to when, where, or how that will happen. As the article says, “don’t go there. Maintain your focus.”
Here’s a graph from mortgage-X.com on historical blended (ie. fixed, arms, etc.) mortgage rates. Should make people who can qualify for a mortgage in this still-crazy market feel pretty good, no?
Author: Jack French -- Used under Creative Commons Permission 2.0
Back in May 2009, I showed that Noe Valley was not immune from the slump in prices affecting the rest of the city, despite suggestions to the contrary from real estate agents, mavens and media.
Have things gotten any better? Well, no. And maybe.
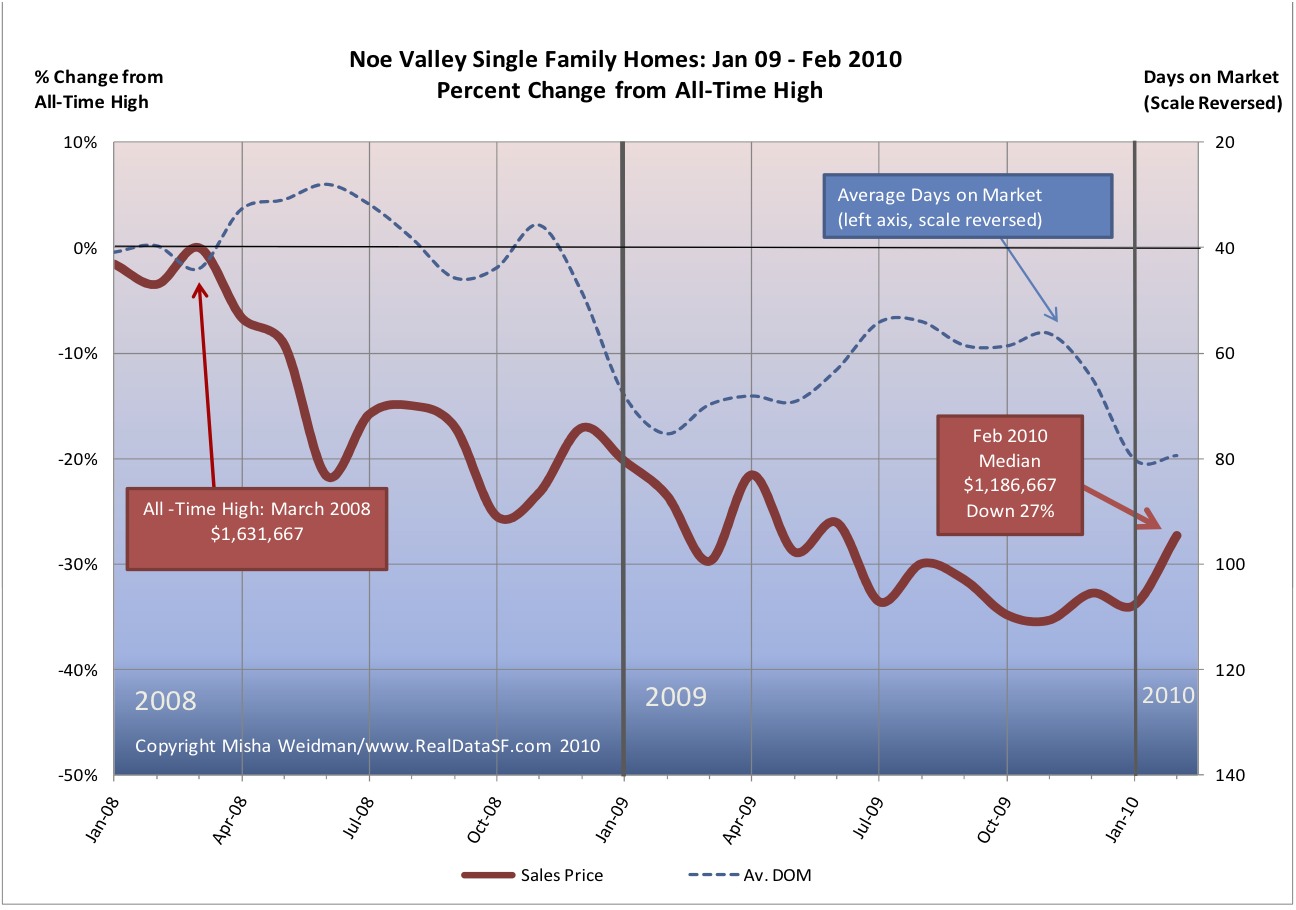
Here’s a chart showing percentage change in single family home prices for the last 14 months, relative to their all-time highs (click to enlarge). (All figures are 3 month moving averages.)
After reaching an all time high in March 2008, prices plummeted. Just a year later, in the midst of fears of a global Depression, home prices were down 30%. Did things get better? No, they got substantially worse. Despite an impressive city-wide recovery in 2009, with prices going from 30% down to around 18% down for single family homes at year’s end (see more detail here) , Noe Valley home prices continued to retreat. In October and November 2009, prices were down 35%. At year’s end, they’d barely clawed back two percentage points. Not surprisingly, days on market (DOM) remained stubbornly high for all of 2009.
Still, with cherry blossoms busting loose all over Noe Valley’s quiet streets, there certainly seems to be a change in the air. There are many more listings coming onto the market and there’s even the occasional feeding frenzy over a clean, well-priced home. These go in a matter of days, not weeks. Maybe that upturn in prices for January and February suggests a continued warming trend.
In the next few posts, I’ll look at Noe Valley in more detail, including how condos have fared.
Pretty much everything I said about how single family homes fared in 2009 also applies to the condo/TIC market. (TIC’s, aka Tenancy In Commons are similar to condos. For more information on TICs, see my three-part series starting here.)
Condo/TICs hit their all-time highs about a year later than homes did — in July 2008. But they’ve fallen from their highs almost exactly as much as homes have. Condos/TICs were down 17%, just one percent better than single family homes.
For those who prefer their data on a per square foot basis, the picture is pretty much the same. The all-time high was $711 — reached in November 2008 and the price per square foot stood at $592 at year’s end, also a drop of 17%.
While condos/TICs ended the year at the same point, the pattern has not been the same. Condos/TICs have been stuck near the bottom of their 2009 range after bouncing up in the first quarter. Homes, on the other hand, appear to have bounced up and stayed up.
What’s in store for 2010 remains anybody’s guess, but on the streets it certainly feels like spring is in the air. There are more listings coming onto the market and more people looking at them. Will that translate into sales and higher prices? That’ll depend on macro-economic trends I’ve discussed elsewhere, but one thing’s pretty clear: interest rates are heading higher, as evidenced by the Fed’s recent increase in the discount rate. If the economy continues to strengthen, that trend will continue. And, for many people, that will result in less buying power and reduced affordability.
Less than two months into the new year and a brand new decade and already 2009 may seem as far away as a bad dream – assuming you still have a job.
It’s hard to remember just how close to the brink of catastrophe we seemed to be just a year ago. Major financial institutions – failed. Credit – impossible to get. Sales—anemic.
With the benefit of hindsight, not to mention survival, some are now criticizing Paulsen, Bernanke, et al., for their haste in rescuing the financial system, but I, for one, will reserve my scorn for the appalling judgment of the likes of Morgan and Goldman and their obscene bonuses.
How did the San Francisco market do? Here’s where we are for single-family homes (click to enlarge).
We ended the year still down 18% from our all-time high of June of 2007. That puts us at around the price levels of the spring of 2005. Not great, but during those scary first months of the year when there was no bottom in sight, we were down to price levels not seen since early 2004.
It’s also interesting to see how Days on Market (DOM) inversely correlates with price, at least over longer periods. In addition to the very regular seasonal dips in price every December/January, it’s easy to see that as DOM lengthens over time, prices decline. While DOM remained less than 40 days, prices stayed high. The correlation isn’t perfect – and certainly not on month-to-month time-scales — but it looks pretty good to me.
So for the “half-empty” crowd, the bottom line is that we’re still down 18% from our all-time highs. The story looks much more positive, however, if you look at 2009 in isolation.
Now a 23% gain for the year ought to be making people feel pretty good. Note that median prices have been in the $700,000 to $800,000 bandwidth for the last three quarters. The dip in the waning months of the year can be attributed to seasonal factors.
I can already hear the nay-sayers arguing that looking at year end numbers is arbitrary or, worse, distorts the picture. (These are the same people who don’t believe in celebrating their birthdays!).
I’m certainly not arguing that happy times are here again. But , if nothing else, that 23% increase confirms just what a wild ride the last two years have been.
As for 2010, I confess I’m beginning to feel a bit more optimistic than I was a few months ago. Manufacturing seems to be continuing to expand. There are some signs of job growth. Still, Europe is now looking shaky and, closer to home, one should never discount the ability of our politicians to screw up the recovery.
All things considered, though, I’ll take my glass half-full please.
Catching up on the endless paper-work the other night, I came across that rare thing: a property that sells twice in a relatively short time with no major renovations performed in the interim.
This “sales matching” technique is what the folks at Case-Shiller use to create their Indexes of property values across the country. Part of the reason they can is that their indexes are generated for large Metropolitan Statistical Areas with lots of house sales. And even so, they use a lot of fancy foot-work to “match up” properties.
So now comes 714 Duncan Street, a beautiful 2,000 sf view home on a steep hill with fantastic city views. Listed at a disarming $1,195,000, it sold for $1,415,000 in January 2008. That was pretty much the top of the market for Noe Valley. (You can see the chart here.)
Fast-forward 18 months. The same house sells for $1,095,000 in June 2009. That’s a drop of 22.6%. My analysis of all Noe Valley sales for the same period shows a drop of just under 25% for the same period.
There’s something of a “duh, so what” to this story. But I’ve seen enough nay-sayers (on other blogs, of course!) who argue that tracking statistical medians are meaningless that I thought it was worth posting this as a powerful—and sobering — case to the contrary.
Ken Rosen is a smart guy. He’s the co-chair of the Fisher Center of Real Estate and Urban Economics at the Haas School of Business at UC Berkeley and the investment adviser of choice to some of the biggest players in real estate, from banks to insurance companies to REITS. Ken might not be able to appraise your house, but he could tell you how each sector of the real estate economy has fared anywhere in the country, and probably in many parts of the world.
Once or twice a year I spend the day in a windowless hotel conference room listening to Ken and some of the biggest heads in the real estate biz expounding on the state of real estate. These guys (and they are mostly guys) look at real estate through the lens of global macro-economics and finances. Want to know where interest rates are going? They study yield curves on T-Bills and monetary policy in the capitals of Europe. This is “the view from space.”
I reported on Ken’s predictions from November of 2008 here. (Remember, we were already in deep doo-doo, though things got worse through the first quarter of 2009.) Before moving into his predictions for 2010 and beyond, I thought it would be useful to see how well he did on on his forecasts for 2009:
The Ken Rosen Scorecard for 2009
Chance of a deep recession: 70%. Bingo.
S&P 500 at year-end under a deep recession: 850. Actual: 1115. Woops (but who said the market was rational?)
The dollar:“Will continue to do well.” Nope, it lost ground.
Not a great batting average you say? Truth is, I’m cherry-picking here. Overall, Rosen’s message in November 08 was that things were improving, but that there would be volatiility and a long, slow recovery in housing. Notwithstanding our brush with death in March — Rosen put the chance of a deep recession at 5% — his prediction on that aspect of the market seems to be holding up well. As for the dollar, given the gaping chasm that faced the global markets in the early months of 2009 – led by crashing and burning US financial institutions – the dollar’s decline shouldn’t be a surprise.
And as for the stock market and its amazing recovery, given what still seems to be looming on the horizon, I just can’t figure that one out at all.
Rosen’s Predictions for 2010
In terms of the shape of the recovery, Rosen estimates the chances of a “broken W” — read fragile recovery – at 65%. This is where I’m putting my money folks.
He estimates the chances of a more robust recovery at 25%, and that of a long , Japanese-style recession at 10%.
Expect a slow, fragile recovery, a bottoming out of the housing market, and rising long-term rates.
Estimates for the Stock Market, Year End 2010
S&P 1150; Dow 11,000
Advice for the Home-Buyer:
If there’s any good news here, it’s that Rosen thinks that the sector will come back fastest is single family housing.
Here’s the takeaway quote:
“Take advantage of the windfall tax credit and low interest rates if you’ve got a good job”
Rosen thinks that prices have bottomed (I’m not so sure). But it does appear that
REO’s (properties taken back by the banks) have declined as a percentage of all sales, and that should help to stabilize prices.
From a socio-economic perspective, housing affordability has increased significantly due to low interest rates and price declines, and that can only be viewed as good if you believe that widespread home-ownership is a public “good.” (I do.)
What could go wrong?
In a moment of brilliant serendipity, Rosen’s co-chair at the Fisher School, Bob Edelstein — no small brain himself — happened to sit next to me at lunch. In the next 30 minutes we covered everything from wine to Waziristan. His outlook was not as sanguine as Rosen’s. We didn’t get into details, but my impression was that Edelstein was more concerned than Rosen about a jobless recovery coupled with higher interest rates driven by enormous deficits.
Once again, the magic eight ball says: “Ask again later.”
Another glorious winter’s day in San Francisco. My family and I biked over the GG Bridge to Sausalito and then took the ferry back to Fisherman’s Wharf. Thirty-five years in this town and I’ve only done that ride twice. The previous time was a week ago, to celebrate my 10 year old son’s new birthday bike.
2009 was not a kind year. I feel very grateful that my family has come through in reasonable shape. It makes it easy to appreciate the fine views and the fine weather.
Exactly a year ago, I officially launched this blog. It’s been enormously gratifying writing it. First, it’s made me feel plugged into the market in ways both large and small. Secondly, because I’m a visual kinda guy, those charts that I’ve tried to make a central part of this blog have helped me understand and retain what’s going on in ways that columns of numbers just don’t. Plus, I’ve learned a heck of a lot more about Excel — and, alas, its limitations as a database — than I ever knew before.)
And finally, it’s been great to feel appreciated! Though I sometimes joke that I have a readership of 7½, it is a loyal, thoughtful and appreciative one. Well, that’s three of you anyway. 🙂
Happy New Year everyone! My best wishes to each of you, and thank you for your support.


